Abstract
The development of real-world ontologies is a complex undertaking, commonly involving a group of domain experts with different expertise that work together in a collaborative setting. These ontologies are usually large scale and have complex structures. To assist in the authoring process, ontology tools are key at making the editing process as streamlined as possible. Being able to predict confidently what the users are likely to do next as they edit an ontology will enable us to focus and structure the user interface accordingly and to facilitate more efficient interaction and information discovery. In this paper, we use data mining, specifically the association rule mining, to investigate whether we are able to predict the next editing operation that a user will make based on the change history. We simulated and evaluated continuous prediction across time using sliding window model. We used the association rule mining to generate patterns from the ontology change logs in the training window and tested these patterns on logs in the adjacent testing window. We also evaluated the impact of different training and testing window sizes on the prediction accuracies. At last, we evaluated our prediction accuracies across different user groups and different ontologies. Our results indicate that we can indeed predict the next editing operation a user is likely to make. We will use the discovered editing patterns to develop a recommendation module for our editing tools, and to design user interface components that better fit with the user editing behaviors.
Keywords: User Editing Pattern, Ontology, Collaborative Ontology Development, Data Mining Association Rule Mining
1 Collaborative Ontology Development and Related Work
Distributed and collaborative development by teams of scientists is steadily becoming a norm rather than an exception for large ontology-development projects. In domains such as the biomedicine the majority of large ontologies are authored by groups of domain specialists and knowledge engineers. The development of ontologies such as the Gene Ontology (GO) [9], the National Cancer Institute Thesaurus (NCI Thesaurus) [22] and the International Classification of Diseases (ICD-11) [29] deploy varying collaborative workflows [21]. Many of these projects have several things in common: first the ontologies are very large (e.g., GO has over 39,000 classes; ICD-11 has over 45,000). Second, many users who contribute to the ontologies are not themselves ontology experts and they do not see ontology development as part of their day-to-day activities. Indeed, the majority of ICD-11 contributors, for example, are medical professionals. At the same time, researchers have long contended that ontology development is a cognitively complex and error prone process [8,20]. The overarching goal of our research on collaborative ontology development is to develop methods that facilitate this process and make it more efficient for users.
In this paper, we explore the prediction capability of the changes that users are likely to make next using structured change logs. Ontology change logs provide an extremely rich source of information. We and other investigators have used change data from ontologies to measure the level of community activities in biomedical ontologies [14], to migrate data from an old version of an ontology to a new one [12], and to analyze user roles in the process of collaboration [6,7,23,26]. For example, we have demonstrated that we can use the change data to assess the level of stabilization in ontology content [26], to find implicit user roles [7], and to describe the collaboration qualitatively [23]. For example, we found that changes to ICD-11 tend to propagate along the class hierarchy: A user who alters a property value for a class is significantly more likely to make a change to a property value for a subclass of that class than to make an edit anywhere else in the ontology [19]. Similarly, Pesquita and Couto [18] found that structural features and the locations of changes in the Gene Ontology are predictive of where future changes will occur. Cosley et al. [5] developed an application that provided specific suggestions to Wikipedia editors regarding new articles to which they might want to contribute. The model aggregated information about the users, such as preferences and edit history. The researchers found that recommendations based on models of the user editing behaviors made the contributors four times more likely to edit any article compared with random suggestions. Walk et al. [27] explored how five collaborative ontology engineering projects unfolded by conducting Markov chain based analysis on usage logs. The social patterns and sequential patterns they found suggested that large collaborative ontology engineering projects were governed by a few general principles which determined and drove the development process. Previous publications have addressed other aspects of the user behavior patterns in their software development projects as well. Borges and Levene [4] analysed the webpage navigation patterns using a hypertext probabilistic grammar model. Previous N navigated pages were used in this model to predict the next browsing pages. Perera et al. [17] used data mining techniques to analyse the high-level information views about the group work patterns in collaborative education environment. The pattern extracted were used to improve the skills of group teaching work on substantial education projects. Agichtein et al. [1] showed that incorporating user historical behavior patterns could significantly improve the ordering of the top results in real world web search rankings.
In this paper, we explore the following hypothesis: “In large collaborative ontology development projects, the user editing patterns are persistent between adjacent time periods, and also across different user groups and different ontology projects.” The primary goal of our research is to explore the potential patterns under the ontology development workflows. The discovered patterns are used to help with the design of user interface components and edit assistant modules which could facilitate the next ontology editing operation in the development process. The user interface components and edit assistant modules are updated periodically according to the most recent ontology change logs. We use sliding window method to evaluate these periodical and continuous updating. The training and testing windows in sliding window method move along with the time after each training and testing. We use association rule mining, a popular data mining technique to extract the patterns based on the data in the training window and test the accuracies of these patterns in the testing window. We also evaluate the impact of different training and testing window sizes on the prediction accuracies. Then we evaluate the prediction power across user groups and ontology projects as well. The set of features used in the evaluations are the properties being edited. Indeed, we focus on the features and the types of pragmatic patterns that help us build more efficient interface for ontology development. Specifically, this paper makes the following contributions:
-
-
We use sliding windows to simulate and evaluate continuous prediction of ontology development workflows.
-
-
We develop method that uses a data mining technique to predict change patterns in collaborative ontology development.
-
-
We propose a set of features for association rules that describe change patterns in collaborative ontology development.
-
-
We evaluate our method by analyzing a large number of changes from change logs on two large real-world ontology development projects that are run by the World Health Organization (WHO).
Comparing with our conference version paper [28], we extended our method to the scenario of continuous prediction across time using sliding window method. We evaluated the accuracies of prediction under different settings of window sizes and gave a primary guide on window size selection in continuous prediction.
2 Preliminaries
We start by providing background on iCAT, which is a custom-tailored version of WebProtégé [25], a tool that we designed for collaborative ontology development. We then describe the two large ontologies that use WebProtégé and that we used in our evaluation. These are two ontologies in the Family of International Classifications that are developed and maintained by the WHO (Section 2.2). Finally, we provide background on association rule mining (Section 2.3), a technique that we use to find patterns of changes.
2.1 WebProtégé
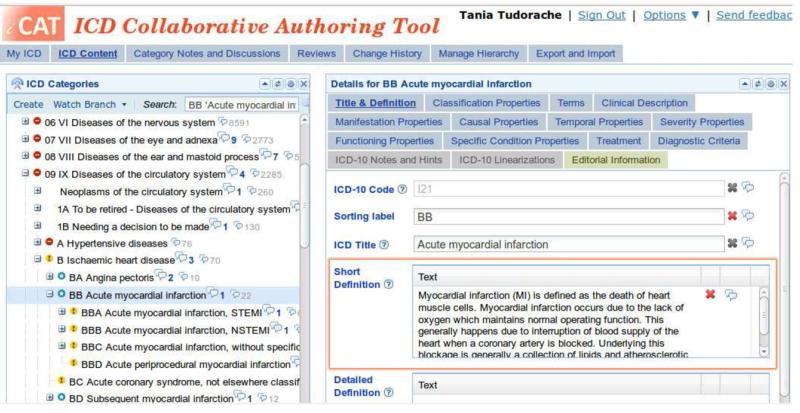
In this paper, we analyze the data from two ontologies that are developed using a custom-tailored version of WebProtégé [25], which is a web-based version of Protégé. Protégé [16] is an open-source ontology editing environment, with over 240,000 registered users world-wide. WebProtégé is available online [25] and hosts more than 8,400 ontologies that have been uploaded or created by users. WebProtégé can also be downloaded and installed on other servers. WebProtégé enables users to edit ontologies in their web browser in a distributed fashion. Users can contribute to the ontology simultaneously, comment on each other’s edits, maintain discussions, monitor changes and so on. One of the key features of WebProtégé is the ability of project administrators to custom tailor the user interface to suit the needs of a particular project. Specifically, in this paper we focus on the two ontologies that are developed in iCAT, a version of WebProtégé that is custom tailored to the data model that the WHO uses. Figure 2 shows a screen shot of a panel for editing classes in iCAT. In this figure, the left panel shows the disease class hierarchy and the right panel shows the properties of the selected disease class. Because each class (e.g., disease description) has as many as 56 properties defined in the data model, iCAT groups these properties visually into “tabs” in the user interface. Each tab is responsible for the editing of property values in the same property category. For example, the Title & Definition tab in Fig. 2 shows the properties in the category with the same name: ICD-10 Code, Sorting label, ICD Title Short Definition and Detailed Definition The Clinical Description tab and property category contains the properties: Body system, Body part and Morphology. iCAT has 15 such tabs and corresponding property categories.
Fig. 2.
The iCAT user interface used for editing the ICD-11 and ICTM ontologies
Protégé (and, hence, iCAT) keeps a detailed structured log of every change and their metadata [15] shown in Fig. 1.This log contains information about the content of the change and its provenance. A change record has a textual description, a timestamp and an author, as well as other metadata not shown in this screenshot. We focus on changes to property values in the editing of ICD-11 and ICTM, by far the most frequent operation performed by the users. For example, in ICD-11 from 182,835 total changes, 180,896 are property changes. An example of a property value change tracked by iCAT is shown in the first row of Fig. 1: Replaced Sorting label of DB Acute myocardial infarction. Old value: DB. New value BB. For each property-value change, Protégé records the following information: property name, class identifier where the change occurred, the old and new value, the author, and timestamp of the change. Based on the user interface configuration (which follows the underlying data model), there is a unique association between a property and a property category, that is each property belongs to only one property category, so we can easily associate to each change the property category in which it occurred.
Fig. 1.

Structured log of changes in Protégé and iCAT
However, Protégé is not a requirement for the method that we will describe in this paper; it is the presence of a detailed log of changes that is a requirement for the type of data mining that we present. As long as an ontology has a detailed structured log of changes available—regardless of the development environment that its authors use—it is amenable to association rule mining that we describe.
2.2 Ontologies: ICD-11 and ICTM
The 11th Revision of the International Classification of Disease (ICD-11) developed by the World Health Organization, is the international standard for diagnostic classification that health officials in all United Nations member countries use to encode information relevant to epidemiology, health management, and clinical use. Health officials use ICD to compile basic health statistics, to monitor health-related spending, and to inform policy makers. As a result, ICD is an essential resource for health care all over the world. ICD traces its origins to the 19th century and has since been revised at regular intervals. The current in-use version, ICD-10, the 10th revision of the ICD, contains more than 20,000 terms. The development of ICD-11 represents a major change in the revision process. Previous versions were developed by relatively small groups of experts in face-to-face meetings. ICD-11 is being developed via a web-based process with many experts contributing to, improving, and reviewing the content online [24]. It is also the first version to use OWL (as SHOIN(D)) as its representation format.
The International Classification of Traditional Medicine (ICTM) is another terminology in the WHO Family of International Classifications. Its structure and development process is very similar to that of ICD-11. However, it is a smaller project, which was started later than the ICD-11 project. Thus, it has benefited from the experiences of ICD-11 development and it used the tools that were already built for ICD-11. ICTM will provide an international standard terminology as well as a classification system for traditional medicine that can be used for encoding information in health records and as a standard for scientific comparability and communication, similar to ICD-11. Teams of domain experts from China, Japan, and Korea are collaborating on a web platform with the goal of unifying the knowledge of their own traditional medicines into a coherent international classification. Even though ICTM shares some of the structures with ICD-11, there are many characteristics that are specific only for traditional medicine. ICTM is also developed concurrently in four different languages (English, Chinese, Japanese, and Korean).
Data sources, We used the change logs generated by iCAT for both ICD-11 and ICTM. Table 1 shows some statistics about the ontologies and their change logs. As the statistics show, ICTM is a smaller project compared to ICD-11. While ICTM has around 1,500 classes, ICD-11 has over 45,000. ICD-11 has also a deeper class hierarchy with 11 levels, compared to ICTM which has 7 levels. ICTM had a small number of users (12) who were making actively changes for the period of our data, while ICD-11 had 90 such users. The number of change log history records also differs a lot: ICTM has 21,466 property changes, while ICD-11 has 180,896.
Table 1.
Ontology and change history statistics for ICTM and ICD-11
| Data source characteristic | ICTM | ICD-11 |
|---|---|---|
| Number of classes | 1,511 | 45,028 |
| Depth of ontology (number of levels) | 7 | 11 |
| Number of users | 12 | 90 |
| Time period | 2/7/2011-8/21/2011 | 11/19/2009-5/24/2012 |
| Total number of changes | 26,607 | 182,835 |
| Total number of property edit changes | 21,466 | 180,896 |
2.3 Association Rule Mining
The change logs generated by iCAT provide a wealth of information that we can use to extract change patterns. These patterns of change can enable us to predict what operation the user is likely to perform next, based on his current operation and other features. We used data mining for the pattern discovery task. Data mining is “the process of discovering interesting patterns from a large database” [11].
Association Rule Mining [13] is a data mining technique that explores frequent patterns in large transactional data. The frequent patterns are usually expressed in terms of the combinations of features with certain values that appear together more frequently than the others. Agrawal et al. introduced association rule mining in 1993 [2] and developed the Apriori Algorithm, a fast association rule mining algorithm, in 1994 [3]. The rules were presented in the form of inference rules with quantitative values to indicate the measure of “interestingness”. In the past decades, researchers have shown that association rules can discover and predict patterns with high efficiency and accuracy [11].
Let D be the set of n data tuples D = t1, t2,…, tn, where , with is the set of features we want to discover the associations on. Let X and Y be two disjoint events such that , and X⋂Y = ø. An association rule is an implication, X ⇒ Y, where X is called the antecedent and Y is called the consequent. The antecedent and consequent are conjunction of conditions on disjoint events. The rule provides the information on how likely Y is, given that we observed X. For example, if a user edits the title for a class (X), she may be likely to edit its definition next (Y). Therefore, association rule mining is a promising approach to predict the next editing operation that a user will make given the previous change logs. It is common to use qualitative measures of “interestingness” in order to rank and filter association rules. Two of the most popular measures of “interestingness” are support and confidence. The support of an association rule supp(X ⇒ Y) isa measure of how frequently the set of involved items appears in the data. Given event set X, support s(X) is defined as the fraction of tuples Ti ∈ D such that X ⊂ Ti. For rule X ⇒ Y,
| (1) |
is defined as apercentage of data tuples X ⋂ Y; in other words it is the probability that both X and Y happens. Support is used to filter out association rules with too few occurrences because these rules do not provide enough information about the data and they are usually rare patterns.
Confidence is a measure of how precise these rules are. For rule X ⇒ Y,
| (2) |
In other words, confidence is the probability of Y given that X happens.
3 Method Description
The main goal of our analysis is to predict what the user is likely to do next given his current action. Therefore, our data tuples are transitions from one action to the next. Each transition in our set captures two operations from the structured change log: the features describing the current operation that the user performed and the features describing the next operation. We look for co-occurrences of features of the current operation and the next operation. For example, if the user edited the title of a class and then edited the definition, then the first edit is the current operation and the edit of the definition is the next one.
3.1 Data Preprocessing
We start our data processing by performing the following two preprocessing steps: (1) feature extraction and (2) data aggregation. The first step extracts the prediction related features from change log entries. The second step aggregates consecutive elements on the same property into one data entry which will result in a cleaner and more goal-concentrated result.
3.1.1 Feature Extraction
A typical entry for a property change in the ICD-11 ontology (Fig. 1) contains: (1) the information on the user who performed the change, (2) the timestamp, (3) the class identifier on which the change occurred, and (4) a textual description of the change. The latter item, the key source of features for our analysis, looks as follows:
Replaced ‘Text’ for ‘Short Definition’ of I21 Acute myocardial infarction. Old value: Myocardial infarction (MI) is defined as of heart muscle cells. Myocardial occurs... New value: Myocardial infarction (MI) is defined as the death of heart muscle cells. Myocardial infarction occurs…
To use this log entry in our data mining analysis, we need the structured information that the change log provides and the additional features that we extract from the change description text. For example, for the change entry from the example, we extract the property on which the change occurred (i.e., Short Definition) and we associate to it the property category (i.e., Title & Definition). We then analyze the next change performed by the same user — represented by a similar string — to extract the same feature about the next operation, as well as the feature reflecting whether the next change occurred in the same class or a different one. As a result, we generate five features (see Table 2). Two features describe the current change — the antecedent features — and three features that describe the next change and the transition information — the consequent features.
Table 2.
The 5 extracted features for each record in the change log that are used for association mining
| Feature | Description of feature |
|---|---|
| NAME_OF_PROPERTY (antecedent) |
The name of the edited property (Example: Short Definition) |
| CATEGORY_OF_PROPERTY (antecedent) |
The category of the edited property (Example: Title & Definition) |
| NEXT_NAME_OF_PROPERTY (consequent) |
The name of the next edited property (Example: Body System) |
| NEXT_CATEGORY_OF_PROPERTY (consequent) |
The category of the next edited property (Example: Clinical Description) |
| NEXT_ENTITY (consequent) |
A boolean flag that describes if the next edit operation is on the same entity as the previous change, or not (Possible values: Same or Not the same) |
3.1.2 Data Aggregation
The data change log provides abundant information that captures all aspects of user editing behaviors. For example, the user might edit a few characters of a property value, click elsewhere, and then comeback and continue editing the same property. This behavior will result in two log entries describing consecutive edits to the same property. In reality though, it is usually just one editing operation from the user’s point of view. We define a consecutive operation as two editing operations by one user on the same entity and the same property or category of property within a certain time interval (e.g., one hour). We aggregate such consecutive operations into a single operation.
3.1.3 Datasets for Rule Mining
The aggregated data with selected five features are ready for association rule mining. In our work, the data processing step generates four independent data sets. For each ontology (i.e., ICTM or ICD-11), we generated two datasets: one dataset with the operations aggregated based on property category and another one aggregated on property name. The definition of property name and property category is in section 2.1.
3.2 Association Rule Mining: Apriori Algorithm
We generate the association rules by using the Apriori algorithm [3]. We use WEKA [10], the open source data mining software to generate association rules.
The Apriori algorithm contains two steps: find all itemsets and generate strong association rules from frequent itemsets. An item is defined as a feature with assignment values, such as CATEGORY_OF_PROPERTY = Tempora Properties. An itemset is the conjunction of items. The Apriori Algorithm take two thresholds as input: t_support and t_confidence. The find all frequent itemsets step will generated all the possible itemset I that satisfy support(I) > t_support. It uses the downward closure property of frequent itemsets: itemsets with more features are generated from frequent itemsets with fewer features. This property greatly reduces the search space and lowers the algorithm complexity. After finding all the frequent itemsets, the find strong association rules step divides the features in the frequent itemset I into two disjoint sets: antecedent X and consequent Y. We test the condition confidence(X ⇒ Y) > t_confidence to generate the association rules.
The following is an example of an association rule generated by WEKA based on ICTM data:

This rule indicates an association between feature CATEGORY_OF_PROPERTY, NEXT_CATEGORY_OF_PROPERTY, and NEXT_ENTITY, It shows that the users performed 101 edits in Temporal Properties, and 70 of these edits were followed by the edits in Diagnostic Method property on the same class. Therefore the confidence of this rule is 69% (i.e., 70 divided by 101).
3.3 Continuous Prediction Using Association Rules
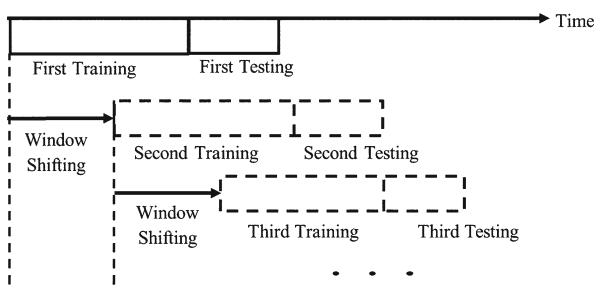
After the data preprocessing step, we first use sliding window method to simulate and evaluate the continuous prediction as shown in Fig. 3. The continuous prediction here refers to the task that patterns extracted from the previous time period was used to predict the user editing patterns in the next adjacent time period. The use of continuous prediction is based on the hypothesis that user editing pattern shares higher similarities with patterns from adjacent periods than the rest periods. We have conducted a preliminary data analysis of the user editing log data and it turns out the ontology development projects through different phases in the development life cycle. For example, in the early phase, user tends to perform more “add” operations and editing on the property “title and definition” which defines a new class of the ontology. In the later phases, however, users perform more “revise” operations on other properties which revise the content of some properties. Another observation on the ontology development life cycle is, the patterns change along with the phase of the ontology development project but the changes proceed nevertheless in a slow and continuous way. Based on these observations, intuitively the sliding window model is an adequate model to evaluate the ontology editing pattern prediction task.
Fig. 3.
Training and Prediction with Sliding Windows
In the continuous pattern prediction task, the training and testing begin with the data from two consecutive time periods respectively at the earliest ontology development phases and keep moving forward. Association rules are generated from the training data and tested on the testing data, then both the training and testing periods shift forward by some fixed amount of time window for the next prediction. For example, in one study, we choose the first training period as 3 weeks in the earliest ICTM ontology development phase, and the first testing period as the next one week. In practice, sliding window method simulates continuous and periodical updates of the user interface and editing assistant modules. The general framework of the user interface and editing assistant modules is first designed according to the knowledge from domain experts or patterns extracted from other similar or closely related ontology development projects. The user interface and the detail contents of the user editing assistant modules are adjusted periodically, such as every one week or one month. For each association rule extracted, for example, the rule
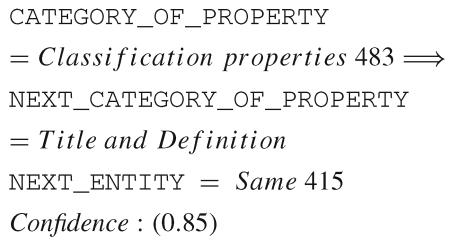 every time after the user finish his/her editing on properties of the property category Classification properties, a module will prompt with quick link to the properties of the property category Title and Definition within the same entity.
3.4 Prediction Across User Group and Ontologies
User editing patterns across user groups and ontologies can share similar patterns as well. To evaluate the prediction capability across these patterns, we split our data into two sets: a training set and a test set. We generate the association rules based on the training set and assess the confidence values of these rules in the test set. The difference in the confidence values between these two sets will indicate how much the editing patterns drift. Specifically we evaluate the drift along three dimensions: (1) different time period (2) different user groups; and (3) different ontologies. The prediction across time period is evaluated in our sliding window method in which we split the data use sliding windows. To split the data based on different group of users, we introduce a method that keeps splitting the data randomly by users into training and testing sets until the two data sets satisfy: 1) They are of roughly the same size. 2) The number of users in the two data sets are roughly the same. The advantage of splitting the data in this way is obvious. First, with two sets with roughly equal size we will have enough data for both training and testing data sets. Secondly, users with different numbers of data entries are randomized into both training and testing datasets so that no bias is introduced due to the splitting process. To split the data based on the time, we divide the data roughly in the middle of the dataset to have equal size of data for both training and testing.
4 Experimental Results
We present the experiment results in this section.
4.1 Rule Analysis for Training Data
After the data aggregation, we will generate the rules using the association mining. We filter out the rules that would not appear in practice, for example, the rule:
NEXT_CATEGORY_OF_PROPERTY=BNEXT_ENTITY = Same ⇒ CATEGORY_OF_PROPERTY = A, because the next operation NEXT_CATEGORY_OF_PROPERTY will never happen before and be the antecedent of the current operation CATEGORY_OF_PROPERTY. After the rule filtering, all the rules left are meaningful rules which follow three types:
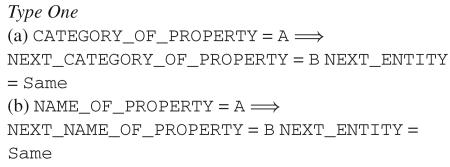
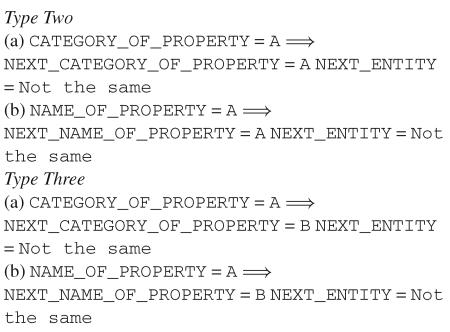
For each rule type, we show the rules generated when aggregating on the property category (rules a), and when aggregating on the property name (rules b). Type One rules capture the case where the user continues to edit the same class, but changes the property category (1a) that she edits or the property name (1b). The transition means that the following edit occurs in a different tab (1a), or in a different field on the form (1b), respectively (Fig. 2). Type Two rules describe the situation where the user focuses on editing a single property category (2a) or a single property (2b), e.g., Short Definition, for different classes: she edits the property for one class and then edits the same property for another class. Type Three rules describe the user who edits both in a different entity and a different property category (3a) or property (3b) in the next operation.
4.2 Continuous Prediction Using Sliding Windows
We first evaluate the prediction capability using sliding window method. In each iteration, a set of association rules are generated from the data within the window of training period, and tested on the data within next window of testing period. Table 3 lists the top 5 association rules generated from the ICTM data aggregated on category of property within the first sliding window. The support measure which defined in Eq. 1 is 5%. The rules are ranked by the confidence measure which defined in Eq. 2. Rule 1 states that after editing the property category Manifestation Property, users will, with probability of 89% (i.e., 83 divided by 93), edit on the property category Causal Properties within the same entity. The rest of these rules are interpreted in a similar way. Rule 2 shows that after editing the property category Diagnostic Method, users will, with probability of 78%, continue to edit on the property category Classification Property, however on another entity.
Table 3.
Top 5 Association Rules from the ICTM Data Training Window 3 weeks, Testing Window 1 weeks
| 1. CATEGORY_OF_PROPERTY = Manifestation Property 93 ⇒ NEXT_CATEGORY_OF_PROPERTY = Causal Properties NEXT_ENTITY = Same 83 Confidence (0.89) |
| 2. CATEGORY_OF_PROPERTY = Diagnostic Method 122 ⇒ NEXT_CATEGORY_OF_PROPERTY = Classification Properties NEXT_ENTITY = Not The Same 95 Confidence (0.78) |
| 3. CATEGORY_OF_PROPERTY = Classification Properties 144 ⇒ NEXT_CATEGORY_OF_PROPERTY = Body System and Structure NEXT_ENTITY = Same 95 Confidence (0.65) |
| 4. CATEGORY_OF_PROPERTY = Causal Properties 144 ⇒ NEXT_CATEGORY_OF_PROPERTY = Diagnostic Method NEXT_ENTITY = Same 78 Confidence (0.57) |
| 5. CATEGORY_OF_PROPERTY = Body System and Structure 137 ⇒ NEXT_CATEGORY_OF_PROPERTY = Manifestation Properties NEXT_ENTITY = Same 44 Confidence (0.32) |
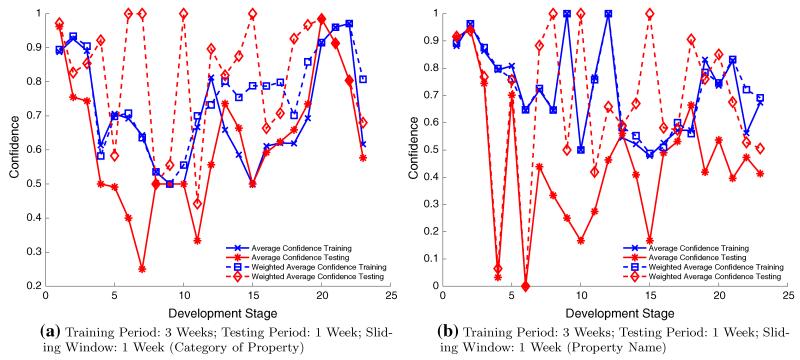
We apply the association rules generated from the training data on the testing data to simulate the prediction process. If more than 10 meaningful rules are generated from the training data, we use only the top 10 rules ranked by the measures of confidence. We calculate the confidence values of these rules in the testing data to compare with the original confidence values in the training data. The difference of the confidence values between the training and testing will indicate how much the editing patterns drift. Then we shift the training and testing windows, for example, one week forward (i.e., sliding window = 1 week) and choose the second training period as the same length as 3 weeks, and the second testing period as the next one week, and so on. We keep shifting the training and testing windows until the training and testing periods reach the most current data we have.
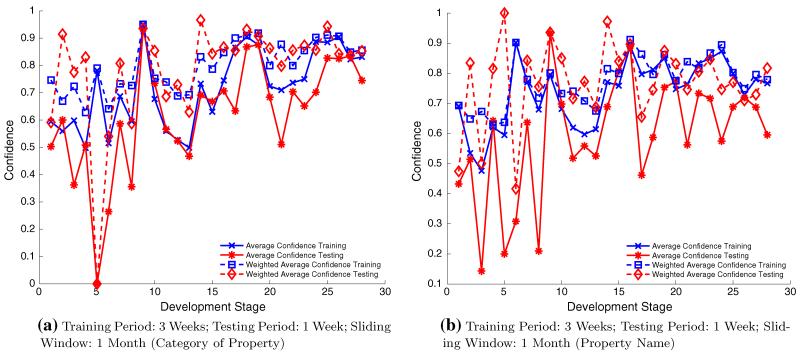
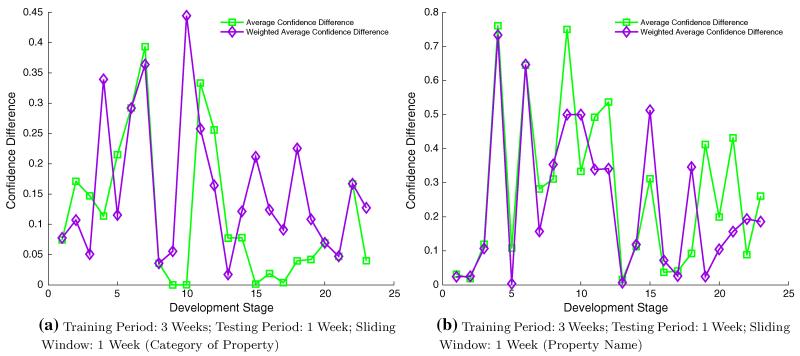
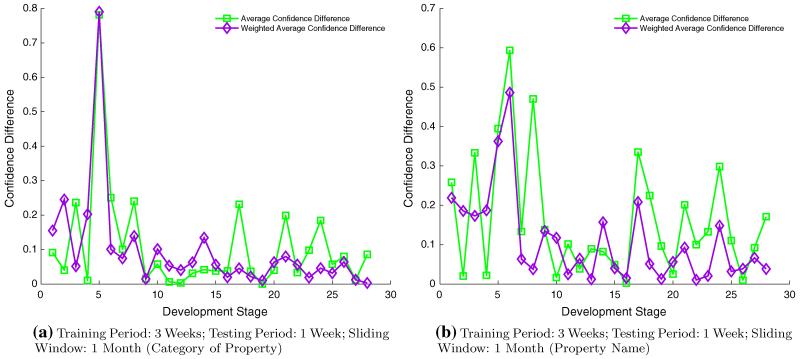
We tried different lengths of sliding windows. For ICTM, we tried one week as sliding window. For ICD-11, we tried one month as the sliding window because the data size is much larger (i.e., about 3 years data). There would be too many tests to be conducted if we still use 1 week as the sliding window. The experiment results are presented in Fig. 4 and Fig. 5. Figure 4 shows the results based on the ICTM ontology for both category of property and property name. Similarly, Fig. 5 shows the results based on the ICD-11 ontology for both the category of property and the property name. Two metrics, average confidence and weighted average confidence are used to evaluate the continuous prediction accuracies. The average confidence is defined as the average of confidences of top 10 association rules generated in the training periods and tested in the testing periods. The weighted average confidence is the average confidence with weights as the support measure for each association rule. Basically we time the confidence measure of each rule with its support measure as its weighted confidence. If the average confidences or weighted average confidences of the rules from training period are closer to the average or weighted average confidences of the same set of rules in the testing data, it shows a better continuous prediction accuracy. The differences of average confidences and weighted average confidences between training and testing periods are shown in Fig. 6 and Fig. 7.
Fig. 4.
Continuous Prediction with Sliding Windows on the ICTM Ontology
Fig. 5.
Continuous Prediction with Sliding Windows on the ICD-11 Ontology
Fig. 6.
Differences of Confidences between Training and Testing Periods on the ICTM Ontology
Fig. 7.
Differences of Confidences between Training and Testing Periods on the ICD-11 Ontology
Comparing the results from ICD-11 and ICTM, the results from ICD-11 show much clearer patterns and trends. As shown in Fig. 5, the average and weighted average confidences proceed approximately in ascending manner along with the ontology development phases. This is mostly because in the early ontology development phase, the editing tasks are more diverse while in the later phases the tasks are more likely to focus on some specific kind of tasks such as updating or revision of class properties. Moreover, for the similar reason the prediction accuracies are better in the later ontology development phases as well. As shown in Fig. 7, the differences of average confidences and weighed average confidences between training and testing periods become smaller in the later phase, which means the prediction accuracies of the rules become better. Although there is some similarity, the continuous prediction results from ICTM have less clear patterns or trends. It is mainly because the ICTM data have much shorter lifecycles and less number of users.
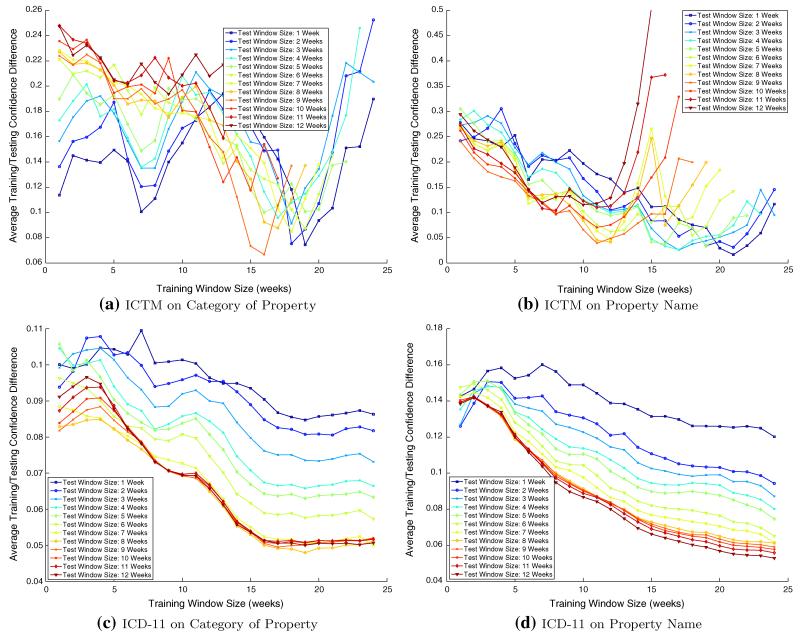
To further evaluate rate of the user pattern drifting and the impact of different sliding window sizes, we then run our sliding window experiment under the settings of different window sizes. We use the average difference between training and testing confidences across the whole ontology life cycle to evaluate the impact of varying the window sizes. Fig. 8 show the average difference of the training and testing confidences of the ICTM and ICD-11 data. The smaller value in this figure indicates a similar confidence values between the training and testing, therefore a better prediction. Each line in this figure stands for the results under the setting of one training window size varying from 1 week to at most 12 weeks. Each point on the line stands for the result under the testing window size varying from 3 weeks to 24 weeks. Figure 8a, b present the results from the ICTM data aggregated on category of property and property name respectively. In both cases, the lowest differences between training and testing were achieved at the setting with the training window size of around 16 weeks and testing window size of 8 weeks. When the testing window size is 1 or 2 weeks, under the two training window sizes, 6 weeks and 18 weeks, the prediction accuracies reach local optimals as well. The curve of the prediction accuracies in these two figures are in the form of polymorphic function with one or two local optimals. When the training window size is larger than 20 weeks, the prediction accuracies deteriorate very quickly under all testing window size settings.
Fig. 8.
Accuracy with Different Window Size in Continuous Prediction
Figure 8(c) and 8(d) present the results from the ICD-11 data. Comparing with the patterns from the ICTM data, the patterns from the ICD-11 data are more consistent. The prediction accuracies for each line in these two figures gradually increase along with the increasing of the training window size. A near flat curve is achieved after the training window size reaches 15 weeks and 20 weeks in these two figures respectively. This means in the ICD-11 project the most recent 15 to 20 weeks data is enough to make an accurate prediction. In both of the two figures, the choices of the testing window sizes from 8 weeks to 12 weeks result in the best predictions. In results from the ICD-11 data aggregated on property category, the choice of testing window of 8 weeks achieves the best prediction although it is just slightly better than the rest of choices. Similarly, in the results from the ICD-11 data aggregated on the property category, the best prediction result is achieved at the testing window of 12 weeks. Our further experiment indicates that the even larger test window sizes will return a slightly better result.
The difference of the prediction accuracies between the ICTM and ICD-11 project with regarding to the size of sliding windows is mostly because ICD-11 is a more mature project at its mid-age development phase. Most of the work in this phase involves minor revisions and updates of the well constructed classes and entities on the property contexts and values. Because the ontology editing workflows in this phase are more consistent, the patterns generated from the change logs in larger training window sizes in the ICD-11 project still reflex the consistent user editing workflows in current editing phase, thus will return a good editing prediction accuracy as well. On the other hand, the ICTM ontology is still in its early development phase, the editing task patterns shift much more quickly than in the ICD-11 ontology. The data logs in a large training window, for example larger than 20 weeks, are very likely to involve in patterns from different ontology development phases under various development goals and schedules, thus the prediction accuracy deteriorates very quickly along with the increasing of training window size.
In summary, comparing the experiment results from both the ICTM and ICD-11 ontologies with different choices of training and testing window sizes, the choice of window sizes at the early phase of ontology development project is harder. We suggest a moderate training window from 2 weeks to 6 weeks since experiments under these window sizes achieve curves that are more consistent than other window sizes. The choice of testing window size could be either 6 weeks or 18 weeks for the data aggregated on category of property and 10 weeks or 20 weeks for the data aggregated on property name. Generally speaking, even in the early phase of the project, a proper choice of training and testing window can still bring us with a good enough prediction. The confidence difference between the training and testing in this case will be 5%. For the mid-age or later phase ontology development project, we suggest larger training and testing window sizes because the patterns underneath the data are more consistent. We suggest to choose the training window size of 8 weeks or even larger if enough computation resource and data are available. For the testing window size we suggest to choose a window size 15 weeks or more.
4.3 Prediction Across User Groups
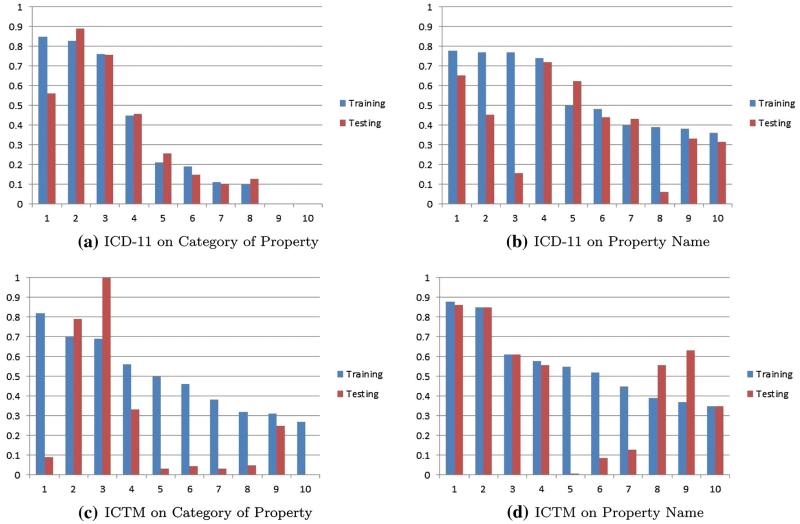
In this experiment, the training and testing data are split according to the user groups. Recall that to ensure a stable testing result, we have the following data splitting requirement as described in section 3.4: (1) They are of roughly the same size. (2) the number of users in the two data sets are roughly the same. To reach these requirement, we develop the following process to split the data: the user groups was first ranked in descending order according to the number of users they have, each user group was then iteratively add into the training and testing data. With this method the number of user groups in training and testing data have a difference of at most one and the difference of number of users between the two data sets is as small as possible as well. Figure 9 shows a set of prediction results measured by the confidence values from the training and testing data of ICTM and ICD-11. We can see that the results from the ICD-11 data have a good prediction accuracy (i.e., the similarity of confidence values from the training and testing data) and are better than the results from the ICTM data. The prediction results from the ICTM data aggregated on the property name are better than results from the data aggregated on the category of property. It shows the users in ICD-11 have similar editing patterns.
Fig. 9.
Prediction Across User Groups
4.4 Prediction Across Ontologies
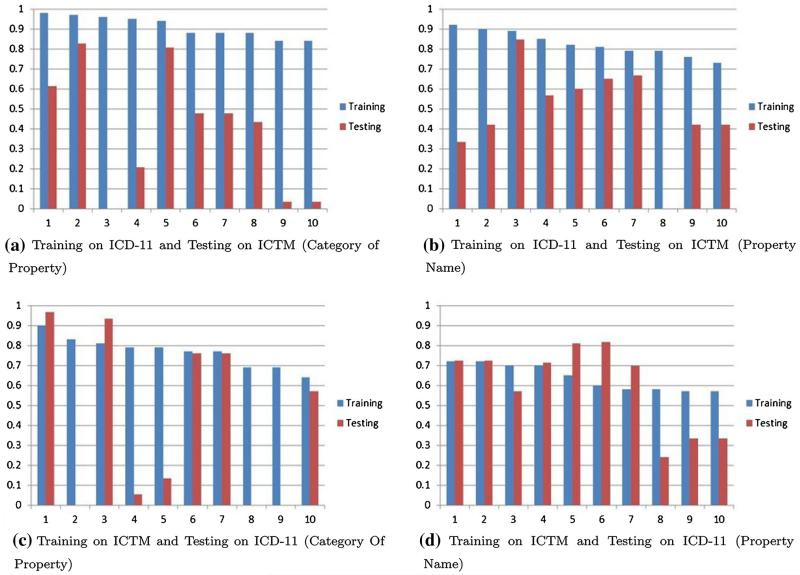
The prediction across ontologies does not require specific splitting of the data set. The association rules generated from one ontology was tested on the other ontology, in our experiment the ICTM and the ICD-11 ontology respectively. We report the prediction results across ontologies (Fig. 10). There are two scenarios in our study: 1) We use the ICD-11 data as the training data and the ICTM data as the testing data. 2) We use the ICTM data as the training data and the ICD-11 data as the testing data. We can see in Fig. 10 that prediction results from the data aggregated on property name are still better than the results from the data aggregated on category of property. On the other hand, using ICTM to predict ICD-11 based on the data aggregated on property name is a little better than using ICD-11 to predict ICTM. It may be because that ICTM use the property names which have been used in ICD-11. Prediction across ontologies might not be as accurate as the ones from across time and across user groups, however they still share plenty of similarities especially on top frequent patterns.
Fig. 10.
Prediction Across Ontologies
5 Discussion
Our findings in this paper give us clear insights into the ontology editing workflows. Our main motivation is to better support the users in their ontology development tasks, and we will be able to achieve this now in a more informed way because we have data-backed findings of editing patterns and a better understanding of the editing workflows.
Our experiments show the ability of our method to continuously predict user editing patterns in ontology development projects. Recall that in section 3.3 we mentioned our preliminary analysis shows that the ontology development project goes through different phases in the development life cycle. The user editing patterns will shift in a slow but continuous way through out all phases in the life cycle. The continuous prediction ability is crucial in the sense that the shift of patterns requires our periodically adjustments of the user interface and the editing assistant modules accordingly.
The two ontology development projects ICTM and ICD-11 show different patterns in the continuous prediction. The ICD-11 results show a more clear trend and better prediction accuracies than the ICTM results. It is interesting that our experiments show data from the later ontology development phases have better prediction power than the early phases. Deeper investigation of the patterns from initial and later phases of the ontology development projects indicates that in the later phases the users tend to focus on limited number of tasks. Thus, in the later phases when the workflows of the users are more established, the continuous prediction would work better than in the initial phases, in which changes are much more diverse. Similarly, the continuous prediction works better, if the training periods “catch” the same development phase as the testing periods. For example, the training periods might be from the phase when users filled in a lot of definitions, but the testing periods take place in a different development phase of the project when the users are finetuning the hierarchy. The variation of patterns indicates that at different phases of the ontology development project, the project should adjust the prediction parameters in a distinct way, specifically the size of data used for rule generation (corresponds to the training window size) and the frequency of updating the module content (corresponds to the testing window size).
One lesson we learned from the editing workflow patterns is that the user editing patterns usually originate from multiple instead of single factor in the ontology development projects, such as the requirements of the ontology or the ontology contributors and the design of the collaborative Protégé interface so on and so forth. For example, in the early development phase of both of the ontology development projects, the pattern
 occurs with a dominant frequency, however this pattern gradually vanishes in later phases in both the ICTM and the ICD-11 projects. This Title and Definition transitive pattern is a typical example of the patterns that originate from the requirements of the ontology project. In the early phases of the ontology development projects, user need to add more Title and Definitions for the new created classes in the ontology while in the later phase the work load transit more to the revision of properties of the established classes. The organization structure of collaborative Protégé interface is another source of the frequent user editing patterns. In the patterns from the data aggregated by property names, we found that the NAME_OF_PROPERTY and the NEXT_NAME_OF_PROPERTY are very likely to belong to same property category. Recall that WebProtégé interface groups the property names of the same property category under one single tab (see Figure 2), the users who edit under one tab, i.e., the same property category, would be very likely in their next operations under the same tab. The tab structured organization facilitates the batch user editing work for a set of property names under the same property category, however, the rest of workflows, such as add terms for the Manifestation Property for a set of entities, are not captured. The wish to cover more editing workflows in ontology development projects is in fact our very first motivation that leads to the findings in our paper.
For our findings from the experiments on prediction across user group and ontology projects, in general, rules that are generated based on property name rather than property category appear to be more predictive. Indeed, a closer look at the data reveals that in the case of ICTM, patterns were particularly different. For example, only two property categories(Title & Definition and Classification Properties) account for almost 90% of the training data in both cases. Thus, half of the users edited only these two property categories, and did so at the beginning of the observation period. Another reason for better prediction results on property names compared to property categories could be because we had more data in the latter case: consecutive edits on different properties in the same category (a frequent editing pattern) were aggregated in the data preprocessing step. In general, the more training data we have, the more reliable the data mining and prediction results are. For the same reason, ICD-11 results show better predictive value than ICTM results: we had considerably more data for ICD-11. It will be interesting to see, as we get more change logs from the users, whether or not the prediction accuracies for ICTM improve as well. We have also observed that in cross-ontology prediction, ICTM rules were better predictors for ICD-11 rules than the other way around. Indeed, our data captures the earlier phases of the ICTM development life cycle, the ICTM editors focused on the more basic properties, and only occasionally ventured into the more advanced properties. Thus, the rules capturing the basic properties carry over well to ICD-11, but there is not enough data — and the patterns are not yet established — for the other properties.
The rules and patterns that we identified have given us important feedback on how we can improve the user interface to support the users’ editing patterns better. For instance, we have seen that both in ICTM (Table 3, rules 1 and 4), and especially in ICD-11 (Table 3, rules 1-4), users are editing the same property category over and over again, but in different classes. This rule means that we can improve the editing experience, if our user interface will preserve the same tab when the user switches to a different class. Furthermore, we have identified that the users are editing the same property for different classes very often. The predominance of this type of rules indicates that we should support a tabular type of user interface that makes it easier for users to edit the same property for different classes. For example, a spreadsheet-like tabular interface could contain in each row a column for the class, another for its title and a third one for its definition. This type of interface would very likely speed the data entry and support the editing patterns we have identified in a datadriven way.
The key lesson from the previous observations is the need for including in the analysis not only the change data but also the data on the life cycle of the ontology and the roles of the user. In our earlier work, we demonstrated that it is possible to distinguish different user roles by analyzing the change data [7]. Integrating these two analyses will likely produce better predictions. For example, we can analyze the change data for each user individually, or for a set of users with the same role, and use data mining on this subset to predict what that particular user is likely to do next. Similarly, accounting for the distribution of the features themselves in the data will enable us to capture yet another key aspect of changing logs.
6 Conclusions
In this paper, we analyzed the user editing pattern in ontology development projects with the help of data mining algorithms, specifically association rule mining. The experiment results show that the patterns we generated from the ontology editing history provide useful and straightforward patterns that could assist the design of a better ontology-editing software by focusing the user’s attention on the components that are likely to be edited next. We can use the discovered editing patterns to develop a recommendation module for our editing tool, and to design user interface that are better fitted with the user editing behaviors. We evaluated continuous prediction across time using the sliding window model to simulate the periodical prediction and adjustment of user editing assistant modules. We also evaluated the impact of different window sizes on the prediction accuracies.
In order to achieve better predictive power in the data mining, future analyses must also account for patterns mining for the user interfaces that are custom designed for specific user groups and development phases. However, our initial results reported in this paper point the way to the data-driven development of user interfaces that alleviates the cognitive load of complex tasks such as ontology editing for domain experts.
Acknowledgments
This work was supported by grants GM086587, EB007684, and GM103309 from the US National Institutes of Health.
Contributor Information
Hao Wang, Department of Computer and Information Science, 1202 University of Oregon, Eugene, OR 97403, USA.
Tania Tudorache, Stanford Center for Biomedical Informatics Research, Stanford University, 1265 Welch Road, Stanford, CA 94305, USA.
Dejing Dou, Department of Computer and Information Science, 1202 University of Oregon, Eugene, OR 97403, USA.
Natalya F. Noy, Stanford Center for Biomedical Informatics Research, Stanford University, 1265 Welch Road, Stanford, CA 94305, USA
Mark A. Musen, Stanford Center for Biomedical Informatics Research, Stanford University, 1265 Welch Road, Stanford, CA 94305, USA
References
- 1.Agichtein E, Brill E, Dumais S. Improving web search ranking by incorporating user behavior information; ACM SIGIR International Conference on Research and Development in Information Retrieval; 2006.pp. 19–26. [Google Scholar]
- 2.Agrawal R, Imielinski T, Swami AN. Mining association rules between sets of items in large databases; ACM SIGMOD International Conference on Management of Data; 1993.pp. 207–216. [Google Scholar]
- 3.Agrawal R, Srikant R. Fast algorithms for mining association rules; International Conference on Very Large Data Bases; 1994.pp. 487–499. [Google Scholar]
- 4.Borges J, Levene M. Data mining of user navigation patterns; Revised Papers from the International Workshop on Web Usage Analysis and User Profiling; 2000.pp. 92–111. [Google Scholar]
- 5.Cosley D, Frankowski D, Terveen L, Riedl J. Suggestbot: Using intelligent task routing to help people find work in wikipedia; International Conference on Intelligent User Interfaces; 2007.pp. 32–41. [Google Scholar]
- 6.De Leenheer P, Debruyne C, Peeters J. Towards social performance indicators for community-based ontology evolution; Workshop on Collaborative Construction, Management and Linking of Structured Knowledge at the International Semantic Web Conference; 2009. [Google Scholar]
- 7.Falconer SM, Tudorache T, Noy NF. An analysis of collaborative patterns in large-scale ontology development projects; International Conference on Knowledge Capture; 2011.pp. 25–32. [Google Scholar]
- 8.Gibson A, Wolstencroft K, Stevens R. Promotion of ontological comprehension: Exposing terms and metadata with web 2.0; Workshop on Social and Collaborative Construction of Structured Knowledge; 2007. [Google Scholar]
- 9.GO Consortium Creating the Gene Ontology resource: design and implementation. Genome Research. 2001;11(8):1425–1433. doi: 10.1101/gr.180801. [DOI] [PMC free article] [PubMed] [Google Scholar]
- 10.Hall M, Frank E, Holmes G, Pfahringer B, Reutemann P, Witten IH. The WEKA data mining software: an update. SIGKDD Explorations. 2009;11(1):10–18. [Google Scholar]
- 11.Han J, Kamber M. Data Mining: Concepts and Techniques. Morgan Kaufmann Publishers. 2001 [Google Scholar]
- 12.Hartung M, Kirsten T, Gross A, Rahm E. Onex: Exploring changes in life science ontologies. BMC Bioinformatics. 2009;10(1):250. doi: 10.1186/1471-2105-10-250. [DOI] [PMC free article] [PubMed] [Google Scholar]
- 13.Hipp J, Guntzer U, Nakhaeizadeh G. Algorithms for association rule mining – A general survey and comparison. SIGKDD Explorations. 2000;2(1):58–64. [Google Scholar]
- 14.Malone J, Stevens R. Measuring the level of activity in community built bio-ontologies. Journal of Biomedical Informatics. 2013;46(1):5–14. doi: 10.1016/j.jbi.2012.04.002. [DOI] [PubMed] [Google Scholar]
- 15.Noy NF, Chugh A, Liu W, Musen MA. A framework for ontology evolution in collaborative environments. International Semantic Web Conference.2006. pp. 544–558. [Google Scholar]
- 16.Noy NF, Sintek M, Decker S, Crubezy M, Fergerson RW, Musen MA. Creating semantic web contents with Protégé-2000. IEEE Intelligent Systems. 2001;16(2):60–71. [Google Scholar]
- 17.Perera D, Kay J, Koprinska I, Yacef K, Zaiane OR. Clustering and sequential pattern mining of online collaborative learning data. IEEE Transactions on Knowledge and Data Engineering. 2009;21(6):759–772. [Google Scholar]
- 18.Pesquita C, Couto FM. Predicting the extension of biomedical ontologies. PLoS Computational Biology. 2012;8(9) doi: 10.1371/journal.pcbi.1002630. [DOI] [PMC free article] [PubMed] [Google Scholar]
- 19.Pöschko J, Strohmaier M, Tudorache T, Noy NF, Musen MA. Pragmatic analysis of crowd-based knowledge production systems with iCAT analytics: Visualizing changes to the ICD-11 ontology; AAAI Spring Symposium on Wisdom of the Crowds; 2012.pp. 59–64. [Google Scholar]
- 20.Rector AL, Drummond N, Horridge M, Rogers J, Knublauch H, Stevens R, Wang H, Wroe C. OWL pizzas: Practical experience of teaching OWL-DL: Common errors & common patterns; International Conference on Knowledge Engineering and Knowledge Management; 2004.pp. 63–81. [Google Scholar]
- 21.Sebastian A, Noy NF, Tudorache T, Musen MA. A generic ontology for collaborative ontology-development workflows; International Conference on Knowledge Engineering and Knowledge Management.2008. pp. 318–328. [Google Scholar]
- 22.Sioutos N, de Coronado S, Haber M, Hartel F, Shaiu W, Wright L. NCI Thesaurus: A semantic model integrating cancer-related clinical and molecular information. Journal of Biomedical Informatics. 2007;40(1):30–43. doi: 10.1016/j.jbi.2006.02.013. [DOI] [PubMed] [Google Scholar]
- 23.Strohmaier M, Walk S, Poschko J, Lamprecht D, Tudorache T, Nyulas C, Musen MA, Noy NF. How ontologies are made: Studying the hidden social dynamics behind collaborative ontology engineering projects. Journal of Web Semantics. 2013;20:18–34. doi: 10.1016/j.websem.2013.04.001. [DOI] [PMC free article] [PubMed] [Google Scholar]
- 24.Tudorache T, Falconer SM, Nyulas CI, Noy NF, Musen MA. Will semantic web technologies work for the development of ICD-11?; International Semantic Web Conference; 2010.pp. 257–272. [Google Scholar]
- 25.Tudorache T, Nyulas C, Noy NF, Musen MA. WebProtégé: A collaborative ontology editor and knowledge acquisition tool for the web. Semantic Web Journal. 2013;4(1):89–99. doi: 10.3233/SW-2012-0057. [DOI] [PMC free article] [PubMed] [Google Scholar]
- 26.Walk S, Poschko J, Strohmaier M, Andrews K, Tudorache T, Noy NF, Nyulas C, Musen MA. Pragmatix: An interactive tool for visualizing the creation process behind collaboratively engineered ontologies. International Journal on Semantic Web and Information Systems. 2013;9(1):45–78. doi: 10.4018/jswis.2013010103. [DOI] [PMC free article] [PubMed] [Google Scholar]
- 27.Walk S, Singer P, Strohmaier M, Tudorache T, Musen M, Noy N. Discovering beaten paths in collaborative ontology-engineering projects using markov chains. Accepted for Publication in Journal of Biomedical Informatics. 2014 doi: 10.1016/j.jbi.2014.06.004. [DOI] [PMC free article] [PubMed] [Google Scholar]
- 28.Wang H, Tudorache T, Dou D, Noy NF, Musen MA. Analysis of user editing patterns in ontology development projects; International Conference on Ontologies, Databases and Application of Semantics.2013. pp. 470–487. [Google Scholar]
- 29.World Health Organization [Last accessed: Oct, 2014];International classification of diseases (ICD) http://www.who.int/classifications/icd/revision/en/


