Abstract
In this work we first introduced a recently developed high-resolution, deep-tissue imaging technique, ultrasound-switchable fluorescence (USF). The imaging principles based on two types of USF contrast agents were reviewed. To improve USF imaging techniques further, excellent USF contrast agents were developed based on high-performance thermoresponsive polymers and environment-sensitive fluorophores. Herein, such contrast agents were synthesized and characterized with five key parameters: (1) peak excitation and emission wavelengths (λex and λem), (2) the fluorescence intensity ratio between on and off states (IOn/IOff), (3) the fluorescence lifetime ratio between on and off states (τOn/τOff), (4) the temperature threshold to switch on fluorophores (Tth), and (5) the temperature transition bandwidth (TBW). We mainly investigated fluorescence intensity and lifetime changes of four environment-sensitive dyes [7-(2-Aminoethylamino)-N,N-dimethyl-4-benzofurazansulfonamide (DBD-ED), St633, Sq660, and St700] as a function of temperature, while the dye was attached to poly(N-isopropylacrylamide) linear polymers or encapsulated in nanoparticles. Six fluorescence resonance energy transfer systems were invented in which both the donor (DBD-ED or ST425) and the acceptor (Sq660) were adopted. Our results indicate that three Förster resonance energy transfer systems, where both IOn/IOff and τOn/τOff are larger than 2.5, are promising for application in future surface tissue bioimaging by USF technique.
Index Terms: Bioimaging, Nanomaterials, FRET, Environment-sensitive, Thermosensitive
I. Introduction
It is always intriguing to reveal information in deep tissue by noninvasively imaging techniques, which is critical for studying tissue structures, functions, and dysfunctions [1, 2]. However, most biological tissues are optically opaque to human eyes. Therefore, an imaging technique is indispensable [2]. Optical microscopy, such as conventional wide-field microscopy and confocal or multiphoton microscopy, is excellent in spatial resolution (<1 µm) and can provide subcellular images [3], [4]. However, its imaging depth is significantly limited in opaque biological tissues (<1 mm) due to strong light scattering [4]. Besides cellular or subcellular information at very superficial tissue, deep tissue information is also very attractive but is extremely difficult to detect using current microscopic imaging techniques [3]. Therefore, deep-tissue (≫1 mm) high-resolution imaging is desirable for both tissue biology studies and preclinical/clinical applications [1–3], [4].
Optical and ultrasonic techniques are commonly used for noninvasive tissue imaging [5–7]. They share many features, such as cost efficiency, safety, and flexibility in the selection of the well developed and inexpensive imaging contrast agents [8]. They are also complementary. For example, imaging deep tissue (30–50 mm) optical techniques have very low spatial resolution (3–5 mm) due to strong light scattering [8]; however, ultrasound is much less scattered by tissue and has relatively higher spatial resolution (below a few hundred micrometers) [5, 6, 9]. Microbubbles are commonly used as ultrasound contrast agents and usually restricted inside a tissue vascular system because of their micrometer size [5]. However, optical contrast agents can simultaneously image both vascular and extravascular molecular targets via spectroscopic techniques, because of their relatively small size (≪ 1 micron) [1–3, 6, 8–10]. Therefore, ultrasound and optical hybrid imaging techniques, such as photoacoustic imaging and ultrasound-medicated optical imaging, have been intensively developed during the past years [5, 6, 11, 12]. These hybrid techniques take advantage of both techniques and achieve unique features that are unable to be achieved by individual ones [6, 12].
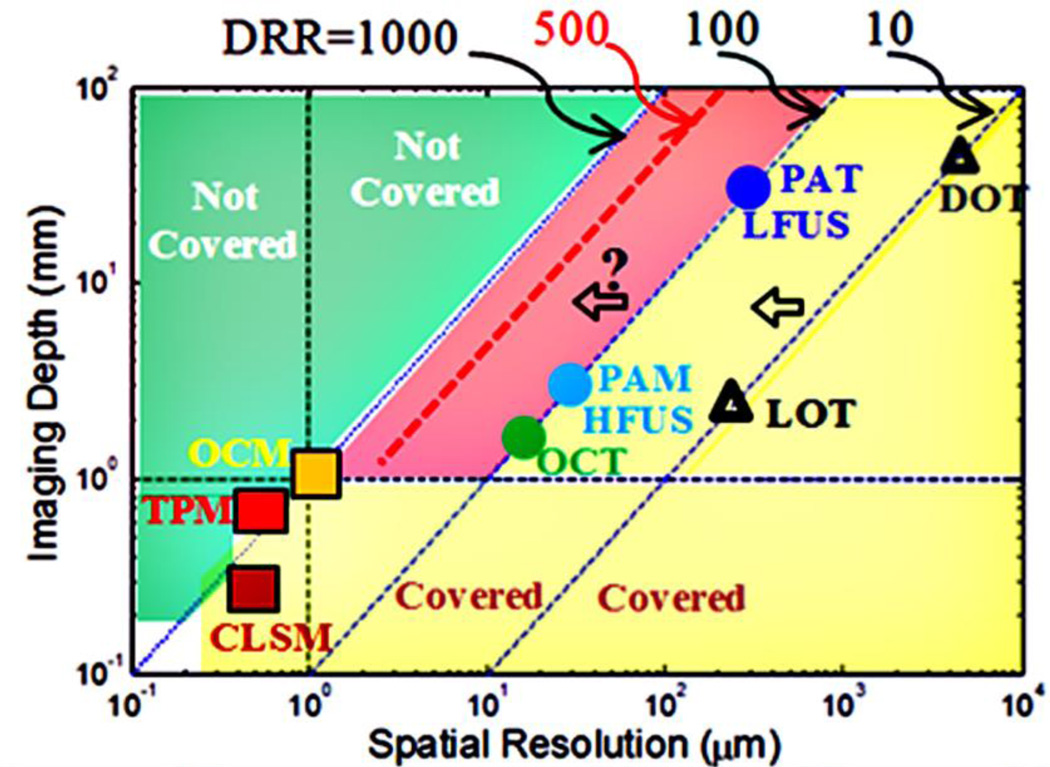
To quantitatively compare these techniques, depth-to-resolution ratio (DRR) is usually adopted and high DRR is preferred [6, 13]. Fig. 1 schematically summarized the major optical and ultrasonic related imaging techniques. Note that the values of DRR listed in Fig. 1 are for a general comparison among different techniques and the specific value for each technique may vary for different applications. Diffuse optical tomography (DOT) and laminar optical tomography (LOT) are two pure imaging techniques (meaning only optical techniques are used) and can image several millimeter to centimeter deep tissue with low resolution (submillimeter to millimeters) [7, 10, 14]. They are roughly located on the line of DRR=10. This DRR is fundamentally limited by tissue light scattering [8]. Low-frequency ultrasound (LFUS), high-frequency ultrasound (HFUS), photoacoutic tomography (PAT), photoacoustic microscopy (PAM) and optical coherence tomography (OCT) have improved the DRR up to ~100 [6, 13]. This DRR is fundamentally limited by acoustic diffraction (except OCT) [6, 13]. Optical microscopy, such as optical coherence microscopy (OCM), two photon microscopy (TPM), and confocal laser scanning microscope (CLSM), may theoretically locate around the line of DRR=1000, but with a limited imaging depth (<1 mm, see the horizontal dashed line) [4, 15, 16]. This DRR is fundamentally limited by the optical diffraction and scattering [4, 15]. To break the light diffraction limit, super-resolution optical microscopy has been intensively developed recently [17–20], such as stimulated emission depletion microscopy (STED), photoactivation localization microscopy (PALM), and stochastic optical reconstruction microscopy (STORM) [21, 22]. While these super-resolution techniques can provide much higher spatial resolution (tens of nm) than conventional optical microscopes, their imaging depths are usually limited (tens of microns) [21, 22]. Therefore, the DRR may remain ~1000 [23] (not shown in Fig. 1).
Fig. 1.
Major related optical and ultrasonic imaging techniques.
In Fig. 1, the horizontal axis represents the spatial resolution in micrometers (µm) and the vertical axis indicates the imaging depth in millimeter (mm). The four 45°-tilted dashed lines represent DRR=10, 100, 500, and 1000, respectively. Theoretically, the yellow area has been covered by the above-mentioned imaging techniques. The light green area has not been covered due to various fundamental physics limits. The third area, shown in red, has a DRR between 100 and 1,000. Currently, optical techniques based on the detection of scattered light (such as DOT and LOT) have difficulties in reaching this area due to strong tissue light scattering [7, 8, 10, 12, 14].. Ultrasound and photoacoutic techniques are difficult to reach beyond the area of DRR>200 (for imaging depth >1 mm) because of the fundamental physics limit of the acoustic diffraction [6, 13]. Accordingly, a fundamental question is whether it is feasible to develop a new imaging method that is located inside the red area with a DRR>200 (breaking the acoustic diffraction limit in ultrasound and PA techniques) and an imaging depth ≫1 mm (breaking the imaging depth limit in optical microscopy). To address this question, one may need to think outside the box to develop some techniques that are fundamentally different from currently existing imaging techniques. Recently, we proposed and developed a fundamentally different technique, ultrasound-switchable fluorescence (USF) imaging [17–19]. It has been demonstrated that the USF-based imaging technique has potential to break the acoustic diffraction limit and to reach a relatively higher spatial resolution compared with similar ultrasound and photoacoustic techniques [17, 18]. In this work, a general introduction to the USF imaging principle is given in Section II. In Section III, our recent progress in the development of the USF contrast agents, one of the USF imaging keys, is presented. The conclusions are given in Section IV.
II. Principle of USF Imaging
A. Basic USF Imaging Principles
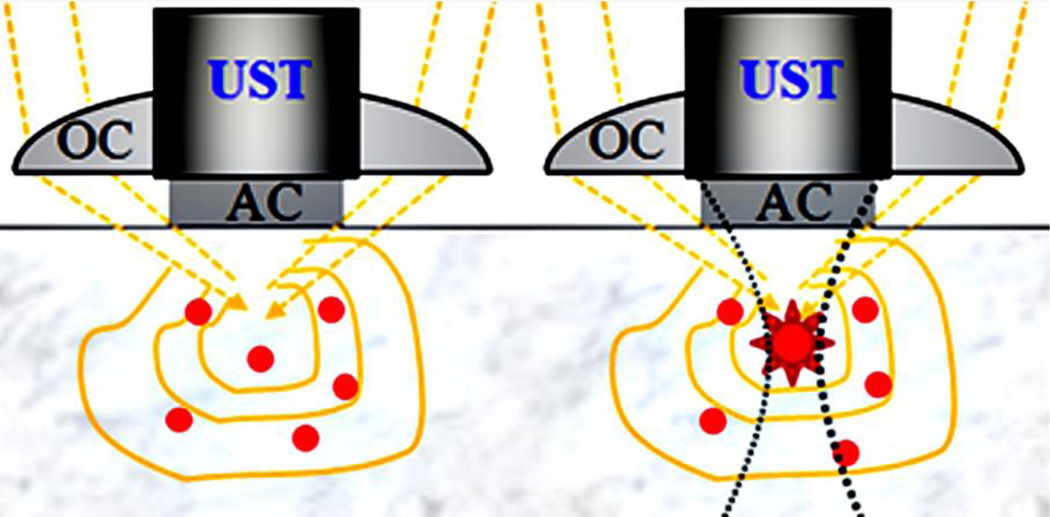
The basic mechanisms have been discussed in our recent publications in [17, 19, 20, 24]. Briefly, USF imaging requires two basic elements: (1) imaging contrast agents and (2) an acoustic-optical imaging system. The imaging principle is to use a focused ultrasound beam to externally and locally control fluorophore emission from a small volume (close to or even smaller than the ultrasound focal volume) [17, 19, 20, 24]. The imaging principle is schematically shown in Fig. 2. Ideally, without applying ultrasonic energy, the contrast agents should be dark (off, no fluorescence emission). Any detected fluorescence signal should be considered as noise and may be generated from tissue autofluorescence and/or imperfect USF contrast agents, which should be extremely weak in USF imaging. When the ultrasonic energy is turned on and focused inside the sample, USF contrast agents in a small volume (usually within the ultrasound focal volume) are switched on and fluoresce. By scanning the ultrasound focus, the distribution of the USF contrast agents can be imaged [17, 19]. Currently, two types of USF contrast agents have been developed: (1) fluorophore-quencher-labeled microbubbles (F–Q microbubbles) [19, 25–27] and (2) fluorophore-labeled thermosensitive polymers (FTP) or fluorophore-encapsulated nanoparticles (FEN) [17, 20].
Fig. 2.
Schematic diagrams show the basic principles of USF imaging. The left panel shows the case when ultrasound transducer (UST) is off and the fluorophores are off. The right panel represents that the UST is on and some fluorophores in the focal volume are switched on. OC, optical condenser; AC: acoustic coupling.
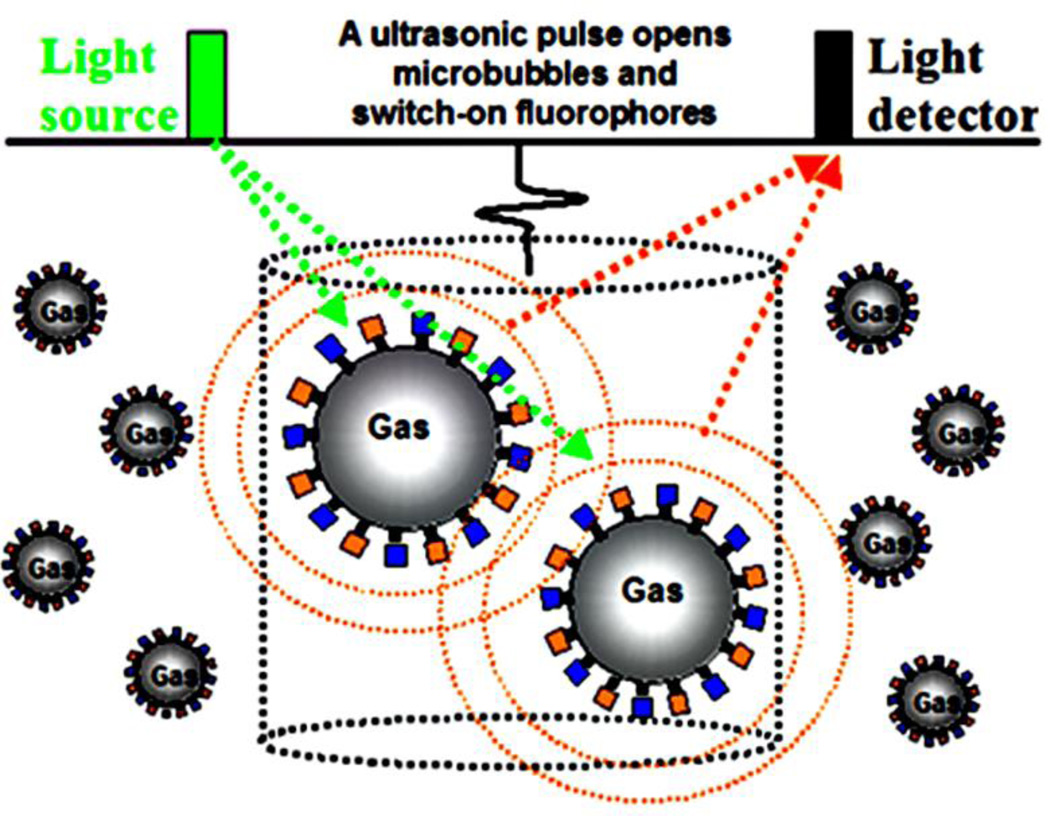
In the first type, fluorophores and quenchers are attached on the microbubble surface via various types of labeling techniques. Initially, the fluorophores are significantly quenched by quenchers (or via self-quenching) so that no or very weak fluorescence can be detected. To switch on the fluorescence signal, a short and focused ultrasound (mechanical) pressure pulse is used to significantly expand microbubbles. Therefore, the average molecular distance between the fluorophores and quenchers on the microbubble surface can be significantly increased during the expansion cycles (or the surface concentration of the fluorophores on the bubble surface can be significantly reduced if only one type of fluorophores is labeled). Thus, the quenching efficiency is dramatically reduced, which can switch on the fluorescence from the fluorophores [19, 25–27]. Fig. 3 displays a schematic diagram to show this concept. The large F–Q microbubbles represent that a negative ultrasound pressure cycle significantly increases the bubble size and reduces the quenching efficiency so that the fluorophores can emit fluorescence signal. The small F-Q microbubbles are located outside of the ultrasound focal volume so the fluorophores remain quenched (off) [19, 24].
Fig. 3.
Schematic diagram shows the concept of USF based on fluorophore-quencher-labeled microbubbles; F, fluorophores; and Q, quenchers. An ultrasound pressure pulse switches “on” the fluorophores. The dotted cylinder represents ultrasound focal zone in which the ultrasound interacts with F–Q microbubbles. The green dotted arrows indicate the excitation light. The dotted orange circles and arrows represent the fluorescence emission from the expanded (switched-on) microbubbles.
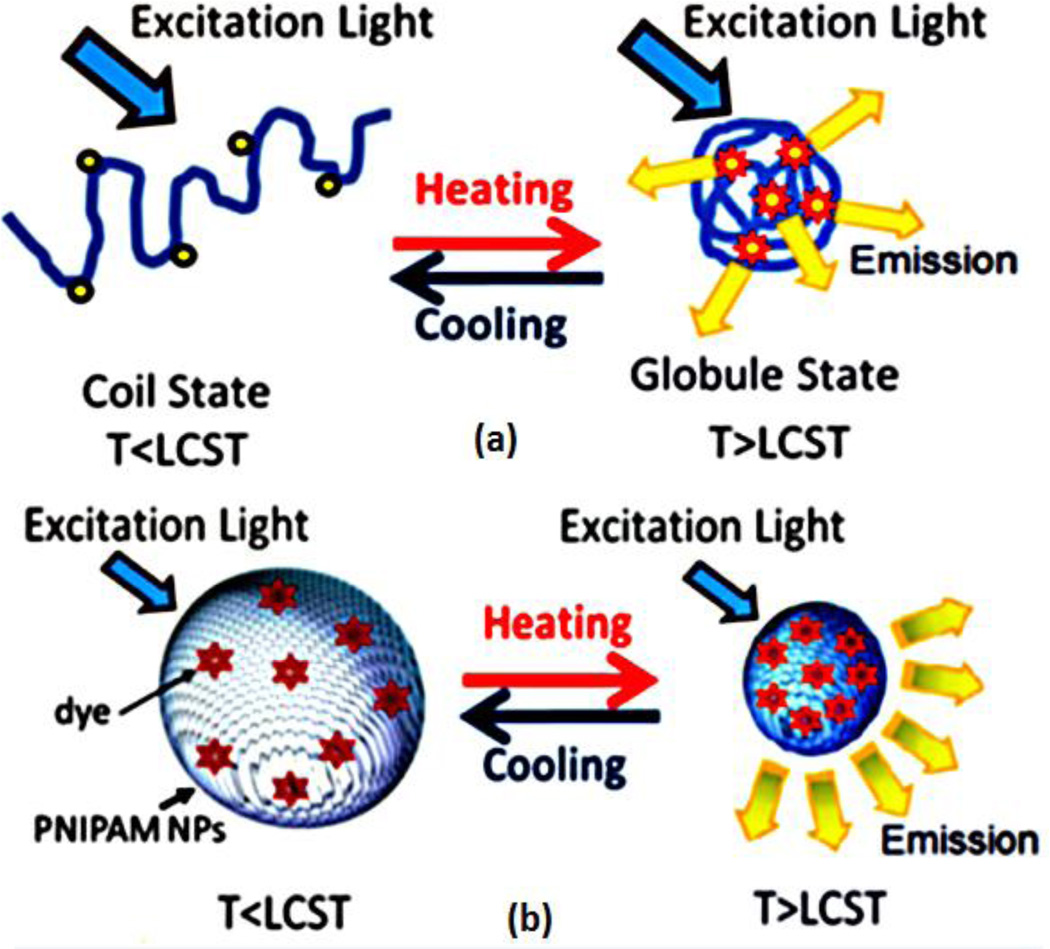
In the second type, polarity-sensitive fluorophores (high-quantum yields in low polarity environment) are either conjugated on the chain of thermosensitive polymers [Fig. 4(a)] [17] or encapsulated into nanoparticles that are made of thermosensitive polymers [Fig. 4(b)] [20]. To control the fluorescence signal, a relatively long and focused ultrasound pulse (ranging from a few to hundreds of milliseconds) with high intensity is adopted to heat the sample up to a few degrees Celsius in the focal volume [17]. When the temperature (T) of the USF contrast agents is heated up above the lower critical solution temperature (LCST) of the thermosensitive polymers or nanoparticles, these polymers or nanoparticles experience a reversible phase transition. This phase transition (between the two states of T<LCST and T>LCST) leads to a significant change in the polarity microenvironment of the polymer or nanoparticle. Thus, the polarity-sensitive fluorophores are “off” when T<LCST and “on” when T>LCST, which shows a switch-like fluorescence emission property [17, 20, 28]. Specifically, when T<LCST, the polymer chain is elongated, which is called a coil state. When T>LCST, the polymer chain shrivels into an insoluble glob, which is called a globule state. Because the polarity of the microenvironment is significantly changed between the two states, the polarity-sensitive fluorophores show a switch-like fluorescence emission property [28]. A similar mechanism applies to the nanoparticles. When T<LCST, nanoparticles are inflated with polarized solvent molecules that quench the fluorophores. When T>LCST, the nanoparticles are dramatically shrunk and the polarized solvent molecules (usually with much lower molecular weight than the fluorophores) are squeezed out [29, 30]. Thus, the fluorophores fluoresce significantly. This concept is schematically displayed in Fig. 4 [20]. A high-intensity focused ultrasound (HIFU) transducer can be used to externally and rapidly increase the temperature of the tissue above the threshold temperature to switch on the fluorophores (due to tissue absorption of acoustic energy) [17, 18] . After ultrasound exposure, the thermal energy is diffused quickly and the temperature recovers to background temperature. Thus, fluorophores are switched off. The fluorophores outside the focal zone always remain off due to T<LCST [17] .
Fig. 4.
Schematic diagrams showing the USF principle based on (a) a polymer chain structure, and (b) a NP structure. Adopted from [20].
B. Mechanisms of Breaking Acoustic Diffraction Limit
When adopting fluorophore-labeled thermosensitive polymers or nanoparticles, the spatial resolution can be further improved based on two unique mechanisms, as has been demonstrated recently [17, 18]. (1) When a nonlinear acoustic effect occurs, both lateral and axial acoustic and thermal focal sizes are dramatically reduced below the diffraction-limited size. This means the spatial resolution of the USF technique can be higher than the ultrasound and PA techniques when using the same ultrasound frequency [18]. (2) Unlike ultrasound and PA techniques, the spatial resolution of the USF technique depends on the size of the region where the fluorophores can be switched on [17]. Because of the existence of a threshold of ultrasound-induced temperature to switch on fluorophores, USF fluorophores can be switched on only in a volume where ultrasound energy is above the threshold. Thus, the size of the region where fluorophores can be switched on is usually smaller than the actual focal size of the ultrasound [17]. With appropriate selection of the threshold and ultrasound power, the spatial resolution of USF technique can be further improved in comparison with the spatial resolution determined by the nonlinear-effect-produced focal size.
III. Thermosensitive Polymer- or Nanoparticle-based USF Contrast Agents
A. What is an Ideal USF Contrast Agent?
To compare different USF contrast agents quantitatively, five parameters have been defined in our previous work [20]]: (1) peak excitation and emission wavelengths (λex and λem); (2) the fluorescence intensity ratio between on and off states (IOn/IOff); (3) the fluorescence lifetime ratio between on and off states (τOn/τOff); (4) the temperature threshold to switch on fluorophore (Tth); and (5) the temperature transition bandwidth (TBW). To achieve the best signal-to-noise ratio (SNR), an ideal USF contrast agent should have the following properties: (a) both λex and λem are located at red or near infrared (NIR) regions to avoid significant tissue absorption (therefore large penetration depth) and autofluorescence (therefore small background fluorescence noise); (b) an IOn/IOff, as large as possible, and τOn/τOff to reduce background fluorescence generated from fluorophores at the off state and increase the on-to-off ratio (or SNR); (c) for different future applications, Tth should be adjustable roughly in a range of 25°C to 42°C for both phantom (at room temperature) and in vivo studies (>physiological body temperature, ~37°C); (d) TBW should be as narrow as possible (typically a few °C) to avoid tissue thermal damage, and, (e) if possible, the fluorescence intensity at on state itself (IOn) and the fluorescence lifetime at on state itself (τOn) should be as large as possible to increase signal strength and fluorescence emission decay time, which can help to improve SNR. In practice, if simultaneously achieving all the best values of the above parameters is difficult, parameter optimization based on specific applications should be considered.
The promising results of the USF imaging technique heavily rely on excellent and unique USF contrast agents. Therefore, synthesis of new USF contrast agents is critical for the further development of this new imaging technique. In the following sections of this paper, newly synthesized fluorophore-labeled thermosensitive polymers and nanoparticles for USF imaging are presented.
B. Materials
N-isopropylacrylamide (NIPAM), N-tert-butylacrylamide (TBAm), acrylamide (AAm), acrylic acid (AAc), allylamine (AH), N,N,N’,N’-tetramethyl ethylene diamine (TEMED), ammonium persulfate (APS), N-(3-Dimethylaminopropyl)-N’-ethylcarbodiimide hydrochloride (EDC), sodium dodecyl sulfate (SDS), N,N’-methylenebisacrylamide (BIS), and 7-(2-Aminoethylamino)-N,N-dimethyl-4-benzofurazansulfonamide (DBD-ED) were purchased from Sigma-Aldrich Corporate (St. Louis, MO, USA). SeTau 425 mono-N-hydroxysuccinimide (NHS), Square 660 mono-NHS, Seta 700 mono-NHS, Seta 633 mono-NHS and Square 660 mono-NH2 were purchased from SETA BioMedicals (Urbana, IL, USA), and denoted as ST425, Sq660, St700, Sq633, and Sq660a respectively (note that Sq660 and Sq660a have the same absorbance and fluorescence spectra/lifetime). All chemicals were used directly without further purification.
C. Methods
In this study, poly(N-isopropylacrylamide) (PNIPAM) is selected as the thermoresponsive polymer. Compared with other thermoresponsive polymers, (i.e., Pluronic [31] and poly-N-vinylcaprolactam, [32]), this is because (1) it has better performance of structure change from a coil state to a globule state, (2) it has relative narrower temperature transition bandwidth (TBW), (3) the methods of adjust LCST of a PNIPAM polymer have been well developed [29, 30]; and the LCST can be adjusted from 20°C to 49°C [29, 30, 33], which is beneficial for both in vitro and in vivo studies, (4) it can be copolymerized with other materials, including amine-containing or carboxyl-containing monomers, which enables conjugation between thermosensitive polymers and environment-sensitive fluorophores with functional groups.
Four polarity-sensitive fluorophores (DBD-ED, St633, Sq660, and St700) are either attached to PNIPAM linear polymer or encapsulated in PNIPAM nanoparticles (NPs) for investigating their fluorescence intensity and lifetime as a function of temperature. In addition, six Förster resonance energy transfer (FRET) systems (including both polymer chain and NP structures) are designed, synthesized, and characterized in which DBD-ED or ST425 is used as the donor and the Sq660(a) as the acceptor. All these dyes with the desired function groups are commercially available and are found polarity sensitive in both fluorescence intensity and lifetime.
1) USF Contrast Agents Based on Linear Thermosensitive Polymers as Fluorophore Carriers
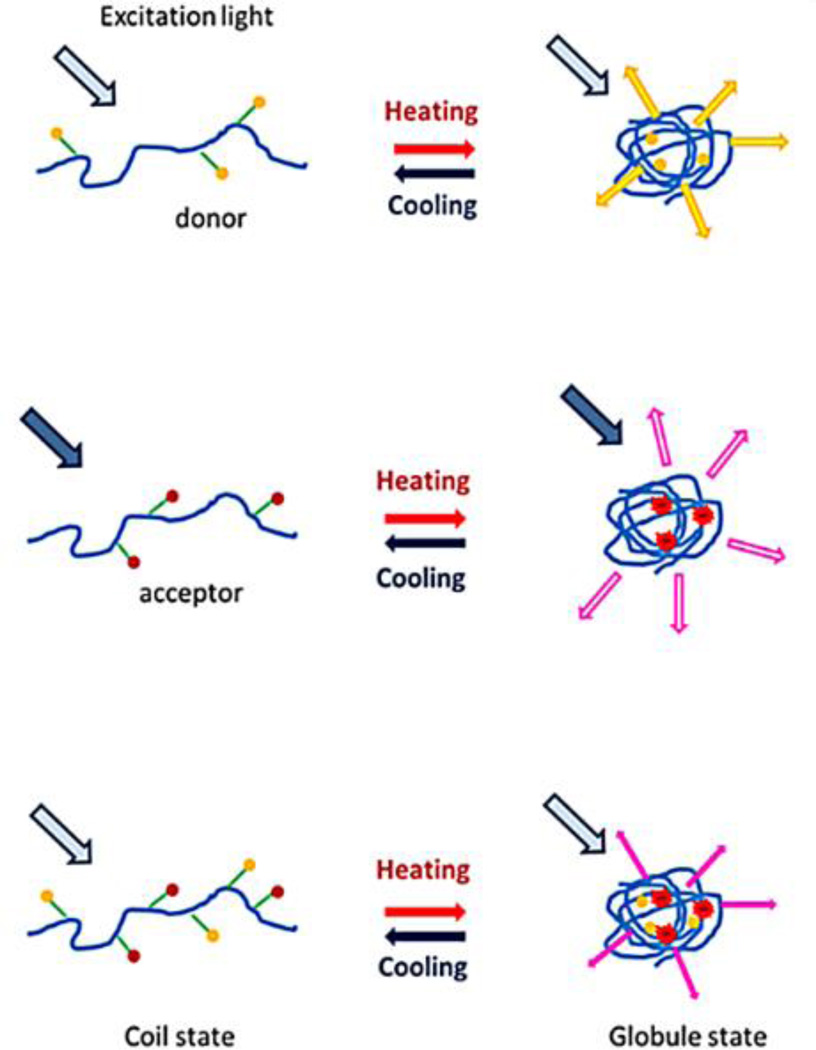
Fig. 5 shows the structures of the three types of fluorophore-labeled linear polymer structures, which include donor only, acceptor only, and FRET systems. In general, the thermosensitive linear polymer is first synthesized, and then fluorophores are grafted into the polymer by covalent binding (conjugation). The donor has short excitation/emission wavelengths in visible light, while the acceptor has a red/NIR emission (long wavelength). A short wavelength excitation light (for donor) is used to excite the system, so that there is a small amount of acceptor fluoresced. When the polymer (fluorophores carrier) shrivels into the globule state, donors and acceptors get closer to each other, leading to FRET from the donor to the acceptor. Therefore, the emission of the acceptor (in long wavelength) can be observed.
Fig. 5.
Schematic diagrams of the fluorophore-labeled linear polymer systems. From top to bottom: donor only, acceptor only, and FRET system.
a) Synthesis of Thermosensitive Linear Polymers
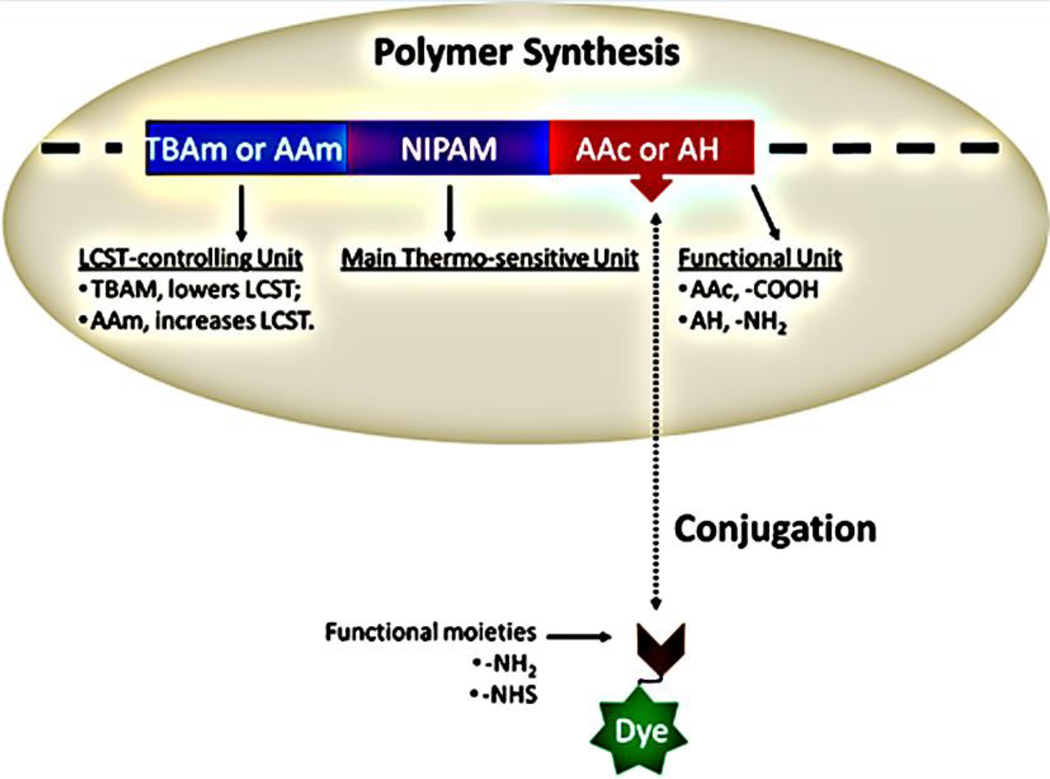
As shown in Fig. 6, three components of the polymer are necessarily included: (a) main thermosensitive unit, i.e., NIPAM; (b) LCST-controlling unit i.e., TBAm or AAm; (c) functional unit, i.e., AAc or AH. AAm monomer has amine group, the activity of which, however, is quite inert in the amide form. We will discuss the functions of these three components in the following sections.
Fig. 6.
Schematic diagram of the composition of polymers in the current study. NIPAM, TBAm, AAm, AAc, H. Dyes are attached to the polymer via post-labeling conjugation.
Linear polymers were synthesized through free radical polymerization. All reactions were carried out in a 250 mL Schlenk tube. The three main steps are: (1) Purging procedure: The solution was first purged with nitrogen for 10 min. When adding initiator (APS)/accelerator (TEMED) into the solution, oxygen was purged out by vacuuming (1 min) and filling with nitrogen (5 s), which was repeated three times; (2) reaction conditions: 4 h with stirring at room temperature; (3) purification procedure: the sample was dialyzed with appropriate molecular weight cut-off (MWCO) membrane for three days to remove the unreacted monomers, initiator, and other small molecules. These three steps are also used in the synthesis of polymer NPs in the following sections.
Using P(NIPAM-AAc 200:1) as one example, a general procedure is described here. Samples of 1.3644 g NIPAM (monomer) and 4 µL AAc (monomer) at a molar ratio of 200:1 were dissolved with 50 mL deionized (DI) water in the tube. Along with the purging procedure, 0.067 g APS (initiator) and 51 µL TEMED (accelerator) were added into the tube. After the reaction, the sample was dialyzed with a 3.5K MWCO membrane. The resulting solution was collected and freeze-dried, which then was ready for further conjugation with amine-fluorophores. For the conjugation with NHS-fluorophores, the amine-functionalized polymer of P(NIPAM-AH) was synthesized by following the same protocol except using AH instead of AAc.
Our hypothesis is that all of the polarity-sensitive fluorophores grafted into the polymer should be embedded when the polymer shrinks (forming a hydrophobic core, low-polarity environment), by which their fluorescence intensity and lifetime would be increased to the maximum. If any fluorophores are outside of the globule, i.e., in a high-polarity environment (exposed to the solvent), no significant increase in fluorescence intensity or lifetime would be observed. An extra amount of dye is not necessary along the polymer chain, and, as a result, the ratio of dye/polymer needs to be optimized. As shown in Fig. 6, the percentage of the functional unit in the polymer composition determined the ratio of dye/polymer in the conjugates. To investigate the effect of the amount of AAc, for instance, another two polymers with different ratios of NIPAM to AAc were synthesized by following the same protocol: P(NIPAM-AAc 100:1)and P(NIPAM-AAc 600:1). Since the ratio of the monomer(s) to the initiator remained the same in all the three batches of P(NIPAM-AAc) polymers, the length of the three polymers were likely in close range. Therefore, the lower molar ratio of NIPAM to AAc indicated the increased conjugating sites (carboxyl from AAc) available for amine-functionalized fluorophores. The fluorescence intensity and lifetime as a function of temperature were measured for all the polymers, and other USF parameters mentioned above were also measured.
To control the temperature threshold (LCST) of the polymers, the LCST-controlling unit AAm or TBAm was copolymerized with NIPAM. It was found that adding hydrophilic monomers (such as AAm) could increase the LCST [29, 30, 33] and adding hydrophobic monomers (such as TBAm) could decrease the LCST. More important, the introduction of TBAm might further improve the hydrophobicity inside the globule when the temperature >LCST, which could potentially increase the values of IOn/IOff and τOn/τOff. Therefore, the following polymers were synthesized: P(NIPAM-TBAm-AAc 85:15:1), P(NIPAM-TBAm-AAc 185:15:1), P(NIPAM-TBAm-AAc 585:15:1), and P(NIPAM-AAm-AAc 200:32:1). The TBAm remained at 15% mole in these copolymers because we found that TBAm could be well dissolved in DI water at this ratio.
b) Conjugation of Fluorophores on the Polymers
After the synthesis of polymers, the conjugation (post-labeling) between the polymer and fluorophores is based on the chemical reaction between carboxyl and primary amine (Fig. 6). The fluorophores used in this study can be divided into two groups based on the functional groups. The first type is fluorophore with NHS, which is an activated carboxyl group and can directly react with primary amine (NH2). The corresponding thermosensitive polymer is synthesized with amine-containing monomers (such as AH) to form P(NIPAM-AH). The second type is fluorophore with primary amine that can conjugate with carboxyl in the presence of the condenser EDC. The corresponding thermosensitive polymer is synthesized with carboxyl-containing monomers (such as AAc) to yield P(NIPAM-AAc).
The conjugating reaction was carried on in a 7 mL brown glass tube for protecting light-sensitive dyes. The general procedures for conjugation are:
(A) As for amine-containing dyes, i.e., DBD-ED or Sq660a, 5 mg polymer, 25 mg EDC (condenser), and 0.3 mg DBD-ED or/and 5 µL Sq660a (stock solution:1 mg/100 µL DMSO:dimethyl sulfoxide) were dissolved in 5 mL DI water in the tube. Then the tube was stirred and reacted overnight at room temperature. After reaction, the conjugates were purified with appropriate MWCO dialysis membrane as described earlier. (B) As for NHS-dyes, i.e., ST425, St633, Sq660, and St700, 5 mg polymer, and 10 µL dye (stock solution: 1 mg/100 µL DMSO) were dissolved in 5 mL PBS (8 mM sodium phosphate, 2 mM potassium phosphate, 0.14 M NaCl, 10 mM KCl, pH 8.3~8.6). Then, the solution was stirred and reacted for reacting overnight at room temperature. After that, 1 mL of 20 mM Tris buffer (pH 7.8) was added into the solution to quench the unreacted NHS moieties of the dye for two hours. Finally, the sample was dialyzed for purification. The similar procedures were also performed in the conjugation between polymer NPs and dyes in the following sections.
It is necessary to point out that the procedures of the conjugation between DBD-ED and polymers in the current study are different from those described previously [17, 34]. In [17, 34], DBD was first chemically reacted with a monomer of acrylic acid (AAc) to form DBD-AAc. Then the DBD-AAc was copolymerized with NIPAM. In the current study, the P(NIPAM-AAc) copolymer was first synthesized, then the amine-containing DBD-ED (commercially available) was conjugated on the carboxyl-containing copolymer (on AAc). The benefits of such post-labeling strategy in the current procedures include: (1) all chemical components are commercially available and no chemical synthesis at the level of small molecules is needed; (2) the unattached DBD-ED molecules (small molecular weight) can be easily separated from the conjugated polymers (large molecular weight) via a dialysis method with an appropriate MWCO membrane (commercially available). Nevertheless, the procedure in [17, 34] requires a complicated method to separate DBD (a small molecule) from DBD-AA (another small molecule). More interestingly, the polymers synthesized from current protocol show higher values of the ratios of IOn/IOff and τOn/τOff compared with the polymers synthesized from the protocol in [17, 34], but at the expense of the slight increase in the transition bandwidth TBW.
2) USF Contrast Agents Based on Thermosensitive NPs as Fluorophore Carriers
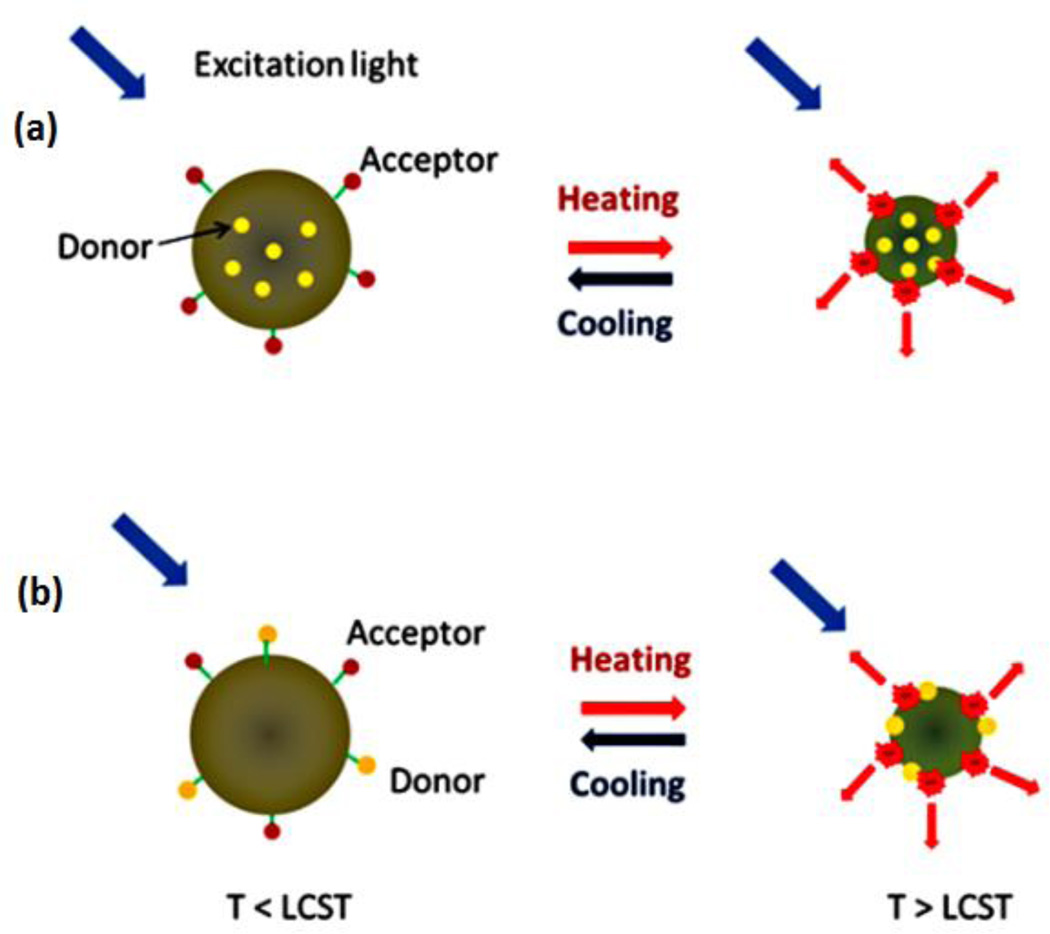
Instead of linear polymer, PNIPAM-based NPs were used as fluorophores carriers in this section. Fluorophores are either encapsulated inside the NPs [Fig. 7(a)] or attached on the surface of NPs [Fig. 7(b)]. As for encapsulation, the synthesis was referred to the protocol in our previous work in which no chemical modification was needed in the dye molecule [20]. The attachment on the NPs’ surface was also based on the conjugation between amine and carboxyl (like the conjugation for linear polymers).
Fig. 7.
Schematic diagrams of the FRET systems based on (a) fluorophore-encapsulated NPs and (b) fluorophore-attached NPs.
a) Encapsulation of Fluorophores into NPs
The protocol from our previous method was used [20]. To form polymer NPs, a cross-linker (BIS, 0.0131 g) and a surfactant (SDS, 0.0219 g) were added into the reaction solution. Other reagents are the same as that in the synthesis of linear polymer. No chemical modification at the dye molecule was needed. 1 mg DBD-ED or 10 µL dye-NHS (1 mg/100 µL DMSO) was added prior to polymerization.
Three types of dye-encapsulated NPs were synthesized: (1) dye@P(NIPAM-TBAm 185:15) NPs, (2) dye@PNIPAM NPs, and (3) dye@P(NIPAM-AAm 86:14) NPs. The symbol of @ means the dyes are inside the NPs. The measured LCSTs are 31, 35, and 42°C, respectively.
b) Conjugation of Fluorophores on the Surface of NPs
The conjugation procedure is the same as that for linear polymers. The only difference was the use of 5 mL polymer NPs solution or dye-encapsulated polymer NPs solution, rather than using 5mg linear polymer. Two formats are listed as follows:
Donors @NPs~acceptors format, as shown in Fig. 7(a). The donors are encapsulated inside the NPs, after which the acceptors are grafted onto the surface. For instance, DBD-ED@P(NIPAM-AH 86:14)NPs~Sq660. DBD-ED was encapsulated inside the P(NIPAM-AH 86:14) NPs, and Sq660 was introduced on the surface via NHS (from the dye) and amine (from AH) conjugation. We define this as Protocol I.
NPs~donors~acceptors format, as shown in Fig. 7(b). Both donors and acceptors are grafted onto the surface of the polymer NPs. For instance, P(NIPAM-AAc 200:1)NPs~DBD-ED~Sq660a. Two dyes were covalently binded to the surface via the conjugation between amine (from dyes) and carboxyl (from AAc). We define this as Protocol II.
3) Fluorescence Intensity and Lifetime Measurement
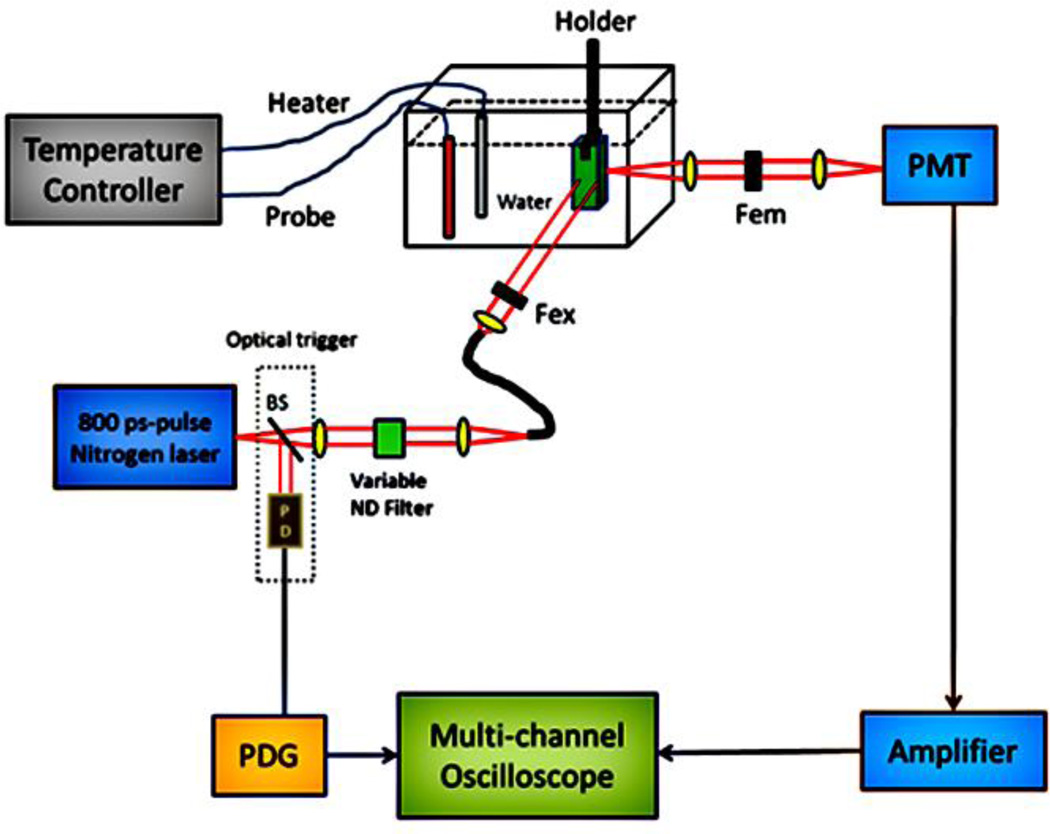
The fluorescence intensity and lifetime measurement system adopted in this study has been described in [20]. Briefly, Fig. 8 shows the major components including a subnanosecond pulse nitrogen laser (800 ps pulse width, nitrogen laser: OL-4300, dye laser: OL-401, Optical Building Blocks Corporation, Birmingham, NJ), a pulse delay generator (PDG, DG645, Stanford Research Systems, CA), a temperature controller (PTC10, Stanford Research System, Sunnyvale, CA), a photomultiplier tube (PMT, H10721-20, Hamamatsu, Japan), an amplifier (C5594, Hamamatsu, Japan) and a multichannel GHz oscilloscope (DPO 7254, Tektronix, OR). The dye laser is pumped by nitrogen laser illuminated excitation pulses with a pulse width of ~800 ps. The pulse energy was adjusted by a rotational neutral density filter and measured by a pulse energy meter system (Labmax-Top laser power/energy meter, Santa Clara, CA). The excitation wavelength was selected as 470 or 609 nm. The former was adopted as the excitation wavelength for the DBD-ED and the FRET systems. The latter was adopted as the excitation wavelength for the square dyes. For DBD-ED samples, a 561 nm long-pass filter was used as the emission filter to reject excitation photons. For red or NIR dye samples and the FRET systems, a bandpass filter with a central wavelength of 711 nm and a bandwidth of 25 nm was used as the emission filter, except for using 650/60 nm bandpass filter for the St633 dye.
Fig. 8.
Fluorescence intensity and lifetime measurement system.
To accurately synchronize the laser pulse, fluorescence signal, and data acquisition, the following strategies were adopted. The laser pulse was delayed ~100 ns by coupling the laser beam into a 20 m optical fiber (FT200EMT, Thorlabs Inc., Newton, NJ). When an excitation light pulse was fired by the laser, a small amount of laser energy was split by a beam splitter and was delivered to a fast photodiode (PD) to generate an electronic pulse. This pulse was used to trigger the PDG. The output of the PDG was used to trigger the oscilloscope for data acquisition. The triggering time was adjusted by controlling the output delay time of the PDG. Thus, the data acquisition of the oscilloscope was well synchronized and matched with the fluorescence signal. Our experimental data showed that the 100 ns delay from the laser pulse was large enough to account for the total electronic delay of the trigger signal.
The sample was placed in a quartz cuvette (Starna Cells, Atascadero, CA) that was submerged in a transparent water tank. The temperature of the water bath was controlled by the temperature controller with a heater and a temperature feedback probe. The fluorescence signal was averaged 100 times and the averaged data was fit to a single exponential decay function to calculate the fluorescence lifetime. The peak fluorescence intensity of the emission decay curve was adopted to calculate the intensity related parameters.
D. Results
As mentioned previously, five parameters are used to evaluate the performance of a USF contrast agent: λex and λem, IOn/IOff, τOn/τOff, Tth, and TBW. We summarize the performance of all the USF contrast agents developed in this work in Table I (linear polymers-based) and Table II (NPs-based). Conjugates of polymer/dyes are classified into three groups: donor only, acceptor only, and FRET system (donor and acceptor). The ideal contrast agent for deep tissue imaging would be of large λex and λem, IOn/IOff, and τOn/τOff and τOn, but narrow TBW, along with appropriate Tth.
Table I.
Overview of USF contrast agents based on linear polymers
| λex & λem (mm) |
IOn/IOff | τOn/τOff & τOn (ns) |
Tth (° C) |
TBW (° C) |
Reference | Label No. | ||
|---|---|---|---|---|---|---|---|---|
|
DBD (donor) |
PNIPAM (chain), co- polymerization |
470 & 580 | 4.2 | ~3.5 & ~14 |
31 | ~1 | [17] | 1.1 |
| P(NIPAM-AAc 100:1), post-labeling |
470 & 560lp | ~1.4 | ~4.7 & ~4.8 |
35 | ~8 | This work | 1.2 | |
| P(NIPAM-AAc 200:1), post-labeling |
470 & 560lp | ~1.6 | ~3.1 & ~5.2 |
36 | ~5 | This work | 1.3 | |
| P(NIPAM-AAc 600:1), post-labeling |
470 & 560lp | ~1.6 | ~1.9 & ~2.5 |
32 | ~5 | This work | 1.4 | |
| P(NIPAM-TBAm-AAc 185:15:1), post-labeling |
470 & 560lp | ~1.8 | ~5.4 & ~10 |
26 | ~4 | This work | 1.5 | |
| P(NIPAM-AAm-AAc 200:32:1), post-labeling |
470 & 560lp | ~1.1 | ~2 & ~2.2 |
42 | ~9 | This work | 1.6 | |
|
Red dyes (acceptor) |
P(NIPAM-AH 200:1), post-labeling, St633 |
609&650/60 | ~4.2 | ~1.1 & ~0.9 |
32 | ~5 | This work | 2.1 |
| P(NIPAM-AH 200:1), post-labeling, Sq660 |
609&711/25 | ~1.6 | ~2.2 & ~2.1 |
35 | ~3 | This work | 2.2 | |
| P(NIPAM-AH 200:1), post-labeling, St700 |
609&711/25 | ~0.6 | ~0.7 & ~1.1 |
33 | ~8 | This work | / | |
| FRET | P(NIPAM-AAc 200:1), ~DBD-ED, ~Sq660a, post-labeling, Sq660 |
470&711/25 | ~3.8 | & ~3.4 ~5.3 |
34 | ~3 | This work | 3.1 |
| P(NIPAM-TBAm-AAc 185:15:1), ~DBD-ED, ~Sq660a, post-labeling, |
470&711/25 | ~3 | ~1.7 & ~5.3 |
26 | ~3 | This work | 3.2 |
Table II.
Overview of USF contrast agents based on polymer NPs
| λex & λem (nm) |
IOn/IOff | τOn/τOff & τOn (ns) |
Tth (° C) |
TBW (° C) |
Reference | Label No. |
||
|---|---|---|---|---|---|---|---|---|
|
DBD (donor) |
@PNIPAM NPs, encapsulated |
470 & 560lp |
~4 | ~3.3 & ~6 |
35 | ~5 | This work | 4.1 |
| @P(NIPAM-AAm 86:14) NPs, encapsulated |
470 & 560lp |
~3.5 | ~2.2 & ~3.8 |
42 | ~9 | This work | 4.2 | |
| @P(NIPAM-TBAm 185:15) NPs, encapsulated |
470 & 560lp |
~3.7 | ~3.6 & ~7.2 |
31 | ~5 | This work | 4.3 | |
| @P(NIPAM-AH 86:14) NPs, encapsulated |
470 & 560lp |
~3 | ~2.6 & ~5.3 |
33 | ~8 | This work | 4.4 | |
|
Red dyes (acceptor) |
@PNIPAM NPs, encapsulated, St700 |
630 & 711/25 |
~0.7 | ~0.7 & ~1.2 |
36 | ~9 | This work | 5.1 |
| @PNIPAM NPs, encapsulated, Sq660 |
609 & 711/25 |
~3.3 | ~1.3 & ~2.9 |
35 | ~5 | This work | 5.2 | |
| FRET | DBD-ED@ P(NIPAM- AH 86:14) NPs-Sq660 |
470 & 711/25 |
~6.9 | ~1.4 & ~3.42 |
35 | ~7 | This work | 6.1 |
| P(NIPAM-AAc 200:1) NPs~DBD-ED~Sq660a |
470 & 711/25 |
~5.3 | ~3.3 & ~6 |
35 | ~5 | This work | 6.2 | |
| P(NIPAM-TBAm-AAc 185:15:1) NPs~DBD- ED~Sq660a |
470 & 711/25 |
~6.5 | ~2.7 & ~5.2 |
33 | ~9 | This work | 6.3 | |
| P(NIPAM-AAc 200:1) NPs~ST425~Sq660a |
456 & 711/25 |
~7 | ~1.7 & ~5.3 |
36 | ~4 | This work | 6.4 | |
1) USF Contrast Agents Based on Linear Thermosensitive Polymer as Fluorophore Carriers
a) DBD-ED (donor)-labeled linear thermosensitive polymer
Although the λex and λem are located at a visible wavelength range, the DBD dye has shown long fluorescence lifetime (τOn) when the temperature is above the temperature threshold (Tth), i.e., 14 ns, whereas it has a short τOff (~4 ns) when the temperature is below Tth [17, 34]. Thus, the large value of τOn/τOff makes this dye attractive in USF imaging because the background fluorescence noise can be potentially suppressed by using a time-gating detection method [17]. Accordingly, this unique property motivates us to investigate this type of dye as USF contrast agents.
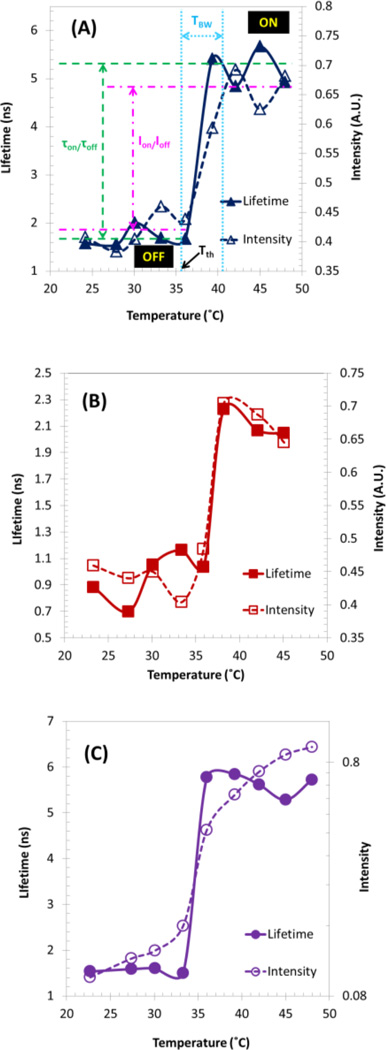
A unique property of USF contrast agents is the switching-like fluorescence response to temperature. Fig. 9 shows this switching property in which the fluorescence intensity and lifetime are plotted as a function of temperature systems. The three systems have the same polymer, P(NIPAM-AAc 200:1), but different dyes: (A) DBD-ED, (B) Sq660, and (C) DBD-ED, and Sq660a (note that Sq660 and Sq660a have the same absorbance and fluorescence spectra/lifetime). As an example, Fig. 9(a) demonstrates how the above-mentioned five parameters are defined based on the fluorescence lifetime change (blue solid curve with filled triangles) and fluorescence intensity change (blue dashed curve with blank triangles). In this case, DBD-ED was grafted onto the linear thermosensitive polymer P(NIPAM-AAc 200:1) via post-synthesis conjugation. The fluorescence lifetime of DBD-ED fluctuates between ~1.34 to ~2.0 ns (mean value 1.67 ns) when the temperature is below LCST of the polymer. It increases sharply at ~35°C, and then saturates at 5.2 ns (mean value) when temperature is above 40°C. Therefore, the lifetime ratio τOn/τOff can be calculated as ~3.1 (5.2/1.67) (marked by green dashed lines). Tth and TBW can be found as ~35 (pointed out by the black solid arrow) and ~5°C (40–35, light-blue round dot lines) respectively. Similarly, IOn/IOff can be calculated as ~1.6 (0.66/0.42) (see the pink dash dot lines). Similar parameters for the other two systems can be found in Table I (see the label 2.2 and 3.1). The signal induced by ambient temperature fluctuation was found negligible.
Fig. 9.
Fluorescence lifetime and intensity changes as a function of temperature of linear thermosensitive polymer-based USF contrast agent. (a) Polymer labeled with DBD-ED alone, (b) Sq660 alone, and (c) DBD-ED and Sq660a for FRET study. Excitation wavelength: (a, c) 470 nm; (b) 609 nm. Emission detection filter: (a) 561 nm long-pass filter; (b, c) 711/25 nm band-pass filter. For (a and c): P(NIPAM-AAc 200:1); for (b): P(NIPAM-AH 200:1).
It can be seen in Fig. 6 that AAc provides the binding site for DBD-ED. Thus, the AAc content in the co-polymer P(NIPAM-AAc) will potentially determine the amount of DBD-ED in the final conjugate product. Assuming NIPAM-to-AAc is at a perfect molar ratio and the conjugation efficiency is also adequately high, the resulted DBD-labeled conjugation would show comparable performance to that prepared through DBD-AAc copolymerization in our previous report [17]. Three sets of experiments including ratios of NIPAM/AAc at 100:1, 200:1, and 600:1 were investigated, and the results are shown in Table 1 (label No.1.2–1.4). P(NIPAM-AAc 100:1)~DBD-ED shows the highest values of τOn/τOff, which is ~4.7. The fluorescence lifetime ratio τOn/τOff is higher than that in the previous report (3.5); however, the IOn/IOff (1.4) and τOn (4.8 ns) are about three-fold smaller than those in the previous report [17] and TBW (~8 °C) is wider. By fixing the ratio of NIPAM/AAc at 200:1, τOn/τOff, IOn/IOff and τOn can be further improved to be 5.4, 1.8, and 10 ns by copolymerization with TBAm (with a molar ratio of TBAm-to-NIPAM at 15:185), a monomer that is of higher hydrophobicity than NIPAM (see No. 1.5 in Table 1). A great diversity of Tth was accomplished by adjusting the ratio of LCST-controlling unit (TBAm-to-NIPAM = 85:185; AAm-to-NIPAM = 32: 200), which had also been demonstrated in Table I (label No. 1.5 & 1.6).This will allow us to target a board range of applications (such as from phantom test to in vivo animal studies) in future work.
b) Red or NIR Dye (Acceptor) Labeled Linear Thermosensitive Polymer
Red or NIR dyes are more intriguing for deep tissue imaging applications because of the lesser tissue absorption and autofluorescence emission. Red or NIR polarity-sensitive dyes were attached to the linear thermosensitive polymer, and the conjugates’ fluorescence responses toward temperature increase were investigated (see the labels of No.2.1–2.3 in Table I for detailed results). St633 shows an excellent IOn/IOff (4.3), but the τOn/τOff was found barely increased. Sq660 has a good τOn/τOff (2.2), and the IOn/IOff is also acceptable (1.6), as shown in Fig. 9(b).
c) Linear-polymer-based FRET Systems
Ideally, to achieve high SNR, large values of both IOn/IOff and τOn/τOff are preferred. While fluorophore-labeled thermosensitive polymers show good switching effect via the significant change in the polarity microenvironment, Förster resonance energy transfer (FRET) can be considered as the second switching mechanism. If polarity sensitive dyes can be used as either donors or acceptors or both, the combination of the two switching mechanisms (polarity change and FRET efficiency change between T<LCST and T>LCST) may enhance the switching efficiency and the two ratios. The hypothesis is that, when T<LCST, the FRET between donors and acceptors is weak because both are at the “off” state and the average donor-acceptor distance is relatively large. When the T>LCST, the FRET becomes strong because both are at the “on” state and the average donor-acceptor distance is significantly reduced. Another benefit is that FRET makes the lifetime signal detected from the acceptors much longer than the signal when no FRET occurs because the lifetime of the FRET signal is determined by the longer lifetime between the donor and acceptor.
Fig. 9(c) shows the fluorescence lifetime and intensity changes of Sq660a in the FRET system as a function of temperature, which is obtained by using 470 nm as the excitation wavelength and a 711/25 nm bandpass filter for emission detection. The lifetime of Sq660a in the FRET system of P(NIPAM-AAc 200:1)~DBD-ED~Sq660a was found to increase when temperature reaches 34°C (purple solid line with filled circles). The saturated lifetime was found to be ~5.3 ns (T=36°C), whereas the maximum lifetime of Sq660a alone is only 2.1 ns (consistent with the result of testing pure Sq660a dye in low polarity solvent, e.g., 1,4-dioxane). This result strongly indicates that FRET does happen between DBD-ED and Sq660a when T>LCST. Also, the combination of the two switching mechanisms (polarity change and FRET efficiency change) leads to improvement at τOn/τOff (~3.4) and IOn/IOff (~3.8), compared with the results of Sq660 alone [1.6 and 2.2 in Fig. 9(b)].
2) USF Contrast Agents Based on Thermosensitive NPs as Fluorophore Carriers
a) DBD-ED (Donor)-Encapsulated Thermosensitive NPs
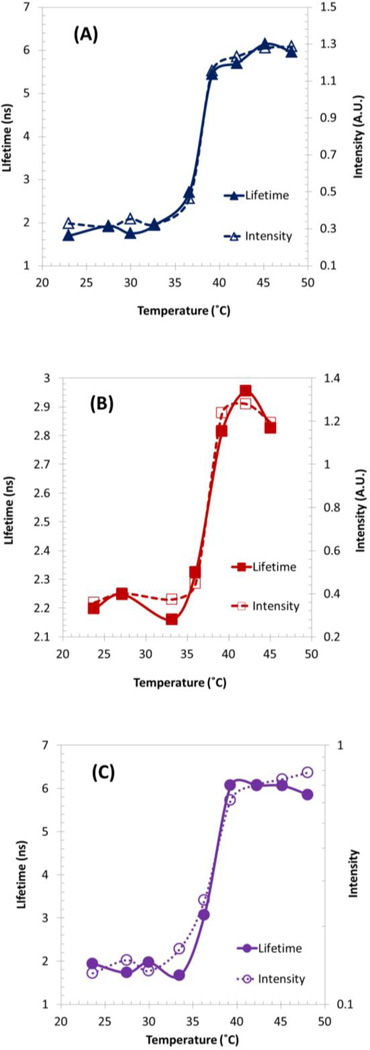
The dye was encapsulated into thermosensitive NPs by following the similar steps as described in our previous work [20]. No functional unit in polymer composition and no conjugation are needed. The size of the NPs is about ~120 nm ±40 nm [20]. Similarly, Fig. 10(a) shows the switching-like fluorescence response of DBD-ED@PNIPAM NPs. τOn/τOff is ~3.3 and τOn is ~6 ns. More importantly, IOn/IOff was estimated to be ~4, which is the highest IOn/IOff ratios among linear polymer-based contrast agents (Table I).
Fig. 10.
Fluorescence lifetime and intensity changes as a function of temperature of thermosensitive NPs-based USF contrast agent. (a) DBD-ED@PNIPAM NPs, (b) Sq660@PNIPAM NPs, and (c) P(NIPAM-AAc 200:1)~DBD-ED~Sq660a NPs for FRET studies. Excitation wavelength: (a, c) 470 nm, (b) 609 nm. Emission detection filter: (a) 561 nm long-pass filter, (b, c) 711/25 nm bandpass filter.
Interestingly, DBD-ED@P(NIPAM-AAm 86:14) NPs (No.-1.6 in Table I) shows an improved performance in comparison with P(NIPAM-AAm-AAc 200:32:1)~DBD-ED (No.-4.2 in Table II). The underlying mechanisms are still being investigated. The Tth is slightly above 37°C and can be further adjusted by controlling the NIPAM-to-AAm ratio.
b) Red or NIR Dye (Acceptor)-Encapsulated Thermosensitive NPs
Sq660 was encapsulated inside thermosensitive NPs, and the resulting product Sq660@PNIPAM NPs were tested [Fig. 10(b)]. The IOn/IOff ratio was estimated to be ~3.3, which is two-fold larger than that with linear polymer format (~1.6). Although τOn/τOff is limited at ~1.3, the lifetime versus temperature curve maintains excellent switching-like shape.
c) Nanoparticle-based FRET Systems
I. Protocol I, donors@NPs~acceptors
Measuring at 711/25nm, the τOn value of Sq660 in the FRET system DBD-ED@P(NIPAM-AH 200:1)~Sq660 was found to be ~3.4 ns (No.6.1 in Table I), which is larger than the longest lifetime of Sq660 when in hydrophobic conditions (~2.1 ns).This confirms the FRET occurrence between encapsulated DBD-ED and surface-grafted Sq660. The IOn/IOff ratio (~6.9) is one of the highest in the present work, which is two-fold higher than that of linear polymer format [Fig. 9(c)]. To improve τOn/τOff (1.4) and τOn, a new design for an NPs-based FRET system was carried out and denoted as Protocol II.
II. Protocol II, NPs~donors~acceptors
In this protocol, the donors and acceptors were conjugated simultaneously on the surface of NPs. The fluorescence lifetime and intensity changes of Sq660a in the FRET system, as function of temperature, were measured, as shown in Fig. 10(c). The τOn and τOn/τOff are ~6 ns and ~3.3, which are markedly improved compared with that in Protocol I (~3.4 ns and ~1.4). Taken together, one can deduce that this type of NPs-based FRET system’s performance is better than that used for linear polymer, see No.3.3 in Table I and No.6.2 in Table II.
E. Discussion
1) Linear Polymer-Based USF Contrast Agents
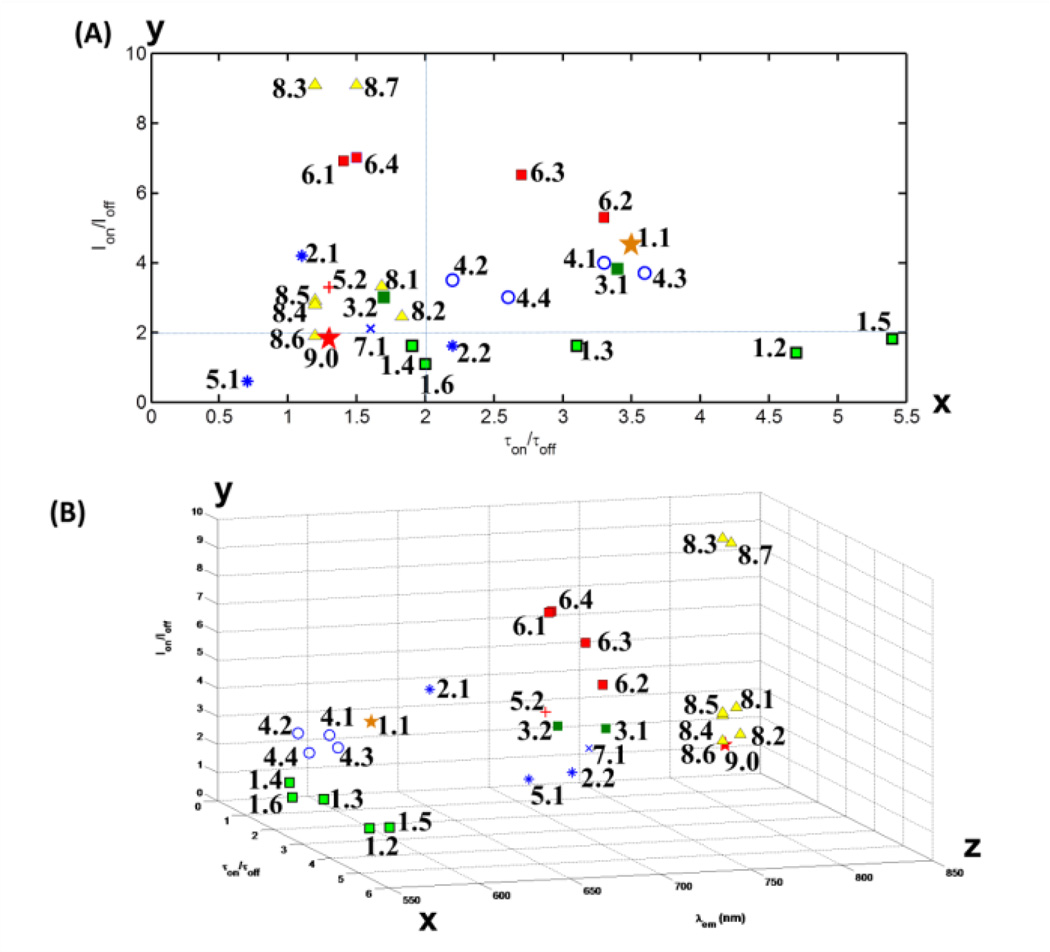
As mentioned above, the synthesis protocol of DBD-conjugated thermosensitive polymers in this study is different from the one used in [17, 34]. We named our current method post-synthesis conjugation, while the method in previous reports was named DBD-AAc copolymerization. The current method is of great advantage in the convenience of synthesis and purification. The difference in IOn/IOff and τOn/τOff between the two synthesis methods, the green squares (1.2–1.6) and the brown star (1.1) in Fig. 11, can be attributed to the low efficiency of post-synthesis conjugation. Some functional units (AAc) along the chain might be blocked by the random coils [35] formed by hydrophobic moieties in the polymer, i.e., isopropyl side group of NIPAM. These functional units seem the perfect sites for locating DBD-ED (because of high hydrophobicity environment), but unfortunately, are not completely available for the post-synthesis conjugation. Thus, the two ratios (IOn/IOff and τOn/τOff) are limited in a certain range. When TBAm was introduced into the polymer through copolymerization, the τOn/τOff (5.4) is higher than that in previous report (3.5). It has a relatively broader TBW (4°C), which is in an acceptable range for USF imaging.
Fig. 11.
(a) Overview of the performance, i.e., fluorescence lifetime ratios and intensity ratios, as well as (b) emission wavelength of all thermoresponsive fluorescence contrast agents in our studies and related literatures. The number labeled on each point can be referred to Table I and Table II (from 1.1 to 6.4). Labels from 7.1 to 9.0 are data points cited in our previous works [20], which includes: (7.1) DL700@P(NIPAM-AAc 200:1) NPs; (8.1 and 8.2) ICG@PNIPAM NPs; (8.3 and 8.4) ICG@P(NIPAM-AAm 86:14) NPs; (8.5 and 8.6) ICG@P(NIPAM-TBAm 185:15) NPs; (8.7) ICG@P(NIPAM-AAm 90:10) NPs; (9.0) ICG@Pluronic micelle. Data points (1.1) and (9.0) are adopted from [28] and [36].
Three red or NIR polarity-sensitive dyes, St633, Sq660, and St700, were investigated. One of the most important advantages is that tissue autofluorescence and absorption are significantly suppressed at red or NIR light. Among them, Sq660 shows acceptable IOn/IOff and τOn/τOff ratios (the blue star with No. 2.2 in Fig. 11). Although St700 is a polarity sensitive dye, the conjugate with a linear polymer shows a negatively-switching performance (IOn/IOff and τOn/τOff ratios drop as temperature increases, No.5.1 in Fig. 11). The mechanism is unclear.
The IOn/IOff ratio is generally below 2 when the polymer is labeled with donor/or acceptor alone, whereas the τOn/τOff ratio for acceptor alone (Sq660) is smaller than 2.5. These two ratios were improved in the FRET system, where τOn/τOff =3.4 and IOn/IOff=3.8. Also, the τOn reaches 5.3 ns, which is twofold larger than the maximum lifetime of Sq660 itself. The long fluorescence decay time can further be used to reduce the background noise from autofluorescence (generally < 4 ns). The trade-off is that the FRET system needs a short wavelength to excite the sample (470 nm). With the help of the time-gating method [17], however, such a FRET system would be potentially applicable in surface tissue bioimaging.
2) NPs-based USF Contrast Agents
It is apparent that NPs-based contrast agents listed in Table II have higher IOn/IOff ratios (>3) than those using linear polymers (Table I). Herein, the problem of low efficiency in conjugation does not exist, since fluorophores are directly encapsulated into the NPs. It is possible that the ratio of fluorophores/monomer is higher in NPs format than linear polymer format, leading to increase in IOn/IOff. On the other hand, τOn/τOff is slightly smaller in NPs format, likely due to the self-quenching between fluorophores inside NPs.
As fluorophores are attached on the surface of NPs for FRET study, the dropping of τOn/τOff by self-quenching is much less. For example, when both of DBD-ED and Sq660a were immobilized on the surface of NPs, the τOn/τOff is 3.3 (No.-6.2 in Fig. 11); however, when DBD-ED was encapsulated inside the NPs, but Sq660 was immobilized on the surface, the τOn/τOff is 1.4 (No.-6.1 in Fig. 11).Like linear polymer-based format (see No.-3.1 and No.-3.2 in Fig. 11), the introduction of hydrophobic TBAm monomer in the FRET system is not beneficial in improving the two ratios (see No.-6.2 and No.-6.3 in Fig. 11).
3) Overview of USF-Qualified Contrast Agents
We summarized all contrast agents in Fig. 11 based on Ion/Ioff and τon/τoff [and λem in Fig. 11(b)]. For comparison, our previously developed ICG-based USF contrast agents (No.8.1–8.7 in Fig. 11) and two other contrast agents from other groups (No.1.1 and 9.0 in Fig. 11) [34, 36] were included. If we divide Fig. 11(a) into four areas by crosslines (x=2, y=2; blue dashed lines), the samples in the top right area are good candidates for USF imaging because both two ratios are high. The samples in the top left area have high Ion/Ioff and low τon/τoff. Therefore, the time-gating method may be relatively less efficient due to the low τon/τoff value. Thus, the USF detection method will be mainly based on fluorescence intensity change of the USF contrast agents. The samples in the bottom right area have high τon/τoff and low Ion/Ioff.. Thus, the time-gating USF detection method used in [18] should be adopted for significantly attenuating background noise. The samples in the bottom left area have lower values for both ratios. Thus, they are relatively less efficient or not suitable (No.5.1 in the Fig. 11) for USF imaging. We tested the reversibility of our contrast agents at several heating/cooling cycles, i.g. room temperature and 41°C (data not shown). No significant loss in florescence intensity and lifetime was observed for 6 cycles.
IV. Conclusion
In this study, USF contrast agents were synthesized by using environment-sensitive fluorophores and thermosensitive polymers or NPs. These contrast agents in blue and red or NIR range show high lifetime on-to-off ratio (τon/τoff), high intensity on-to-off ratio (Ion/Ioff), narrow temperature transition bandwidth (TBW), and adjustable temperature threshold (Tth). Six FRET systems, where both donor (DBD-ED or ST425) and acceptor (Sq660) are environment-sensitive, were reported in the present work in which the τon/τoff and Ion/Ioff of Sq660 were significantly improved in comparison with that of Sq660 alone. The present work offers a series of potentially applicable contrast agents for future tissue imaging by using USF technique. Although in this work the polarity microenvironment change was used to explain the mechanism of switching on the fluorescence signal, it is also worth pointing out that other mechanisms may exist simultaneously. This may include the changes of hydrogen bonding possibility and/or viscosity microenvironment of the fluorophores caused by the polymer phase transition [28]. The details should be investigated in future for USF imaging.
Acknowledgments
This work was supported in part by funding from the NIH/NIBIB 7R15EB012312-02 (B. Yuan), the CPRIT RP120052 (B. Yuan), and the NSF CBET-1253199 (B. Yuan).
Biographies

Bingbing Cheng was born in Bozhou, Anhui, China, in September 15th, 1991. He received the Bachelor of Engineering degree in biomedical engineering from Beijing Jiaotong University, Beijing, China, in 2011.
He joined Ubiquitous Network and Digital Media Processing Laboratory, Beijing Jiaotong University in 2009, where he worked on speech recognition and natural language processing. In 2010, he joined Modern Signal Processing and Information Authentication Laboratory, Beijing Jiaotong University and concentrated on image processing, embedded system and biometric identification technology. His project “Passager Real-time Train Ticket Check-in System and its Realization based on Biometrics of Palm Vein” won the first price in National Undergraduate Electronic Design Contest. From 2010 to 2012, he worked as a Research Assistant in Professor Yao Zhao’s Computer Vision and Digital Media Laboratory, Institute of Information Science, Beijing, China. He was focused on 3D video encoding and sparse representation. He is currently a PhD student in Professor Baohong Yuan’s group in Ultrasound and Optical Imaging Laboratory, Department of Biomedical Engineering, University of Texas at Arlington, Arlington, TX, US. His research area includes the development of ultrasound-switchable fluorescence imaging contrast agents based on thermosensitive polymer or nanoparticles and environment-sensitive fluorophores.
Mr. Cheng is a member of Biomedical Engineering Society.

Ming-Yuan Wei received the B.Sci. degree in applied chemistry from Huangzhong Agricultural University, Wuhan, China, in 2003 and the Ph.D. degree in environment science from Chinese Academy of Science, Beijing, China, in 2009.
He worked as postdoctoral research associate in the Department of Computer Science and Electrical Engineering at West Virginia University, Morgantown, WV, USA, from 2009 to 2012. He was involved in the field of BioMEMs, and engaged in the research on fabricating nano-transportation device with motor proteins, leading by Professor Parviz Famouri. In June 2012, he joined Professor Baohong Yuan’s group in the Department of Bioengineering at the University of Texas at Arlington, Arlington, TX, USA. His current research interests are mainly focusing on the development of contrast agents for ultrasound-switchable fluorescence imaging with thermoresponsive polymer or nanoparticles and environment-sensitive fluorophores.
Dr. Wei is a member of Biomedical Engineering Society and American Nano Society.

Yuan Liu received the B.S. degree in biomedical engineering from Huazhong University of Science and Technology, Wuhan, China, in 2008 and the M.S. degree in biomedical engineering from The Catholic University of America, D.C., US, in 2010. She is currently pursuing the Ph.D. degree in bioengineering at University of Texas at Arlington, TX, USA.
From 2008 to 2010, she was a research assistant and was involved in the research of developing fluorescence laminar optical tomography techniques. Since 2010, she has been a research assistant in the ultrasound and optical imaging lab. Her research interests include developing ultrasound-mediated fluorescence imaging techniques, optical and ultrasound contrast agent, and imaging system for fast microbubble motion detection.
Ms. Liu is a member of Biomedical Engineering Society (BMES) and international society for optics and photonics (SPIE).

Harish Pitta was born in Warangal, A.P India in 1988. He received the B.tech.(Biotechnology), M.S., in biomedical engineering from the University of Texas at Arlington, USA, in 2010, and 2013, respectively.
Since 2011, he has been with the Drug Delivery Laboratory UTA, USA where he is engaged in the area of Polymer synthesis. He is currently a research assistant in same lab. His current research interests include synthesis of FRET systems with environment-sensitive dyes.

Zhiwei Xie received the B.S. degree in materials science and engineering from Beihang University, Beijing, China in 2002; the M.E. degree in materials engineering from Donghua University, Shanghai, China in 2006; and the Ph.D. degree in polymer and fiber engineering from Auburn University, Auburn, AL, USA in 2010.
He worked as a postdoctoral fellow in Professor Jian Yang’s group in bioengineering department at the University of Texas at Arlington, Arlington, TX, USA, from 2011 to 2012. He was involved in the field of biomaterials, developed biodegradable fluorescent polymers, and engaged in projects about new materials for cancer management and wound healing. In 2013, he joined Dr. Jian Yang at the Pennsylvania State University, continuing his postdoctoral training in the Transformative Biomaterials and Biotechnology Lab (TBBL). His current research interests are mainly focusing on the development of polymeric materials for in vivo fluorescent imaging, theranostic drug delivery, and tissue engineering.
Dr. Xie is a member of Biomedical Engineering Society, American Chemical Society, and American Heart Association.

Yi Hong achieved his PhD degree in materials science and engineering from Zhejiang University (Hangzhou, China) in 2005. And then he worked as a postdoc and later a Research Assistant Professor in the McGowan Institute for Regenerative Medicine in the University of Pittsburgh (Pittsburgh, Pennsylvania, USA) from 2006 to 2012. Currently, he is an Assistant Professor in the Department of Bioengineering in the University of Texas at Arlington (Arlington, Texas, USA). His research interests focus on designing novel biomaterials for varieties of applications in tissue repair and regeneration, drug delivery and bioimaging.

Kytai T. Nguyen received the B.S. degree in chemical engineering from the University of Minnesota, Minneapolis, in 1995, and the Ph.D. degree in chemical engineering (with specialization in bioengineering) from Rice University, Houston, TX, in 2000. She is currently an Associate Professor in the Department of Bioengineering, University of Texas at Arlington, Arlington, and The University of Texas Southwestern Medical Center, Dallas. Her research interests include biomaterials, drug and/or gene therapy delivery systems, cellular engineering, and tissue engineering.

Baohong Yuan earned his PhD degree of biomedical engineering from University of Connecticut (CT, USA) in 2006 and his BS degree of microelectronics from Harbin Institute of Technology (Harbin, China) in 1997. Currently, he is an assistant professor of biomedical engineering at the University of Texas at Arlington (TX, USA). His research interest is to explore and develop new imaging technology, including contrast agents and instruments, for understanding cancer mechanisms, early detecting and diagnosing cancers, and monitoring cancer treatment efficiency.
Contributor Information
Bingbing Cheng, Ultrasound and Optical Imaging Laboratory, Department of Bioengineering, The University of Texas at Arlington, Arlington, TX 76010, USA; Joint Biomedical Engineering Program, The University of Texas at Arlington and The University of Texas Southwestern Medical Center at Dallas, TX 75390, USA.
Ming-Yuan Wei, Ultrasound and Optical Imaging Laboratory, Department of Bioengineering, The University of Texas at Arlington, Arlington, TX 76010, USA; Joint Biomedical Engineering Program, The University of Texas at Arlington and The University of Texas Southwestern Medical Center at Dallas, TX 75390, USA.
Yuan Liu, Ultrasound and Optical Imaging Laboratory, Department of Bioengineering, The University of Texas at Arlington, Arlington, TX 76010, USA; Joint Biomedical Engineering Program, The University of Texas at Arlington and The University of Texas Southwestern Medical Center at Dallas, TX 75390, USA.
Harish Pitta, Joint Biomedical Engineering Program, The University of Texas at Arlington and The University of Texas Southwestern Medical Center at Dallas, TX 75390, USA; Department of Bioengineering, The University of Texas at Arlington, Arlington, TX 76010, USA.
Zhiwei Xie, Joint Biomedical Engineering Program, The University of Texas at Arlington and The University of Texas Southwestern Medical Center at Dallas, TX 75390, USA; Department of Bioengineering, The University of Texas at Arlington, Arlington, TX 76010, USA.
Yi Hong, Joint Biomedical Engineering Program, The University of Texas at Arlington and The University of Texas Southwestern Medical Center at Dallas, TX 75390, USA; Department of Bioengineering, The University of Texas at Arlington, Arlington, TX 76010, USA.
Kytai T. Nguyen, Joint Biomedical Engineering Program, The University of Texas at Arlington and The University of Texas Southwestern Medical Center at Dallas, TX 75390, USA Department of Bioengineering, The University of Texas at Arlington, Arlington, TX 76010, USA.
Baohong Yuan, Ultrasound and Optical Imaging Laboratory, Department of Bioengineering, The University of Texas at Arlington, Arlington, TX 76010, USA; Joint Biomedical Engineering Program, The University of Texas at Arlington and The University of Texas Southwestern Medical Center at Dallas, TX 75390, USA.
References
- 1.Cai W, Chen X. Multimodality molecular imaging of tumor angiogenesis. Journal of Nuclear Medicine. 2008 Jun;49(Suppl 2):113s–128s. doi: 10.2967/jnumed.107.045922. [DOI] [PubMed] [Google Scholar]
- 2.Andresen V, Alexander S, Heupel WM, Hirschberg M, Hoffman RM, Friedl P. Infrared multiphoton microscopy: subcellular-resolved deep tissue imaging. Current Opinion in Biotechnology. 2009 Feb;20:54–62. doi: 10.1016/j.copbio.2009.02.008. [DOI] [PubMed] [Google Scholar]
- 3.McDonald DM, Choyke PL. Imaging of angiogenesis: from microscope to clinic. Nature Medicine. 2003 Jun;9:713–725. doi: 10.1038/nm0603-713. [DOI] [PubMed] [Google Scholar]
- 4.Helmchen F, Denk W. Deep tissue two-photon microscopy. Nature Methods. 2005 Dec;2:932–940. doi: 10.1038/nmeth818. [DOI] [PubMed] [Google Scholar]
- 5.Ferrara K, Pollard R, Borden M. Ultrasound microbubble contrast agents: fundamentals and application to gene and drug delivery. Annu Rev Biomed Eng. 2007;9:415–447. doi: 10.1146/annurev.bioeng.8.061505.095852. [DOI] [PubMed] [Google Scholar]
- 6.Wang LV, Hu S. Photoacoustic tomography: in vivo imaging from organelles to organs. Science. 2012 Mar 23;335:1458–1462. doi: 10.1126/science.1216210. [DOI] [PMC free article] [PubMed] [Google Scholar]
- 7.Corlu A, Choe R, Durduran T, Rosen MA, Schweiger M, Arridge SR, Schnall MD, Yodh AG. Three-dimensional in vivo fluorescence diffuse optical tomography of breast cancer in humans. Optics Express. 2007 May 28;15:6696–6716. doi: 10.1364/oe.15.006696. [DOI] [PubMed] [Google Scholar]
- 8.Yuan B, Rychak J. Tumor Functional and Molecular Imaging Utilizing Ultrasound and Ultrasound-Mediated Optical Techniques. The American journal of pathology. 2013;182:305–311. doi: 10.1016/j.ajpath.2012.07.036. [DOI] [PMC free article] [PubMed] [Google Scholar]
- 9.Passmann C, Ermert H. a 100-MHz ultrasound imaging system for dermatologic and ophthalmologic diagnostics. Ultrasonics, Ferroelectrics and Frequency Control, IEEE Transactions on. 1996;43:545–552. [Google Scholar]
- 10.Culver J, Akers W, Achilefu S. Multimodality molecular imaging with combined optical and SPECT/PET modalities. Journal of Nuclear Medicine. 2008 Feb;49:169–172. doi: 10.2967/jnumed.107.043331. [DOI] [PubMed] [Google Scholar]
- 11.Gessner R, Dayton PA. Advances in molecular imaging with ultrasound. Molecular imaging. 2010 Jun;9:117–127. [PMC free article] [PubMed] [Google Scholar]
- 12.Zhu Q, Hegde PU, Ricci A, Jr., Kane M, Cronin EB, Ardeshirpour Y, Xu C, Aguirre A, Kurtzman SH, Deckers PJ, Tannenbaum SH. Early-stage invasive breast cancers: potential role of optical tomography with us localization in assisting diagnosis. Radiology. 2010 Aug;256:367–378. doi: 10.1148/radiol.10091237. [DOI] [PMC free article] [PubMed] [Google Scholar]
- 13.Wang LV. Multiscale photoacoustic microscopy and computed tomography. Nature Photonics. 2009 Sep;3:503–509. doi: 10.1038/nphoton.2009.157. [DOI] [PMC free article] [PubMed] [Google Scholar]
- 14.Yuan B, Burgess SA, Iranmahboob A, Bouchard MB, Lehrer N, Bordier C, Hillman EM. a system for high-resolution depth-resolved optical imaging of fluorescence and absorption contrast. Rev Sci Instrum. 2009 Apr;80:043706. doi: 10.1063/1.3117204. [DOI] [PMC free article] [PubMed] [Google Scholar]
- 15.Srinivasan VJ, Radhakrishnan H, Jiang JY, Barry S, Cable AE. Optical coherence microscopy for deep tissue imaging of the cerebral cortex with intrinsic contrast. Optics Express. 2012 Jan 30;20:2220–2239. doi: 10.1364/OE.20.002220. [DOI] [PMC free article] [PubMed] [Google Scholar]
- 16.Theer P, Hasan MT, Denk W. Two-photon imaging to a depth of 1000 mu m in living brains by use of a Ti : Al2O3 regenerative amplifier. Optics Letters. 2003 Jun 15;28:1022–1024. doi: 10.1364/ol.28.001022. [DOI] [PubMed] [Google Scholar]
- 17.Yuan BH, Uchiyama S, Liu Y, Nguyen KT, Alexandrakis G. High-resolution imaging in a deep turbid medium based on an ultrasound-switchable fluorescence technique. Applied Physics Letters. 2012 Jul 16;101:033703. doi: 10.1063/1.4737211. [DOI] [PMC free article] [PubMed] [Google Scholar]
- 18.Yuan BH, Pei YB, Kandukuri J. Breaking the acoustic diffraction limit via nonlinear effect and thermal confinement for potential deep-tissue high-resolution imaging. Applied Physics Letters. 2013 Feb 11;102 doi: 10.1063/1.4792736. [DOI] [PMC free article] [PubMed] [Google Scholar]
- 19.Yuan BH. Ultrasound-modulated fluorescence based on a fluorophore-quencher-labeled microbubble system. Journal of Biomedical Optics. 2009 Mar-Apr;14:024043-1–024043-11. doi: 10.1117/1.3120493. [DOI] [PubMed] [Google Scholar]
- 20.Wei MY, Pitta H, Liu Y, Xie Z, Menon JU, Cheng B, Alexandrakis G, Nguyen KT, Yuan B. Synthesis and characterization of NIR fluorophore-encapsulated thermo-sensitive nanoparticles as contrast agents for ultrasound-switchable fluorescence imaging. submitted to Journal of Biomedical Optics. 2013 [Google Scholar]
- 21.Chi KR. Super-resolution microscopy: breaking the limits. Nature Methods. 2009 Jan;6:15–18. [Google Scholar]
- 22.Hell SW. Toward fluorescence nanoscopy. Nature Biotechnology. 2003 Nov;21:1347–1355. doi: 10.1038/nbt895. [DOI] [PubMed] [Google Scholar]
- 23.Takasaki KT, Ding JB, Sabatini BL. Live-Cell Superresolution Imaging by Pulsed STED Two-Photon Excitation Microscopy. Biophysical Journal. 2013 Feb 19;104:770–777. doi: 10.1016/j.bpj.2012.12.053. [DOI] [PMC free article] [PubMed] [Google Scholar]
- 24.Yuan BH, Liu Y, Mehl PM, Vignola J. Microbubble-enhanced ultrasound-modulated fluorescence in a turbid medium. Applied Physics Letters. 2009 Nov 2;95:181113-1–181113-3. [Google Scholar]
- 25.Schutt CE, Benchimol MJ, Hsu MJ, Esener SC. Unconventional Imaging, Wavefront Sensing, and Adaptive Coded Aperture Imaging and Non-Imaging Sensor Systems. Vol. 8165. Bellingham, WA, USA: SPIE; 2011. Ultrasound-modulated fluorescent contrast agent for optical imaging through turbid media. [Google Scholar]
- 26.Benchimol MJ, Hsu MJ, Schutt CE, Hall DJ, Mattrey RF, Esener SC. Phospholipid/carbocyanine dye-shelled microbubbles as ultrasound-modulated fluorescent contrast agents. Soft Matter. 2013;9:2384–2388. doi: 10.1039/C2SM26900G. [DOI] [PMC free article] [PubMed] [Google Scholar]
- 27.Liu Yuan, Wei Ming-Yuan, Feshitan Jameel A, Borden Mark A, Baohong Yuan. Ultrasound modulated fluorescence based on fluorescent microbubbles. Photons Plus Ultrasound: Imaging and Sensing conference. 2014 doi: 10.1117/1.JBO.19.8.085005. submitted. [DOI] [PMC free article] [PubMed] [Google Scholar]
- 28.Gota C, Uchiyama S, Yoshihara T, Tobita S, Ohwada T. Temperature-Dependent Fluorescence Lifetime of a Fluorescent Polymeric Thermometer, Poly(N-isopropylacrylamide), Labeled by Polarity and Hydrogen Bonding Sensitive 4-Sulfamoyl-7-aminobenzofurazan. The Journal of Physical Chemistry B. 2008;112:2829–2836. doi: 10.1021/jp709810g. [DOI] [PubMed] [Google Scholar]
- 29.Ramanan RMK, Chellamuthu P, Tang LP, Nguyen KT. Development of a temperature-sensitive composite hydrogel for drug delivery applications. Biotechnology Progress. 2006 Jan-Feb;22:118–125. doi: 10.1021/bp0501367. [DOI] [PubMed] [Google Scholar]
- 30.Rahimi M, Kilaru S, Sleiman GEH, Saleh A, Rudkevich D, Nguyen K. Synthesis and Characterization of Thermo-Sensitive Nanoparticles for Drug Delivery Applications. Journal of Biomedical Nanotechnology. 2008 Dec;4:482–490. doi: 10.1166/jbn.2008.014. [DOI] [PMC free article] [PubMed] [Google Scholar]
- 31.Garripelli VK, Kim JK, Namgung R, Kim WJ, Repka MA, Jo S. A novel thermosensitive polymer with pH-dependent degradation for drug delivery. Acta Biomaterialia. 2010 Feb;6:477–485. doi: 10.1016/j.actbio.2009.07.005. [DOI] [PMC free article] [PubMed] [Google Scholar]
- 32.Kirsh YE, Yanul NA, Kalninsh KK. Structural transformations and water associate interactions in poly-N-vinylcaprolactam-water system. European Polymer Journal. 1999 Feb;35:305–316. [Google Scholar]
- 33.Uchiyama S, Matsumura Y, de Silva AP, Iwai K. Modulation of the Sensitive Temperature Range of Fluorescent Molecular Thermometers Based on Thermoresponsive Polymers. Analytical Chemistry. 2004;76:1793–1798. doi: 10.1021/ac035248w. 2004/03/01. [DOI] [PubMed] [Google Scholar]
- 34.Gota C, Uchiyama S, Yoshihara T, Tobita S, Ohwada T. Temperature-dependent fluorescence lifetime of a fluorescent polymeric thermometer, Poly(N-isopropylacrylamide), labeled by polarity and hydrogen bonding sensitive 4-sulfamoyl-7-aminobenzofurazan. Journal of Physical Chemistry B. 2008 Mar 13;112:2829–2836. doi: 10.1021/jp709810g. [DOI] [PubMed] [Google Scholar]
- 35.Okada Y, Tanaka F. Cooperative hydration, chain collapse, and flat LCST behavior in aqueous poly(N-isopropylacrylamide) solutions. Macromolecules. 2005 May 17;38:4465–4471. [Google Scholar]
- 36.Lin YT, Kwong TC, Bolisay L, Gulsen G. Temperature-modulated fluorescence tomography based on both concentration and lifetime contrast. Journal of Biomedical Optics. 2012 May;17:056007. doi: 10.1117/1.JBO.17.5.056007. [DOI] [PMC free article] [PubMed] [Google Scholar]


