

Abstract
Bestrophin calcium-activated chloride channels (CaCCs) regulate the flow of chloride and other monovalent anions across cellular membranes in response to intracellular calcium (Ca2+) levels. Mutations in bestrophin-1 (Best1) cause certain eye diseases. Here we present X-ray structures of chicken Best1-Fab complexes, at 2.85 Å resolution, with permeant anions and Ca2+. Representing the first structure of a CaCC, the eukaryotic Best1 channel, which recapitulates CaCC function in liposomes, is formed from a pentameric assembly of subunits. Ca2+ binds to the channel's large cytosolic region. A single ion pore, approximately 95 Å in length, is located along the central axis and contains at least fifteen binding sites for anions. A hydrophobic neck within the pore likely forms the gate. Phenylalanine residues within it may coordinate permeating anions via anion-π interactions. Conformational changes observed near the “Ca2+ clasp” hint at the mechanism of Ca2+-dependent gating. Disease-causing mutations are prevalent within the gating apparatus.
Ca2+-activated Cl- channels (CaCCs) are present in almost every cell type and are implicated in diverse functions including phototransduction, olfactory transduction, neuronal and cardiac excitability, smooth muscle contraction, and epithelial Cl- secretion 1. Bestrophin proteins constitute a family of CaCCs, distinct from the TMEM16 family 2-4, that open their anion-selective pores in response to a rise in the intracellular Ca2+ concentration 5-8. Bestrophins have broad tissue distribution and, while their physiological roles are somewhat enigmatic, evidence suggests that they function not only at the plasma membrane but also in intracellular organelles 7,9.
Humans have four bestrophin paralogs (Best1, Best2, Best3, and Best4) that form CaCCs in the plasma membrane when expressed 5-7,10-12. The highly conserved N-terminal region of the proteins (amino acids 1-390; >55% sequence identity) is sufficient for CaCC activity 13. The C-terminal region (amino acids 391-585 of Best1) has low sequence identity and is predicted to be unstructured. Approximately 200 mutations in Best1 have been associated with retinal degenerative disorders, most commonly with Best vitelliform macular dystrophy, but also with other retinopathies 7,14-20. Almost all of these occur within the N-terminal region. Although the steps leading to the disease state are not fully understood, most of the characterized mutations alter electrophysiological properties of the channel 5,13,16,21-24.
Bestrophin channels bear no discernable sequence homology with other ion channel families and no structural information is available for them. Properties including subunit topology and stoichiometry are unresolved. One recent study using the single-molecule photobleaching technique led the authors to conclude that bestrophins are tetramers 25, while other experiments suggest pentameric stoichiometry 5.
Partly because CaCC function has yet to be demonstrated using purified protein, there has been some debate about whether bestrophin is a channel or whether it is a modulator of other channels 7. However, the effects of mutations (e.g. 11,13) bolster the view that assembled bestrophin subunits contain Cl--conducting pore(s) and that pore gating is regulated by direct binding of Ca2+ to a cytosolic region of the channel (Kd ∼ 150 nM) that might involve a highly-conserved cluster of acidic residues5,6,12,26,27.
In addition to Cl-, Best1 conducts other monovalent anions including bromine (Br-), iodine (I-), thiocyanate (SCN-), bicarbonate (HCO3-), and nitrate (NO3-) 7,28,29. In contrast, the channel is essentially impermeable to the divalent sulfate anion (SO42-) 7,28. Data from the Lee group suggest that mammalian Best1 has permeability to γ-aminobutyric acid (GABA) and glutamate and that these permeabilities underlie a tonic form synaptic inhibition in the central nervous system and glutamate release from astrocytes, respectively 30,31.
In order to further understand the architecture of bestrophin, its mechanisms for ion permeation, ion selectivity and Ca2+-dependent gating, and the effects of disease-causing mutations, we have reconstituted CaCC function from purified protein and have determined X-ray structures of Best1-Fab complexes with Ca2+ and permeant anions.
Crystallization of Best1-Fab complexes
A construct encompassing amino acids 1-405 of chicken Best1 (Best1cryst), which shares 74% sequence identity with human Best1 (Extended Data Fig. 1), exhibited good biochemical stability and was selected for crystallization (Methods). Well-ordered crystals formed in the presence of trace amounts (∼1 μm) of Ca2+ and required crystallization with a Fab monoclonal antibody fragment that preferentially recognizes the Ca2+-bound form of Best1cryst (Extended Data Fig. 2). Crystals obtained at pH 8.5 (space group C2) and at pH 4.0 (space group P21) diffracted X-rays to 3.1 Å and 2.85 Å resolution, respectively (Extended Data Table 1). Experimental phases yielded high quality electron density maps that enabled placement of all the amino acids of Best1cryst spanning residues 2-367 and nearly all Fab residues (Extended Data Fig. 3). The asymmetric units contain five (P21) or ten (C2) Best1 subunits and a corresponding number of Fab fragments, and the atomic models are refined to crystallographic free residuals of 0.23 and 0.26, respectively, with good stereochemistry (Extended Data Table 1 and Extended Data Fig. 4). Structures of the channels are indistinguishable between the crystal forms (root-mean-square deviation = 0.2 Å). Except where noted, the discussion of the structure pertains to the P21 crystals, which diffract to higher resolution.
Gating and permeability in liposomes
We studied the function of purified Best1cryst by reconstituting it into liposomes and monitoring ion flux using a fluorescence-based assay (Fig. 1 and Extended Data Fig. 5). To assay for Ca2+ dependent activation, proteoliposomes that were reconstituted in EGTA and loaded with sulfate, which is essentially impermeant 28, were diluted into solutions containing Cl- and various concentrations of free Ca2+. We observed fluorescence decreases that depended on the Ca2+ concentration indicative of Ca2+-activated permeation of Cl- into the liposomes (Fig. 1a). Cl- flux was observed only from liposomes containing Best1cryst and not from control samples devoid of protein (empty vesicles) and it would result from the fraction of channels that are oriented with their regulatory Ca2+ binding site (cytosolic side) facing away from the interior of the liposomes. Ca2+-dependent activation was also observed using NO3- as the permeant anion (Extended Data Fig. 5b). To assess the permeability of other anions, Best1cryst was reconstituted in the presence of ∼2 μM free Ca2+ to activate channels in both orientations and the proteoliposomes were diluted into solutions containing various test anions. We observed time-dependent fluorescence decreases indicative of permeability to NO3-, Br-, and Cl- with a permeability sequence of NO3- > Br- > Cl- (Fig. 1b), which is in agreement with measurements made in cellular contexts 11,28,29,32. Permeability to glutamate, aspartate, gluconate, and phosphate were not detected (Supplementary Discussion). Reconstitution of the Best1cryst-Fab complex yielded analogous anion permeation properties to Best1cryst alone and this indicates that the crystallized complex supports anion flux (Extended Data Fig. 5c). Our results demonstrate that assembled Best1 oligomers form anion pores that aredirectly gated by Ca2+.
Figure 1. Ionic permeability of Best1 in liposomes.
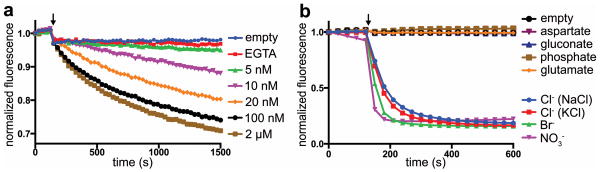
a, Purified Best1cryst recapitulates Ca2+-activated Cl- flux. Fluorescence traces elicited by various concentrations of free Ca2+ are shown. b, Anion permeability. Except for KCl, all test ions were sodium salts. The increased rate of fluorescence decay compared to a suggests that channels are predominately oriented with their cytosolic side inside the proteoliposomes. Arrows indicate addition of a proton ionophore (Extended Data Fig. 5a).
Architecture
The bestrophin channel is a pentamer of five Best1 subunits symmetrically arranged around a central axis (Fig. 2 and Supplementary Discussion). It is roughly barrel-shaped with dimensions of ∼ 70 Å across and ∼ 95 Å high. A single ion pore is located perpendicular to the plane of the membrane, along channel's axis of symmetry (Fig. 2b). Based on surface hydrophobicity (Extended Data Fig. 6a), the protein extends just beyond the extracellular side of the membrane and protrudes ∼ 55 Å into the cytosol. Five Fabs bind with 1:1 stoichiometry to the cytosolic region at a subunit interface and radiate outward (Extended Data Fig. 4a). Each subunit crosses the membrane four times, predominately as α-helices but also as extended conformations (Fig. 2 and Extended Data Fig. 6b). The secondary structure can be divided into four segments accordingly (segments S1-S4). Each segment contributes to the large intracellular region, which appears integral to the channel as a whole rather than a domain separate from it (Fig. 2).
Figure 2. Architecture and Ion Pore.

a, Overall structure of Best1cryst. The perspective is from within the membrane, with subunits coloured individually, α-helices depicted as cylinders, and approximate boundaries of the membrane indicated. The boxed region highlights a Ca2+ clasp with bound Ca2+ (teal sphere). b, Ion pore. Within a ribbon representation of three subunits of Best1 (two in the foreground are removed) is a representation (grey colour) of the minimal radial distance from the center of the pore to the nearest van der Waals protein contact. Secondary structural elements are coloured according to their four segments (S1 blue, S2 green, S3 yellow, S4 and C-terminal tail red).
Extending from its ordered N-terminus (at Thr 2, Methods), the S1 segment runs below the plane of the membrane, forms a lateral helix-turn-helix structural element involving helices S1a and S1b and transitions into the S1c helix that traverses the membrane (Fig. 2). The S1b helix is amphipathic, with hydrophilic amino acids facing the cytosol and hydrophobic amino acids positioned to interact with the lipid membrane. The S1a-S1b helix-turn-helix element is one component of a “Ca2+ clasp” from each subunit that binds intracellular Ca2+ (Fig. 2a).
Helices S2a and S2b, which traverse the membrane but are mostly shielded from it, line nearly half of the ion pore (Fig. 2b). The junction between S2a and S2b occurs near the midpoint of the membrane (Tyr 72, Ala 73, and Glu 74) and exposes the N-terminal end of S2b to the pore. Following S2b, six α-helices (S2c-S2h) form a compact structure that comprises the bulk of the intracellular portion of the channel.
The S3 and S4 segments each contain one cytosolic helix (S3a and S4b) and one transmembrane helix (S3b and S4a). S3a and S3b are roughly parallel to S4b and S4a, respectively, and their junctions in secondary structure are similarly located with respect to their positions along the symmetry axis. The amino acids preceding S4a adopt an extended conformation and span approximately 1/3 of the transmembrane region, leaving the N-terminal end of S4a exposed to the ion pore. The junction between S4a and S4b, which forms a tight turn and contains the highly conserved cluster of acidic amino acids, comprises the other component of the “Ca2+ clasp”. Following S4b, amino acids 326 to 367 adopt an elongated conformation (the “C-terminal tail”) that wraps around the cytosolic portion of two adjacent subunits (Fig. 2 and Extended Data Fig. 3b). The C-terminal tail is well conserved among bestrophin orthologs (e.g. it has the same length and shares 68% amino acid identity with human Best1) but its sequence is a distinguishing feature of Best1-4, possibly signifying a modulatory role that imparts functional differences to these paralogs 7 (Supplementary Discussion).
Ion pore
The pore is ∼ 95 Å long and continuous in the sense that there are no lateral openings through which ions might pass. Portions of the S2, S3, and S4 segments line the pore and its diameter varies along its distance (Fig. 2b). An ion moving from the extracellular side toward the intracellular side would encounter a wide funnel-shaped “outer entryway” (∼20 Å across) that narrows to a slender “neck” near the midpoint of the membrane. The outer entryway is lined by amino acids including those from helix S2a, creating a hydrophilic surface that is exposed to the aqueous extracellular environment. The hydrophobic amino acids Ile 76, Phe 80 and Phe 84 protrude from each of the five S2b helices and line the neck of the pore. Exposure of Phe 80 and other amino acids from the S2 segment to the pore is in agreement with prior studies 33,34. The region of helix S2b that forms the neck is nearly perpendicular to the membrane plane and angled out slightly such that the neck is perceptively wider at Phe 84, which corresponds approximately to the level of the membrane/cytosol interface (Fig. 2b).
Below Phe 84, the S2b helices bend slightly and the pore opens into a large “innercavity”(approximately 45 Å long and 20 Å across at its widest point) that spans the majority of the channel's cytosolic portion before the pore narrows again to its cytosolic “aperture” (Fig. 2b). Amino acids following the bend in S2b contribute to the surface of the inner cavity, which is hydrophilic. Tilted S3a helices also line the inner cavity, narrowing it to the aperture at Val 205.
The Ca2+ clasp
Electron density consistent with Ca2+ was observed within the Ca2+ clasp, which consists of the acidic cluster between S4a and S4b (Glu 300, Asp 301, Asp 302, Asp 303, and Asp 304) from one subunit and the S1a-S1b helix-turn-helix element of an adjacent subunit (Fig. 3). The assignment of the electron density to Ca2+ is corroborated by the chemistry of coordination and by a corresponding peak in an anomalous difference electron density map (Fig. 3a). To investigate the possibility of additional Ca2+ binding site(s), and to determine what effect, if any, the low pH of the P21 crystal form has on Best1, diffraction data were collected from crystals grown in the presence of 5 mM Ca2+ at pH 4 and pH 8.5 (P21 and C2 forms, respectively), and the atomic models were refined (Extended Data Table 1). No differences in the structure of Best1 were detected and anomalous difference electron density attributable to Ca2+ was observed only in the previously identified Ca2+ site.
Figure 3. Ca2+ sensing apparatus.

a, View of a Ca2+ clasp (same orientation as Fig. 2a), showing electron density for Ca2+: FO-FC density (blue mesh; simulated annealing omit, 40 - 2.85 Å, 8σ contour) and anomalous difference density (yellow mesh, 40 - 4.0 Å, 3σ contour). b, Coordination in the Ca2+ clasp. The acidic cluster and the backbone carbonyls that coordinate (dotted lines) the Ca2+ (teal sphere) are depicted as sticks on a Cα representation. Dotted lines also indicate hydrogen bonds between the water molecule (red sphere) and the protein (backbone carbonyls of Val 9 and Glu 292). Carbon atoms of one subunit are grey and those from another are yellow.
Together, the five symmetrical Ca2+ clasps resemble a belt around the midsection of the channel, below of the membrane/cytosol interface (Fig 2a). Consistent with a high-affinity interaction, Ca2+ is buried by the protein but would become accessible to solvent if S1a-S1b were dislodged. Ca2+ coordination has pentagonal bipyramidal geometry, where bidentate coordination by the side chain of Asp 304 along with the backbone carbonyl oxygen atoms of Ala 10 and Gln 293 and an ordered water molecule align along the vertices of an approximately planar pentagon and the side chain of Asp 301 and the backbone carbonyl of Asn 296 take axial positions (Fig. 3b). The coordination is similar to that observed for canonical EF hand domains35 and for the “Ca2+ bowl” of the BK potassium channel 36, and has an average Ca2+-oxygen distance of 2.5 Å. Glu 300, Asp 302 and Asp 303 surround the binding site for Ca2+ and although they do not contact the ion directly, they may serve to increase the local concentration of Ca2+ (Fig. 3b and Supplementary Discussion). The absence of Ca2+ would probably have dramatic effects on the conformations of the S4a-S4b junction and the S1a-S1b region.
Anion binding
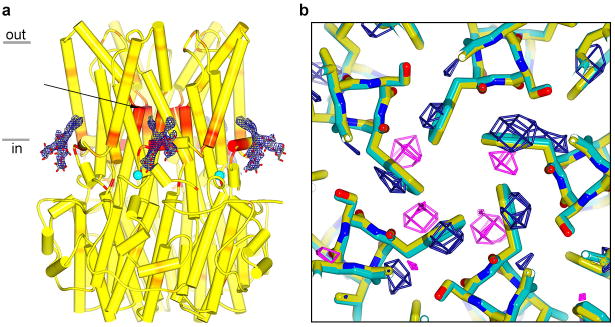
Electron densities at several sites within the ion pore were consistent with bound Cl- ions. To distinguish Cl- from water or other entities, we collected X-ray diffraction data from crystals grown in 150 mM Br-, a permeable anion that is crystallographically identifiable from its anomalous X-ray scattering. Anomalous difference electron density maps indicate the presence of Br- at three locations within the pore (sites 1-3), with each location exhibiting five-fold symmetry (Fig. 4a and Extended Data Fig 6c). All of the sites are accessible to the aqueous environment of the pore, with two rings of sites located within the outer entryway (sites 1 and 2) and one ring of sites located within the inner cavity (site 3). Reminiscent of the ClC family of Cl- channels/transporters 37 and a glutamate-gated Cl- channel 38, in each of the sites, the Br-/Cl- ion is bound adjacent to the N-terminal end of an α-helix where it is stabilized by positive electrostatic potential arising from the oriented peptide dipoles of the helices (Fig. 4b).
Figure 4. Anion binding.

a, Cut-away view of Best1, revealing the surface of the pore (coloured by electrostatic potential; red: -10 kT e-1, white: neutral, blue: +10 kT e-1) and anomalous difference electron density for Br- ions (magenta mesh; 45 - 5 Å, non-crystallographic symmetry averaged, 8σ contour). b, Anion binding sites (magenta spheres) at the N-terminal ends of α-helices. Representations of the S4 and S2 segments of one subunit (upper and lower panels, respectively) are shown in the context of the entire channel. α-helices (cylinders) interacting with Cl-/Br- are coloured blue-to-red from their N- to their C-terminal ends. A teal sphere (upper panel) denotes Ca2+. c, d, and e. Coordination of Cl-in sites 1, 2 and 3. Interactions (distances < 4 Å) with Cl- (magenta spheres) are shown for polar (grey dashes) and hydrophobic (green dashes) contacts. Protein is depicted as sticks, with carbon atoms of one subunit coloured teal and those of other subunits grey. Hydrogen bonding networks (in sites 1 and 3) and an ordered water molecule (red sphere in site 1) are shown. In c and d, asterisks indicate main chain amide nitrogen atoms at the N-terminal ends of α-helices. A dashed yellow line (d) indicates the ∼ 5Å distance to the N-terminal end of helix S2c. In e, Cl- coordination outside the neck of the porein site 2 is shown in the context of four S2 segments (foreground segment removed for clarity). f, Electron density (2FO-FC, 40 – 2.85 Å, 2.0σ contour) for two S2 segments and their corresponding Cl- ions (magenta spheres) in the same orientation as e.
The binding in site 1, which is located closest to the extracellular side and at a subunit interface, is stabilized by direct electrostatic interactions with main chain amide nitrogen atoms at the N-terminal end of helix S4a and by interactions with the side chains of Tyr 68, Tyr 72 from one subunit and Thr 277 of another subunit (Fig. 4c). Electron density consistent with a water molecule, which coordinates the Cl- ion and is itself stabilized by a hydrogen bond with the protein, delineates an approximate trajectory for the Cl- into the aqueous environment of the pore (Fig. 4c and Extended Data Fig. 6c).
Site 2 is located at the base of the outer entryway, above the neck, and its position approximately corresponds to the midpoint of the membrane (Fig. 4e). The positive dipole at the end of helix S2b makes the only direct electrostatic interaction with the anion. The absence of other interactions is consistent with the weaker anomalous difference electron density observed at site 2 in comparison to sites 1 and 3, and may be indicative of lower binding affinity).
Site 3 is located within the inner cavity at a subunit interface and is within ∼5 Å of the main chain amide nitrogen of Arg 105 at the N-terminal end of helix S2c from one subunit and is within ∼ 4 Å of the side chains of Arg 218 and Ser 219 from the adjacent subunit (Fig. 4d). Whether these interactions are direct or water-mediated is unclear. Mutations in or around sites 1-3 (e.g. Y72D, L75F, I76V, F80L, F84V, R218S) are associated with eye diseases 19.
The observed sites would increase the local concentration of anions on both sides of the neck of the pore and this may contribute to anion selectivity. A similar mechanism has been proposed for an anion-selective Cys-loop receptor 38. In Best1, the sites appear well suited for monovalent anions (e.g. peptide dipoles in sites 1 and 2 provide the only positive electrostatic potential) and this may contribute to the channel's selectivity for monovalent anions over divalent ones. Except for the positively charged pockets that form the anion binding sites, the electrostatic surface of the outer entryway is predominately negative and it would therefore tend to exclude anions other than the ones that can bind in sites 1 and 2 (Fig. 4a and Extended Data Fig. 6c). The inner cavity is predominately positive and is therefore a favorable environment for anions that can access it.
The permeability sequence of Best1 for monovalent anions corresponds with their relative hydration energies, which suggests that the ions become at least partially dehydrated at some point during permeation 7,39. In the neck of the pore, the distances between the central axis and Ile 76, Phe 80, and Phe 84 are approximately 3.8 Å, 3.1 Å, and 4.0 Å, respectively (measured to atom CG2 of Ile 76 and to the edge of the phenylalanine rings). The electron densities for Ile 76 and Phe 80 are weaker than for Phe 84 (Fig. 4f), which suggests there is a degree of “breathing” of the pore due to side chain rotamer conformational changes and/or backbone mobility and that the effective diameter of the pore experienced by a permeating anion would be larger than deduced solely from the average positions of these residues. Regardless, an anion passing through the hydrophobic neck would need to be at least partially dehydrated. The relatively low single channel conductance of bestrophin (∼ 2 pS for Drosophila Best112) could be due to an energy barrier imposed by the neck. Congruently, although anions are not observed in the neck, they are poised just outside of it.
The aromatic rings of phenylalanine residues have negative electrostatic potential associated with the face of their π system and positive electrostatic potential associated with their edges. Interaction of a cation with the face of an aromatic ring (the cation-π interaction) has been widely discussed and is important in protein structure and ligand binding (e.g. 40). Phe 80 and Phe 84 are positioned such that the edge of each phenylalanine residue interacts with the face of the corresponding phenylalanine from the neighboring subunit (Extended Data Fig. 7). Such edge-face interactions are commonly observed in proteins. The arrangement is also such that the electrostatically positive edges of the aromatic rings are oriented toward the central axis of the pore (Fig. 4e and Extended Data Fig. 7). This creates positive electrostatic potential along the central axis that could stabilize a permeating anion. The interaction between an anion and the edge of an aromatic ring (the anion-π interaction) is calculated to be energetically favorable and a survey of protein structures indicates that it commonly occurs, for instance where an aspartate interacts with the edge of a phenylalanine 41-43. Based on these studies, the geometries between the central axis of the pore and the aromatic rings of Phe 80 and Phe 84 are favorable for interactions with anions (Extended Data Fig. 7) 41,42. As such, a permeating anion may interact electrostatically with Phe 80 and Phe 84 within the neck of the pore and this may contribute to anion selectivity.
Retinopathies and the gating apparatus
While mutations associated with eye disease occur in several areas of Best1, they are particularly prevalent in or around the Ca2+ clasp and the neck of the pore (Fig. 5a). This includes mutations of the Ca2+ ligands Asp 301 and Asp 304 and the surrounding acidic residues that are known to impair channel function 6,13,26,27, as well as mutations within the S1a-S1b element, consistent with the role of this region in sensing intracellular Ca2+. Mutations within neck (e.g. of Phe 80 and Phe 84) also alter permeation properties of the channel 33,34.
Figure 5. Retinopathies and the gating apparatus.

a, Locations of missense mutations associated with retinal diseases19 mapped on the structure (red spheresindicate Cα positions). Teal spheres represent Ca2+. b, Hypothesized mechanisms of gating and selectivity. Intracellular Ca2+ binding is coupled to dilation of the gate (neck). Within the context of the otherwise negatively-charged outer entryway, binding sites for monovalent anions (magenta) increase their local concentration. Phenylalanine residues within the gate may contribute to selective anion permeation via anion-π interactions (δ+). Additional binding sites for anions are located in the predominately positive inner cavity.
The narrowness of the neck, its high degree of sequence conservation, and its positioning along the pore nearest to the Ca2+ binding site suggest that the neck forms a gate. Subtle structural changes near the Ca2+ clasp, which we observed between crystals grown using different detergents (Extended Data Fig. 8), are correlated with subtle changes in the diameter of the neck, suggesting that there is conformational coupling between the Ca2+ sensor and the gate. We propose that the gate is dilated when Ca2+ is bound and seals shut when Ca2+ is absent (Fig. 5b). The movements within the gate that switch between conductive and non-conductive states may be limited to side chain motions or they may be more dramatic. While the Fab does not interact with the Ca2+ clasp, its specificity for the Ca2+ bound form suggests that Ca2+-dependent gating also involves long-range conformational changes.
Conclusion
The X-ray structure of Best1 reveals the architecture of a eukaryotic Ca2+-activated Cl- channel. Crystallized in complex with Ca2+ and stabilized by an Fab that preferentially binds the Ca2+ bound form of the channel and supports ion flux, the structure likely represents an open state (or a nearly open state). In several respects, the channel differs in structure and mechanism from other ion channels. Numerous binding sites for Cl- increase its local concentration and probably contribute to selective permeation. Phenylalanine residues that serve as part of the channel's gate may also facilitate anion permeation and contribute to anion selectivity via anion-π interactions. The channel's cytosolic aperture may function as a size-selective filter that permits passage of the small anions permeable to Best1 while preventing large intracellular anions (e.g. proteins, nucleic acids etc.) from accessing the positively-charged inner cavity and obstructing the permeation pathway. The gating apparatus, which is often mutated in Best1-related eye diseases, appears to couple the binding of intracellular Ca2+ to dilatation of the centrally located ion gate.
Methods
Cloning, expression, and purification of Best1cryst
Chicken (Gallus gallus) bestrophin-1 was cloned from cDNA (BioChain) and identified as a promising candidate for protein purification and crystallization from among 30 orthologs of human bestrophin-1 that we evaluated using the fluorescence-detection size exclusion chromatography (FSEC) pre-crystallization screening technique 44. Guided by sequence conservation, limited proteolysis of purified protein, and predicted secondary structure, a construct spanning amino acids 1-405 of chicken Best1 was used for crystallization (Best1cryst). cDNA encoding Best1cryst was cloned into pPICZ (Invitrogen) and consists of amino acids 1-405 followed by an affinity tag (Glu-Gly-Glu-Glu-Phe) that is recognized by the anti-tubulin antibody YL½ 45. Transformation into Pichia pastoris, protein expression, and lysis was performed as previously described 46.
Lysed cells were resuspended (using ∼ 10 ml of buffer for each gram of cells) in a purification buffer consisting of 50 mM Tris-HCl, pH 7.5, 75 mM NaCl, 75 mM KCl, 0.1 mg/mL deoxyribonuclease I (Sigma-Aldrich), a 1:600 dilution of Protease Inhibitor Cocktail Set III, EDTA-free (CalBiochem), and 0.5 mM 4-(2-Aminoethyl) benzenesulfonyl fluoride hydrochloride (Gold Biotechnology). 0.14 g of n-dodecyl-β-D-maltopyranoside (DDM; Anatrace) was added per 1 g of cells, the pH was adjusted to pH 7.5 using 1 M NaOH, and the sample was agitated for 45 minutes at room temperature. Following extraction, the sample was clarified by centrifugation at 43,000 × g at 12°C for 40 minutes and filtered using a 0.45 μm polyethersulfone membrane. Affinity purification was achieved using YL½ antibody (IgG, expressed by hybridoma cells and purified by ion exchange chromatography) that was coupled to CNBr-activated sepharose beads according to the manufacturer's protocol (GE Healthcare). 1.0-2.0 mL of resin was added to the sample for each 1 g of P. pastoris cell lysate and the mixture was rotated at room temperature for 1 hr. The mixture was then applied to a column support and was washed with ∼ 5 column volumes of a buffer containing 20 mM Tris-HCl, pH 7.5, 75 mM NaCl, 75 mM KCl, and 3 mM DDM. Elution was carried out using 4 column volumes of elution buffer: 100 mM Tris-HCl, pH 7.5, 75 mM NaCl, 75 mM KCl, 3 mM DDM, and 5 mM Asp-Phe peptide (Sigma-Aldrich). The elution fraction was concentrated to ∼ 2 mg/ml using a 100,000 Da concentrator (Amicon Ultra; EMD Millipore) prior to combining with the Fab. Mass spectrometry and Edman degradation of purified Best1cryst indicate that the initial methionine has been removed and that the amino-terminus is at Thr 2.
Fab production and co-crystallization
A monoclonal antibody (designated 10D10) of isotype IgG1 was raised in mice by the Monoclonal Antibody Core Facility of the Memorial Sloan Kettering Cancer Center and selected for co-crystallization with Best1cryst. The antigen used for immunization was Best1cryst that had been purified in DDM and digested using the serine protease GluC (Worthington), which removes approximately 20 amino acids from the C-terminus of the protein. The antibody selection process included ELISA, western blot, and FSEC analysis to identify antibodies that bound to native Best1cryst and not SDS-denatured protein. The cDNA sequence of the antibody was determined from hybridoma cells by SYD Labs. The antibody was expressed using mouse hybridoma cells, purified by ion exchange chromatography and cleaved using papain (Worthington) to generate the Fab fragment. The Fab fragment was purified using ion exchange chromatography (Mono S, GE Healthcare), dialyzed into buffer containing 20 mM Tris-HCl, pH 7.5, 75 mM NaCl, 75 mM KCl, and further purified using size exclusion chromatography (SEC) (Superdex-200 10/300 GL, GE Healthcare) in the same buffer immediately before combination with Best1cryst. The purification buffers contained approximately 1 μM Ca2+, which was present due to impurities and was determined using the Fura-2 calcium indicator (Invitrogen). The protein preparations of Best1cryst and Fab (∼ 2 mg/ml) were combined in a molar ratio of 1:1.2 (Best1cryst:Fab) such that the concentration of DDM was ∼ 1.5 mM, concentrated using a 10 kDa molecular weight cutoff concentrator (Vivaspin 15R, Sartorius) to ∼ 15 mg/ml and purified using SEC. The SEC buffer contained 10 mM Tris, pH 7.5, 75 mM NaCl, 75 mM KCl, and one of the following three detergents: 1) 3 mM 6-cyclohexyl-1-hexyl-β-D- maltopyranoside (cymal-6; Anatrace); 2) 0.5 mM 2,2-bis(3′-cyclohexylbutyl) propane-1,3-bis-β-D-maltopyranoside (cymal-6-NG; Anatrace); or 3) 5 mM n-Decyl-β-D-Maltopyranoside (DM; Anatrace). For crystallization with Br-, 150 mM NaBr (Sigma Aldrich) was used in place of NaCl and KCl. The elution fraction containing the Best1cryst:Fab complex was concentrated to ∼ 14 mg/ml using a 100 kDa concentrator (Amicon Ultra; EMD Millipore). 50 mM γ-aminobutyric acid (GABA) was then added as a crystallization additive and the sample (at ∼ 12 mg/ml) was used for crystallization trials. GABA improved the reliability of obtaining well-formed crystals but was not required for crystallization. For crystallization with additional Ca2+, 5 mM CaCl2 was added to the sample prior to crystallization. Crystals formed in the absence of the Fab but were pathologic (poor diffraction, severe anisotropy, and crystal twinning).
Best1cryst-Fab crystals belonging to the P21 space group were obtained using vapor diffusion from protein that was purified in cymal-6 or cymal-6-NG (1:1 ratio of protein:crystallization solution) using a crystallization solution of 0-60 mM NaCl, 50 mM Sodium acetate, pH 4.0, 5% (w/v) PEG 4000 (Sigma-Aldrich), and 20% (v/v) glycerol at 20°C. These crystals were harvested after 5-10 days and flash-cooled in liquid nitrogen. Crystals belonging to the C2 space group were grown by vapor diffusion (1:1 ratio of protein to crystallization solution) using a crystallization solution of 120 mM NaCl, 50 mM Tris, pH 8.5, 8.5% (w/v) PEG 4000 (Sigma-Aldrich), and 20% glycerol (v/v) at 25°C. The crystals were harvested using nylon loops and transferred in a series of five steps to increase the PEG 4000 to 25% (w/v) before flash-cooling in liquid nitrogen. Diffraction data were collected from crystals cooled at 100 K under a stream nitrogen gas using Pilatus 6M detectors (Dectris) at Brookhaven National Synchrotron Light Source (beamline ×25) or the Advanced Photon Source (beamline 24-ID-C).
Structure determination
Initial phases (50 – 6 Å) were determined using a tantalum bromide-derivatized crystal belonging to the P21 space group via the SAD method in SHARP 47 (Extended Data Table 1, anomalous phasing power = 1.3 from 50 - 6 Å and 0.78 in the 6.1 – 6.0 Å shell). To prepare the tantalum bromide derivative (P21 form), solid (Ta6Br12)Br2 (Jena Bioscience) was added to crystallization drops containing suitable crystals, and these were incubated at 20°C for 2 days followed by another addition of solid (Ta6Br12)Br2 and further incubation for 3 days. The “native” C2 crystal was also incubated with a smaller amount of solid (Ta6Br12)Br2 for 24 hours, but no evidence of tantalum bromide could be detected in electron density maps. Diffraction data were collected using an oscillation angle of ∼ 0.3° and high redundancy was permitted by collecting data from multiple locations throughout the crystals. Diffraction data were processed with HKL3000 48 and resolution limits were assessed using the CC1/2 statistic 49.
Phases were extended and improved using solvent flattening, histogram matching, and 5-fold non-crystallographic symmetry (NCS) averaging with the program DM 50 (yielding a figure of merit = 0.82 for the resolution range 50 to 4.4 Å and figure of merit = 0.78 for 4.5 to 4.4 Å shell). An atomic model was built using the coot and O software programs 51 and improved through iterative cycles of refinement (using CNS, Refmac, and PHENIX 52-54), making use of bulk solvent, NCS, and TLS refinement strategies. Electron density is continuous for Best1cryst residues 2-367 and also clear for the Fabs. Initial phases for diffraction data collected from crystals belonging to the C2 space group were determined by molecular replacement (PHENIX 53). The atomic model required slight rigid body adjustments to the constant immunoglobulin domains of the Fabs and it was refined in PHENIX, making use of the ten-fold non-crystallographic symmetry. Comprehensive model validation was performed with MolProbity 55 (within PHENIX). Data collection and refinement statistics are shown as Extended Data Table 1. Molecular graphics figures were prepared using the programs PyMOL (http://www.pymol.org/) with the APBS plugin 56 and using the program HOLE 57.
Anion flux assay
For reconstitution into liposomes, Best1cryst was purified as described above except that SEC was performed in the absence of the Fab and the SEC buffer consisted of 150 mM NaCl, 20 mM Tris-HCl, pH 8.5, and 3 mM n-Decyl-β-D-Maltopyranoside (DM). The reconstitution procedure was based on methods described previously 58. A 3:1 (wt:wt) mixture of POPE (1-palmitoyl-2-oleoyl-sn-glycero-3-phosphocholine; Avanti) and POPG (1-palmitoyl-2-oleoyl-sn-glycero-3-phospho-(1′-rac-glycerol; Avanti)) lipids was prepared at 20 mg/ml in one of the two reconstitution buffers indicated below and the lipids were solubilized with 8% n-Octyl-β-D-maltopyranoside (w/v, Anatrace). The protein was then mixed with an equal volume of the solubilized lipids to give a final protein concentration of 0.1 mg/ml and a lipid concentration of 10 mg/ml. Detergent was removed by dialysis (8000 Da molecular weight cutoff) at 4°C against a total of 10 L of reconstitution buffer with daily buffer exchanges over a course of 5 days. For the ion permeability experiments (Fig. 1b and Extended Data Fig. 5c), 10 μM CaCl2 was added to the protein following SEC and the reconstitution buffer consisted of: 100 mM sodium sulfate, 0.2 mM EGTA, 0.19 mM CaCl2, and 10 mM HEPES, where the pH was adjusted to 7.0 using NaOH. The free Ca2+ concentration of this buffer was ∼ 2 μM as determined using the Fura-2 calcium indicator (Invitrogen). For Ca2+ gating experiments (Fig. 1a and Extended Data Fig. 5b), purified protein was used without the addition of CaCl2 and the reconstitution buffer was: 100 mM sodium sulfate, 1 mM EGTA, 10 mM HEPES, and the pH was adjusted to 8.1 with NaOH. The higher pH of this buffer was necessary to sufficiently chelate Ca2+ using EGTA to close the channel. “Empty” (lipid only) vesicles were prepared in parallel in the same manner in the absence of protein. Following dialysis, the liposomes were sonicated for approximately 20 s in a water bath, divided into aliquots, and flash-frozen in liquid nitrogen for storage at -80°C.
Reconstitution of the Best1cryst-Fab complex (Extended Data Fig. 5c) was done in parallel using the same preparation of Best1cryst and using the same reconstitution buffer (100 mM sodium sulfate, 0.2 mM EGTA, 0.19 mM CaCl2, and 10 mM HEPES-NaOH, pH 7.0). For this, Best1cryst and Fab were combined in SEC buffer supplemented with 10 μM CaCl2 to yield an excess of Fab (Best1cryst: Fab molar ratio of approximately 1:1.7). The sample was then mixed with an equal volume of solubilized lipids to give a final Best1cryst concentration of 0.1 mg/ml, an Fab concentration of 0.18 mg/ml and a lipid concentration of 10 mg/ml. Proteoliposomes were then produced in the same manner as the sample without Fab. Prior to combining the sample with solubilized lipids, a small amount of the sample was analyzed by SEC (in 150 mM NaCl, 20 mM Tris-HCl, pH 8.5, and 3 mM DM) in comparison to the analogous sample of Best1cryst alone and to the Fab. A shift in the elution volume (13.1 ml for Best1cryst and 12.3 ml for the Best1cryst-Fab complex using a Superdex-200 10/300 GL column) and quantification of the amount of free Fab confirmed formation of the Best1cryst-Fab complex prior to reconstitution into liposomes. To evaluate whether the Best1cryst-Fab complex was intact in the proteoliposomes, the amount of unbound Fab was quantified following dialysis by SEC (using reconstitution buffer as the running buffer, without detergent) and it was determined to be the same as the amount of excess Fab (within error) prior to reconstitution. If the Fab had dissociated from Best1cryst as a result of the reconstitution of Best1cryst into liposomes, then the amount of excess Fab would be more than twice its initial value and therefore, to a first approximation, the complex was fully intact in the proteoliposomes.
The flux assay was based on previously published methods 58-60. Vesicles were thawed in a 37°C water bath, sonicated (for ∼ 30 s, in 10 s intervals), and diluted by 100-fold into a flux assay buffer. For ion permeability experiments (Fig. 1b and Extended Data Fig. 5c), the flux assay buffer consisted of 10 mM HEPES-NaOH, pH 7.0, 0.2 mM EGTA, 0.19 mM CaCl2, 0.5 mg/ml bovine serum albumin (BSA), 2 μM 9-amino-6-chloro-2-methoxyacridine (ACMA, Sigma-Aldrich, from a 2 mM stock solution in DMSO), and a test salt. The free Ca2+ concentration was ∼ 2 μM (determined using Fura-2). The test salts used were: 125 mM NaCl, 125 mM KCl, 125 mM NaBr, 125 mM NaNO3, 125 mM sodium L-aspartate, 125 mM sodium L-glutamate, 110 mM sodium D-gluconate, or a mixture of Na2HPO4 and NaH2PO4 containing 110 mM phosphate to yield a pH of 7.0. Test salt concentrations were chosen to yield flux assay buffers with approximately the same osmolality as the reconstitution buffer (∼ 255 mOsm, Vapro 5600 osmometer; Wescor Biomedical Systems). Data were collected on a SpectraMax M5 fluorometer (Molecular Devices) using the Softmax Pro 5 software package. Fluorescence intensity measurements were collected every 30 seconds with excitation and emission wavelengths of 410 nm and 490 nm, respectively. 1 μM of the proton ionophore carbonyl cyanide m-chlorophenyl hydrazone (CCCP, Sigma-Aldrich, from a 1 mM stock solution in DMSO) was added after 120 seconds and the sample was gently mixed with a pipette in advance of the reading at the 150 second time point. Fluorescence readings were normalized by dividing by the initial reading and were comparable before normalization. Experiments using Best1cryst (Fig. 1b) and the Best1cryst-Fab complex (Extended Data Fig. 5c) were recorded in parallel on the same day and using the same solutions. The trace for the empty vesicle control (Fig. 1b and Extended Data Fig. 5c) shows results using NaNO3 and is representative of results obtained using other salts.
For Ca2+ gating experiments, the flux assay buffer consisted of 125 mM NaCl (Fig. 1a) or 125 mM NaNO3 (Extended Data Fig. 5b) and 10 mM HEPES-NaOH, pH 8.1, 0.5 mg/ml BSA, 2 μM ACMA, and mixtures of 1 mM EGTA and 1 mM Ca-EGTA to yield a range of free [Ca2+]. A Ca-EGTA stock solution was made by mixing 95 mM CaCO3 and 100 mM EGTA at pH 8.1 (adjusted with NaOH) and titrating the final [Ca2+] using CaSO4 to make it equal to [EGTA] by the pH-metric method61. The concentrations of free [Ca2+] were calculated using Chelator 62 as implemented at http://maxchelator.stanford.edu/CaEGTA-TS.htm. Experiments in Figure 1a and Extended Data Figure 5b were recorded on the same day using the same batch of proteoliposomes. Traces shown for empty vesicles (2 μM free Ca2+) are representative of other Ca2+ concentrations.
Fab binding assay
To assess binding of the Fab to Best1cryst (Extended Data Fig. 2), 8 nM Fab was incubated (>30 min at 4° C) with various concentrations of Best1cryst ranging from 10 nM to 600 nM in buffer (75 mM NaCl, 75 mM KCl, 1 mM DDM, 20 mM Tris-HCl at pH 8.5) containing either 5 mM EGTA or 10 μM CaCl2. 400 μl of each mixture was loaded onto an SEC column (Superdex-200 10/300 GL), which was equilibrated in the same buffer, and the fraction of unbound Fab was quantified from the area under the elution peak corresponding to free Fab (at 17.3 ml and detected using tryptophan fluorescence on a Shimazdu RF-20AXS fluorescence detector), which is well separated from the peaks for Best1cryst and the Best1cryst-Fab complex (13.1 ml and 12.3 ml, respectively), in comparison to an Fab control.
Extended Data
Extended Data Figure 1. Sequence alignment and secondary structure.

The amino acid sequences of the crystallized chicken (Gallus gallus) Best1 construct (amino acids 2-405) and human Best1 are aligned and coloured according to the ClustalW convention. The secondary structure is indicated with cylinders representing α-helices, solid lines representing structured loop regions, and dashed lines representing disordered regions. Gray bars (labeled “in” and “out”) indicate approximate boundaries of transmembrane regions.
Extended Data Figure 2. Fab binding to Best1cryst in the presence and absence of Ca2+.

The binding of the Fab to Best1cryst was assayed by determining the amount of free Fab as a function of the concentration of Best1cryst in the presence of either 10 μM Ca2+ or 5 mM EGTA (zero Ca2+) (Methods). The fraction of Fab bound is plotted with respect to the concentration of Best1cryst. The curves correspond to fits of: fraction of Fab bound = [Best1]h/(Kdh + [Best1]h), where Kd is the equilibrium dissociation constant, h is the Hill coefficient, and [Best1] is the Best1cryst concentration. Derived parameters are: Kd = 15 nM in the presence of Ca2+ (h=1.3) and Kd = 350 nM in the absence of Ca2+ (h=1.3).
Extended Data Figure 3. Electron density and the C-terminal tail.

a, 2Fo-Fc electron density is shown, in stereo, for an area surrounding one of the five identical Ca2+ binding sites. The density was calculated from 40 to 2.85 Å resolution and contoured at 1.5 σ (blue mesh) and 7 σ (orange mesh) in the context of the final atomic model, which is shown as sticks and spheres (cyan sphere, calcium; red sphere, water). b, Electron density for the C-terminal tail. 2Fo-Fc electron density (blue mesh, calculated from 40 to 2.85 Å, and contoured at 1.5 σ) is shown for the C-terminal tail of the yellow coloured subunit. c, Expanded view highlighting the electron density near Ser 358. Consistent with the electron density, mass spectrometry analysis of tryptic peptides of purified Best1cryst detected only peptides containing Ser 358 that were not phosphorylated (Supplementary Discussion).
Extended Data Figure 4. Overall structures of the Best1cryst-Fab complex.

a, Structure of the Best1cryst-Fab complex in the P21 crystal form, viewed from the extracellular side. Fab molecules are grey and Best1 subunits are coloured individually with α-helices depicted as cylinders. b, Orthogonal view showing approximate boundaries of the membrane. For clarity, two Fabs are drawn. c, C2 crystal form. Overall structures of the two Best1cryst-Fab complexes in the asymmetric unit of the C2 crystal form are depicted in cartoon representation. Best1 subunits are colored individually and Fabs are gray.
Extended Data Figure 5. Ca2+-dependent activation of Best1cryst and permeability of the Best1cryst-Fab complex.
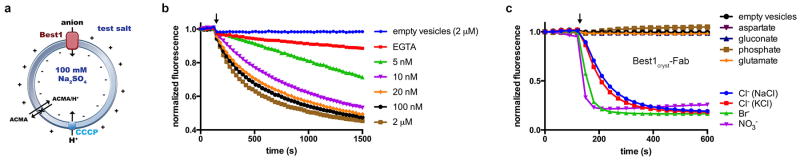
a, Schematic of the fluorescence-based flux assay. Vesicles diluted into various test salts establish ion gradients. Anion influx through Best1 produces a negative electric potential within the liposomes that drives the uptake of protons through an ionophore (CCCP) and quenches the fluorescence of a pH indicator (ACMA). b, Ca2+-dependent activation of Best1cryst using NO3- as the permeant anion. The experimental setup was identical to that for Fig. 1a, except that NO3- was used as the permeantion. Data presented here and in Fig. 1a were collected on the same day using the same batch of proteoliposomes and indicate the higher permeability of NO3- relative to Cl-. Free concentrations of Ca2+ are indicated. c, Ionic permeability of the Best1cryst-Fab complex. The experiment setup is identical to that shown (Fig. 1b), except that it was performed using proteoliposomes reconstituted with the Best1cryst-Fab complex. The Fab remained bound to the channel following reconstitution and excess Fab was maintained throughout (Methods). The slight differences in the shape of the curves for the Best1cryst and Best1cryst-Fab samples (e.g. the lower rate of fluorescence decrease for Cl − compared with Fig. 1b) are in accord with variability observed among different liposome preparations.
Extended Data Figure 6. Molecular surface, subunit topology, and anion binding in the outer entryway.

a, The molecular surface of the channel is shown in the same orientation as Fig. 2a and coloured according to electrostatic potential (red: -10 kT e-1, gray: neutral, blue: +10 kT e-1). An asterisk marks the location of the acidic cluster in the foreground. Approximate boundaries for the membrane are indicated. b, Subunit topology. N-terminal ends of α-helices exposed to the pore are indicated by +. The coloring corresponds to that of Fig. 2b. c, Anion binding in the outer entryway. Extracellular cut-away view of the molecular surface of Best1 (orthogonal representation of Fig. 4a), revealing the surface of the pore (coloured by electrostatic potential; red: -10 kT e-1, white: neutral, blue: +10 kT e-1) and anomalous difference electron density for Br- ions (magenta mesh; 45 - 5 Å, non-crystallographic symmetry averaged, 8σ contour) in sites 1 and 2.
Extended Data Figure 7. Geometry within the neck and the possibility of anion-π interactions.

a-b, Representations of the pore at Phe 80 (a) and Phe 84 (b) are shown as sticks. The distance (d) from the central axis of the pore (black sphere) to the center of the face of the aromatic ring is shown. An angle θ is defined as the angle between this distance vector and the plane of the ring. The geometry indicated corresponds to the crystal obtained in cymal-6. For the cymal-6-NG crystal, the values are: d = 3.9 Å, θ = 45° (Phe 80) and d = 4.8 Å, θ = 44° (Phe 84). c, Space filling CPK representation of the pore at Phe 80, showing a hypothetical Cl- (green) positioned in the center. Standard radii were used for the figure (carbon = 1.7 Å, Cl- = 1.81 Å). δ+ and − represent partial charges on the edge of the aromatic rings and the charge on Cl-, respectively.
Extended Data Figure 8. Evidence for coupling between the Ca2+ clasp and the gate from crystals grown in different detergents.
Comparison among crystals grown using different detergents gives insight into the channel's gate and it's coupling to Ca2+. Well-diffracting crystals belonging to the P21 space group were obtained using either the detergent cymal-6 or the detergent cymal-6-NG. Electron density maps indicated the presence of ordered cymal-6-NG but not cymal-6 molecules bound to the S1a-S1b components of the Ca2+ clasps (a). In addition, difference Fourier electron density maps suggested a slight widening of the neck of the pore in the structure with cymal-6 (b). Accordingly, while refined structures superimpose with an overall root mean squared deviation of only 0.15 Å, the diameter of the pore in the hydrophobic neck is ∼ 0.5 Å wider at Phe 80 for crystals in cymal-6 than it is with cymal-6-NG. Differences on the order of 0.3 Å between the atomic models are localized to the region near the Ca2+ clasp and to the neck of the pore (a). The subtle effects are an indication that changes in or around the Ca2+ clasp induce changes in the neck of the pore and they may hint at the mechanism of gating.
a, 2FO-FC electron density for cymal-6-NG detergent molecules, contoured at 1.2σ, is shown as blue mesh in the context of the channel. The channel, with α-helices depicted as cylinders, is coloured on a yellow-to-red spectrum according to the displacement of Cα atoms between the refined atomic models obtained from crystals grown in cymal-6 and cymal-6-NG. Yellow colour represents displacements less than 0.15 Å and red colour represents displacements greater than 0.3 Å. An arrow indicates the neck of the pore and teal spheres denote Ca2+. b, Conformational shift in the gate. Phe 80 and surrounding residues of the refined structures from crystals in cymal-6 and cymal-6-NG are shown as sticks (coloured cyan and yellow, respectively) and viewed along the channel's axis of symmetry from the extracellular side. Superimposed on this is an Fcymal-6-Fcymal-6-NG difference Fourier map, which is calculated from 25 Å to 3.5 Å resolution and contoured at -3.8σ (magenta mesh) and +3.8σ (blue mesh).
Extended Data Table 1. Data collection, phasing and refinement statistics.
Data collection statistics are from HKL3000 48; refinement statistics are from PHENIX 53. CC1/2 is defined in 49. Numbers in parentheses indicate the highest resolution shells and their statistics. 5% of reflections were used for calculation of Rfree.
| Crystal 1 | Crystal 2 | Crystal 3 | Crystal 4 | Crystal 5 | Crystal 6 | Crystal 7 | |
|---|---|---|---|---|---|---|---|
| Native | Derivative (Ta6Br12)2+ | Br- | Cymal-6 | + 5 mM Ca2+ | Native | + 5 mM Ca2+ | |
| Data Collection | NSLS X25 | NSLS X25 | NSLS X25 | NSLS X25 | NSLS X25 | APS 24-ID-C | NSLS X25 |
| Space group | P21 | P21 | P21 | P21 | P21 | C2 | C2 |
| Wavelength (Å) | 1.100 | 1.2547 | 0.9196 | 1.100 | 1.100 | 1.2543 | 1.700 |
| Cell dimensions (Å): | |||||||
| a | 98.54 | 98.713 | 98.545 | 98.424 | 98.563 | 325.341 | 329.519 |
| b | 242.904 | 241.606 | 243.268 | 243.24 | 243.065 | 193.845 | 195.147 |
| c | 172.757 | 171.130 | 172.363 | 174.302 | 173.094 | 240.323 | 241.065 |
| α=γ=90°; β= (°) | 93.68 | 92.478 | 93.71 | 93.29 | 93.65 | 127.22 | 127.09 |
| Resolution (Å) | 40 - 2.85 (2.95 - 2.85) | 50 - 4.4 (4.56 - 4.4) | 45 - 3.0 (3.1 - 3.0) | 57 - 2.9 (3.0 - 2.9) | 35 - 3.0 (3.1 - 3.0) | 50 - 3.1 (3.2 - 3.1) | 60 - 4.0 (4.14 - 4.0) |
| Rmerge | 0.113 (>1) | 0.325 (>1) | 0.239 (>1) | 0.189 (>1) | 0.242 (>1) | 0.187 (>1) | 0.236 (>1) |
| Rpim | 0.057 (0.68) | 0.106 (0.238) | 0.122 (0.95) | 0.091 (>1) | 0.131 (>1) | 0.108 (>1) | 0.262 (>1) |
| CC1/2 in outer shell | 0.80 | 0.80 | 0.35 | 0.41 | 0.49 | 0.13 | 0.20 |
| I/σI | 14.2 (1.1) | 7.5 (2.6) | 7.4 (0.8) | 6.9 (0.43) | 7.8 (0.67) | 6.8 (0.5) | 2.5 (0.47) |
| Completeness (%) | 100 (100) | 99.7 (98.2) | 100 (100) | 99.4 (98.9) | 99.4 (99.0) | 99.0 (99.5) | 99.9 (99.3) |
| Multiplicity | 6.8 (6.7) | 9.9 (7.6) | 13.4 (12.25) | 8.5 (8.1) | 18.3 (18.6) | 6.9 (6.9) | 5.4 (5.3) |
| Refinement | rigid body | ||||||
| Resolution (Å) | 40 - 2.85 (2.95 - 2.85) | 45 - 3.0 (3.1 - 3.0) | 57 - 2.9 (3.0 - 2.9) | 35 - 3.0 (3.1 - 3.0) | 50 - 3.1 (3.2 - 3.1) | 60 - 4.0 (4.14 - 4.0) | |
| No. of reflections | 188162 (18682) | 161270 (16047) | 177017 (15887) | 160053 (15157) | 211664 (20620) | 102001 (9644) | |
| No. atoms | 31125 | 31125 | 30780 | 30780 | 61554 | 61554 | |
| Ligands | 400 | 400 | 55 | 55 | 110 | 110 | |
| Water | 10 | 10 | 10 | 10 | 20 | 20 | |
| Rwork | 0.217 (0.361) | 0.242 (0.383) | 0.234 (0.433) | 0.236 (0.401) | 0.240 (0.376) | 0.277 (0.354) | |
| Rfree | 0.234 (0.377) | 0.255 (0.388) | 0.254 (0.452) | 0.254 (0.415) | 0.261 (0.377) | 0.293 (0.384) | |
| B-factors (Å2) | 102.3 | 94.7 | 105.9 | 105.9 | 117.1 | 105.70 | |
| Protein | 102.0 | 94.5 | 106.0 | 106.0 | 117.2 | 105.80 | |
| Ligands | 129.4 | 104.5 | 92.7 | 92.7 | 95.4 | 84.50 | |
| Water | 67.5 | 53.9 | 71.3 | 71.3 | 96.5 | 94.30 | |
| Ramachandran (%) | |||||||
| Favored | 95 | 95 | 93 | 94 | 95 | 95 | |
| Outliers | 0.4 | 0.3 | 0.6 | 0.5 | 0.3 | 0.3 | |
| R.m.s. deviations | |||||||
| Bond lengths (Å) | 0.003 | 0.003 | 0.003 | 0.003 | 0.003 | 0.007 | |
| Bond angles (°) | 0.93 | 0.82 | 0.86 | 0.74 | 0.76 | 0.93 | |
Supplementary Material
Acknowledgments
We acknowledge the staff at beamlines X25 and X29 of the National Synchrotron Light Source, beamline 24-ID-C of the Advanced Photon Source, and F. Weis-Garcia and the Monoclonal Antibody Facility at MSKCC. We thank C. Lima, M. Long, N. Pavletich, V. Ruta and members of the laboratory for helpful discussions. S.B.L. is a recipient of a Burroughs Wellcome Career Award in the Biomedical Sciences. Atomic coordinates and structure factors have been deposited in the protein data bank (PDB ID: 4RDQ).
Footnotes
Author Contributions All authors contributed to project design and performed experiments. V.K.D. and S.B.L. determined structures. S.B.L. wrote the manuscript with contributions from the other authors.
Competing interests. The authors declare no competing interests.
References
- 1.Hartzell C, Putzier I, Arreola J. Calcium-activated chloride channels. Annual review of physiology. 2005;67:719–758. doi: 10.1146/annurev.physiol.67.032003.154341. [DOI] [PubMed] [Google Scholar]
- 2.Caputo A, Caci E, Ferrera L, Pedemonte N, Barsanti C, Sondo E, Pfeffer U, Ravazzolo R, Zegarra-Moran O, Galietta LJV. TMEM16A, a membrane protein associated with calcium-dependent chloride channel activity. Science (New York, NY) 2008;322:590–594. doi: 10.1126/science.1163518. [DOI] [PubMed] [Google Scholar]
- 3.Schroeder BC, Cheng T, Jan YN, Jan LY. Expression cloning of TMEM16A as a calcium-activated chloride channel subunit. Cell. 2008;134:1019–1029. doi: 10.1016/j.cell.2008.09.003. [DOI] [PMC free article] [PubMed] [Google Scholar]
- 4.Yang Y, Cho H, Koo J, Tak M, Cho Y, Shim W, Park S, Lee J, Lee B, Kim B, Raouf R, Shin Y, Oh U. TMEM16A confers receptor-activated calcium-dependent chloride conductance. Nature. 2008 doi: 10.1038/nature07313. [DOI] [PubMed] [Google Scholar]
- 5.Sun H, Tsunenari T, Yau KW, Nathans J. The vitelliform macular dystrophy protein defines a new family of chloride channels. Proceedings of the National Academy of Sciences of the United States of America. 2002;99:4008–4013. doi: 10.1073/pnas.052692999. [DOI] [PMC free article] [PubMed] [Google Scholar]
- 6.Tsunenari T, Nathans J, Yau KW. Ca2+-activated Cl- current from human bestrophin-4 in excised membrane patches. The Journal of general physiology. 2006;127:749–754. doi: 10.1085/jgp.200609527. [DOI] [PMC free article] [PubMed] [Google Scholar]
- 7.Hartzell HC, Qu Z, Yu K, Xiao Q, Chien LT. Molecular physiology of bestrophins: multifunctional membrane proteins linked to best disease and other retinopathies. Physiological reviews. 2008;88:639–672. doi: 10.1152/physrev.00022.2007. [DOI] [PubMed] [Google Scholar]
- 8.Kunzelmann K, Kongsuphol P, Chootip K, Toledo C, Martins JR, Almaca J, Tian Y, Witzgall R, Ousingsawat J, Schreiber R. Role of the Ca2+ -activated Cl- channels bestrophin and anoctamin in epithelial cells. Biological chemistry. 2011;392:125–134. doi: 10.1515/BC.2011.010. [DOI] [PubMed] [Google Scholar]
- 9.Gomez NM, Tamm ER, Straubeta O. Role of bestrophin-1 in store-operated calcium entry in retinal pigment epithelium. Pflugers Archiv: European journal of physiology. 2013;465:481–495. doi: 10.1007/s00424-012-1181-0. [DOI] [PubMed] [Google Scholar]
- 10.Tsunenari T, Sun H, Williams J, Cahill H, Smallwood P, Yau KW, Nathans J. Structure-function analysis of the bestrophin family of anion channels. The Journal of Biological Chemistry. 2003;278:41114–41125. doi: 10.1074/jbc.M306150200. [DOI] [PMC free article] [PubMed] [Google Scholar]
- 11.Qu Z, Fischmeister R, Hartzell C. Mouse bestrophin-2 is a bona fide Cl(-) channel: identification of a residue important in anion binding and conduction. The Journal of general physiology. 2004;123:327–340. doi: 10.1085/jgp.200409031. [DOI] [PMC free article] [PubMed] [Google Scholar]
- 12.Chien LT, Zhang ZR, Hartzell HC. Single Cl- channels activated by Ca2+ in Drosophila S2 cells are mediated by bestrophins. The Journal of general physiology. 2006;128:247–259. doi: 10.1085/jgp.200609581. [DOI] [PMC free article] [PubMed] [Google Scholar]
- 13.Xiao Q, Prussia A, Yu K, Cui Yy, Hartzell HC. Regulation of bestrophin Cl channels by calcium: role of the C terminus. The Journal of general physiology. 2008;132:681–692. doi: 10.1085/jgp.200810056. [DOI] [PMC free article] [PubMed] [Google Scholar]
- 14.Marquardt A, Stohr H, Passmore LA, Kramer F, Rivera A, Weber BH. Mutations in a novel gene, VMD2, encoding a protein of unknown properties cause juvenile-onset vitelliform macular dystrophy (Best's disease) Human molecular genetics. 1998;7:1517–1525. doi: 10.1093/hmg/7.9.1517. [DOI] [PubMed] [Google Scholar]
- 15.Petrukhin K, Koisti MJ, Bakall B, Li W, Xie G, Marknell T, Sandgren O, Forsman K, Holmgren G, Andreasson S, Vujic M, Bergen AA, McGarty-Dugan V, Figueroa D, Austin CP, Metzker ML, Caskey CT, Wadelius C. Identification of the gene responsible for Best macular dystrophy. Nat Genet. 1998;19:241–247. doi: 10.1038/915. [DOI] [PubMed] [Google Scholar]
- 16.Davidson AE, Millar ID, Urquhart JE, Burgess-Mullan R, Shweikh Y, Parry N, Sullivan JO, Maher GJ, McKibbin M, Downes SM, Lotery AJ, Jacobson SG, Brown PD, Black GCM, Manson FDC. Missense Mutations in a Retinal Pigment Epithelium Protein, Bestrophin-1, Cause Retinitis Pigmentosa. The American Journal of Human Genetics. 2009;85:581–592. doi: 10.1016/j.ajhg.2009.09.015. [DOI] [PMC free article] [PubMed] [Google Scholar]
- 17.Boon CJ, Klevering BJ, Leroy BP, Hoyng CB, Keunen JE, den Hollander AI. The spectrum of ocular phenotypes caused by mutations in the BEST1 gene. Prog Retin Eye Res. 2009;28:187–205. doi: 10.1016/j.preteyeres.2009.04.002. [DOI] [PubMed] [Google Scholar]
- 18.Xiao Q, Hartzell HC, Yu K. Bestrophins and retinopathies. Pflügers Archiv - European Journal of Physiology. 2010;460:559–569. doi: 10.1007/s00424-010-0821-5. [DOI] [PMC free article] [PubMed] [Google Scholar]
- 19.Kinnick TR, Mullins RF, Dev S, Leys M, Mackey DA, Kay CN, Lam BL, Fishman GA, Traboulsi E, Iezzi R, Stone EM. Autosomal recessive vitelliform macular dystrophy in a large cohort of vitelliform macular dystrophy patients. Retina (Philadelphia, Pa) 2011;31:581–595. doi: 10.1097/IAE.0b013e318203ee60. [DOI] [PubMed] [Google Scholar]
- 20.Wittstrom E, Ponjavic V, Bondeson ML, Andreasson S. Anterior segment abnormalities and angle-closure glaucoma in a family with a mutation in the BEST1 gene and Best vitelliform macular dystrophy. Ophthalmic genetics. 2011;32:217–227. doi: 10.3109/13816810.2011.567884. [DOI] [PubMed] [Google Scholar]
- 21.Yu K, Cui Y, Hartzell HC. The bestrophin mutation A243V, linked to adult-onset vitelliform macular dystrophy, impairs its chloride channel function. Investigative ophthalmology & visual science. 2006;47:4956–4961. doi: 10.1167/iovs.06-0524. [DOI] [PubMed] [Google Scholar]
- 22.Yu K, Qu Z, Cui Y, Hartzell HC. Chloride channel activity of bestrophin mutants associated with mild or late-onset macular degeneration. Investigative ophthalmology & visual science. 2007;48:4694–4705. doi: 10.1167/iovs.07-0301. [DOI] [PubMed] [Google Scholar]
- 23.Marchant D, Yu K, Bigot K, Roche O, Germain A, Bonneau D, Drouin-Garraud V, Schorderet DF, Munier F, Schmidt D, Le Neindre P, Marsac C, Menasche M, Dufier JL, Fischmeister R, Hartzell C, Abitbol M. New VMD2 gene mutations identified in patients affected by Best vitelliform macular dystrophy. Journal of medical genetics. 2007;44:e70. doi: 10.1136/jmg.2006.044511. [DOI] [PMC free article] [PubMed] [Google Scholar]
- 24.Milenkovic VM, Röhrl E, Weber BHF, Strauss O. Disease-associated missense mutations in bestrophin-1 affect cellular trafficking and anion conductance. 2011 doi: 10.1242/jcs.085878. [DOI] [PubMed] [Google Scholar]
- 25.Bharill S, Fu Z, Palty R, Isacoff EY. Stoichiometry and specific assembly of Best ion channels. Proceedings of the National Academy of Sciences. 2014 doi: 10.1073/pnas.1400248111. [DOI] [PMC free article] [PubMed] [Google Scholar]
- 26.Qu ZQ, Yu K, Cui Yy, Ying C, Hartzell HC. Activation of bestrophin Cl- channels is regulated by C-terminal domains. The Journal of Biological Chemistry. 2007;282:17460–17467. doi: 10.1074/jbc.M701043200. [DOI] [PubMed] [Google Scholar]
- 27.Kranjc A, Grillo FW, Rievaj J, Boccaccio A, Pietrucci F, Menini A, Carloni P, Anselmi C. Regulation of bestrophins by Ca2+: a theoretical and experimental study. PLoS One. 2009;4:e4672. doi: 10.1371/journal.pone.0004672. [DOI] [PMC free article] [PubMed] [Google Scholar]
- 28.Qu Z, Hartzell HC. Bestrophin Cl- channels are highly permeable to HCO3- American journal of physiology Cell physiology. 2008;294:C1371–1377. doi: 10.1152/ajpcell.00398.2007. [DOI] [PMC free article] [PubMed] [Google Scholar]
- 29.Stotz SC, Clapham DE. Anion-sensitive fluorophore identifies the Drosophila swell-activated chloride channel in a genome-wide RNA interference screen. PloS one. 2012;7:e46865. doi: 10.1371/journal.pone.0046865. [DOI] [PMC free article] [PubMed] [Google Scholar]
- 30.Lee S, Yoon BE, Berglund K, Oh SJ, Park H, Shin HS, Augustine GJ, Lee CJ. Channel-Mediated Tonic GABA Release from Glia. Science (New York, NY) 2010 doi: 10.1126/science.1184334. [DOI] [PubMed] [Google Scholar]
- 31.Woo DH, Han KS, Shim JW, Yoon BE, Kim E, Bae JY, Oh SJ, Hwang EM, Marmorstein AD, Bae YC, Park JY, Lee CJ. TREK-1 and Best1 channels mediate fast and slow glutamate release in astrocytes upon GPCR activation. Cell. 2012;151:25–40. doi: 10.1016/j.cell.2012.09.005. [DOI] [PubMed] [Google Scholar]
- 32.O'Driscoll KE, Leblanc N, Hatton WJ, Britton FC. Functional properties of murine bestrophin 1 channel. Biochemical and Biophysical Research Communications. 2009;384:476–481. doi: 10.1016/j.bbrc.2009.05.008. [DOI] [PMC free article] [PubMed] [Google Scholar]
- 33.Qu Z, Hartzell C. Determinants of anion permeation in the second transmembrane domain of the mouse bestrophin-2 chloride channel. The Journal of general physiology. 2004;124:371–382. doi: 10.1085/jgp.200409108. [DOI] [PMC free article] [PubMed] [Google Scholar]
- 34.Qu Z, Chien LT, Cui Y, Hartzell HC. The anion-selective pore of the bestrophins, a family of chloride channels associated with retinal degeneration. The Journal of neuroscience: the official journal of the Society for Neuroscience. 2006;26:5411–5419. doi: 10.1523/JNEUROSCI.5500-05.2006. [DOI] [PMC free article] [PubMed] [Google Scholar]
- 35.Gifford JL, Walsh MP, Vogel HJ. Structures and metal-ion-binding properties of the Ca2+-binding helix-loop-helix EF-hand motifs. The Biochemical journal. 2007;405:199–221. doi: 10.1042/BJ20070255. [DOI] [PubMed] [Google Scholar]
- 36.Yuan P, Leonetti MD, Hsiung Y, MacKinnon R. Open structure of the Ca2+ gating ring in the high-conductance Ca2+-activated K+ channel. Nature. 2012;481:94–97. doi: 10.1038/nature10670. [DOI] [PMC free article] [PubMed] [Google Scholar]
- 37.Dutzler R, Campbell EB, Cadene M, Chait BT, MacKinnon R. X-ray structure of a ClC chloride channel at 3.0 A reveals the molecular basis of anion selectivity. Nature. 2002;415:287–294. doi: 10.1038/415287a. [DOI] [PubMed] [Google Scholar]
- 38.Hibbs RE, Gouaux E. Principles of activation and permeation in an anion-selective Cys-loop receptor. Nature. 2011;474:54–60. doi: 10.1038/nature10139. [DOI] [PMC free article] [PubMed] [Google Scholar]
- 39.Hille B. Ionic channels of excitable membranes. 2nd edn. Sinauer Associates; 1992. [Google Scholar]
- 40.Dougherty DA. Cation-pi interactions in chemistry and biology: a new view of benzene, Phe, Tyr, and Trp. Science. 1996;271:163–168. doi: 10.1126/science.271.5246.163. [DOI] [PubMed] [Google Scholar]
- 41.Jackson MR, Beahm R, Duvvuru S, Narasimhan C, Wu J, Wang HN, Philip VM, Hinde RJ, Howell EE. A preference for edgewise interactions between aromatic rings and carboxylate anions: the biological relevance of anion-quadrupole interactions. The Journal of Physical Chemistry B. 2007;111:8242–8249. doi: 10.1021/jp0661995. [DOI] [PubMed] [Google Scholar]
- 42.Philip V, Harris J, Adams R, Nguyen D, Spiers J, Baudry J, Howell EE, Hinde RJ. A survey of aspartate-phenylalanine and glutamate-phenylalanine interactions in the protein data bank: searching for anion-π pairs. Biochemistry. 2011;50:2939–2950. doi: 10.1021/bi200066k. [DOI] [PubMed] [Google Scholar]
- 43.Thomas KA, Smith GM, Thomas TB, Feldmann RJ. Electronic distributions within protein phenylalanine aromatic rings are reflected by the three-dimensional oxygen atom environments. Proceedings of the National Academy of Sciences of the United States of America. 1982;79:4843–4847. doi: 10.1073/pnas.79.16.4843. [DOI] [PMC free article] [PubMed] [Google Scholar]
- 44.Kawate T, Gouaux E. Fluorescence-detection size-exclusion chromatography for precrystallization screening of integral membrane proteins. Structure (London, England: 1993) 2006;14:673–681. doi: 10.1016/j.str.2006.01.013. [DOI] [PubMed] [Google Scholar]
- 45.Kilmartin JV, Wright B, Milstein C. Rat monoclonal antitubulin antibodies derived by using a new nonsecreting rat cell line. The Journal of Cell Biology. 1982;93:576–582. doi: 10.1083/jcb.93.3.576. [DOI] [PMC free article] [PubMed] [Google Scholar]
- 46.Long SB, Campbell EB, MacKinnon R. Crystal structure of a mammalian voltage-dependent Shaker family K+ channel. Science (New York, NY) 2005;309:897–903. doi: 10.1126/science.1116269. [DOI] [PubMed] [Google Scholar]
- 47.Bricogne G, Vonrhein C, Flensburg C, Schiltz M, Paciorek W. Generation, representation and flow of phase information in structure determination: recent developments in and around SHARP 2.0. Acta crystallographica Section D, Biological crystallography. 2003;59:2023–2030. doi: 10.1107/s0907444903017694. [DOI] [PubMed] [Google Scholar]
- 48.Minor W, Cymborowski M, Otwinowski Z, Chruszcz M. HKL-3000: the integration of data reduction and structure solution--from diffraction images to an initial model in minutes. Acta crystallographica Section D, Biological crystallography. 2006;62:859–866. doi: 10.1107/S0907444906019949. [DOI] [PubMed] [Google Scholar]
- 49.Karplus PA, Diederichs K. Linking crystallographic model and data quality. Science (New York, NY) 2012;336:1030–1033. doi: 10.1126/science.1218231. [DOI] [PMC free article] [PubMed] [Google Scholar]
- 50.Cowtan KD. ‘dm’: An automated procedure for phase improvement by density modification. Joint CCP4 and ESF-EACBM Newsletter on Protein Crystallography. 1994;31:34–38. [Google Scholar]
- 51.Emsley P, Lohkamp B, Scott WG, Cowtan K. Features and development of Coot. Acta crystallographica Section D, Biological crystallography. 2010;66:486–501. doi: 10.1107/S0907444910007493. [DOI] [PMC free article] [PubMed] [Google Scholar]
- 52.Brunger AT. Version 1.2 of the Crystallography and NMR system. Nat Protoc. 2007;2:2728–2733. doi: 10.1038/nprot.2007.406. [DOI] [PubMed] [Google Scholar]
- 53.Adams PD, Afonine PV, Bunkóczi G, Chen VB, Davis IW, Echols N, Headd JJ, Hung LW, Kapral GJ, Grosse-Kunstleve RW, McCoy AJ, Moriarty NW, Oeffner R, Read RJ, Richardson DC, Richardson JS, Terwilliger TC, Zwart PH. PHENIX: a comprehensive Python-based system for macromolecular structure solution. Acta Cryst. 2010;D66:213–221. doi: 10.1107/S0907444909052925. [DOI] [PMC free article] [PubMed] [Google Scholar]
- 54.Murshudov GN, Skubak P, Lebedev AA, Pannu NS, Steiner RA, Nicholls RA, Winn MD, Long F, Vagin AA. REFMAC5 for the refinement of macromolecular crystal structures. Acta crystallographica Section D, Biological crystallography. 2011;67:355–367. doi: 10.1107/S0907444911001314. [DOI] [PMC free article] [PubMed] [Google Scholar]
- 55.Chen VB, Arendall WB, 3rd, Headd JJ, Keedy DA, Immormino RM, Kapral GJ, Murray LW, Richardson JS, Richardson DC. MolProbity : all-atom structure validation for macromolecular crystallography. Acta crystallographica Section D, Biological crystallography. 2010;66:12–21. doi: 10.1107/S0907444909042073. [DOI] [PMC free article] [PubMed] [Google Scholar]
- 56.Konecny R, Baker NA, McCammon JA. iAPBS: a programming interface to Adaptive Poisson-Boltzmann Solver (APBS) Computational science & discovery. 2012;5 doi: 10.1088/1749-4699/5/1/015005. [DOI] [PMC free article] [PubMed] [Google Scholar]
- 57.Smart OS, Neduvelil JG, Wang X, Wallace BA, Sansom MS. HOLE: a program for the analysis of the pore dimensions of ion channel structural models. J Mol Graph. 1996;14:354–360. 376. doi: 10.1016/s0263-7855(97)00009-x. [DOI] [PubMed] [Google Scholar]
- 58.Miller AN, Long SB. Crystal structure of the human two-pore domain potassium channel K2P1. Science (New York, NY) 2012;335:432–436. doi: 10.1126/science.1213274. [DOI] [PubMed] [Google Scholar]
- 59.Hou X, Pedi L, Diver MM, Long SB. Crystal structure of the calcium release-activated calcium channel Orai. Science (New York, NY) 2012;338:1308–1313. doi: 10.1126/science.1228757. [DOI] [PMC free article] [PubMed] [Google Scholar]
- 60.Lee SY, Letts JA, MacKinnon R. Functional reconstitution of purified human Hv1 H+ channels. Journal of Molecular Biology. 2009;387:1055–1060. doi: 10.1016/j.jmb.2009.02.034. [DOI] [PMC free article] [PubMed] [Google Scholar]
- 61.Tsien R, Pozzan T. Measurement of cytosolic free Ca2+ with quin2. Methods Enzymol. 1989;172:230–262. doi: 10.1016/s0076-6879(89)72017-6. [DOI] [PubMed] [Google Scholar]
- 62.Schoenmakers TJ, Visser GJ, Flik G, Theuvenet AP. CHELATOR: an improved method for computing metal ion concentrations in physiological solutions. Biotechniques. 1992;12:870–874. 876–879. [PubMed] [Google Scholar]
- 63.Ulbrich MH, Isacoff EY. Subunit counting in membrane-bound proteins. Nat Methods. 2007;4:319–321. doi: 10.1038/NMETH1024. [DOI] [PMC free article] [PubMed] [Google Scholar]
- 64.Hines KE. Inferring subunit stoichiometry from single molecule photobleaching. J Gen Physiol. 2013;141:737–746. doi: 10.1085/jgp.201310988. [DOI] [PMC free article] [PubMed] [Google Scholar]
- 65.Park H, Oh SJ, Han KS, Woo DH, Park H, Mannaioni G, Traynelis SF, Lee CJ. Bestrophin-1 encodes for the Ca2+-activated anion channel in hippocampal astrocytes. The Journal of neuroscience: the official journal of the Society for Neuroscience. 2009;29:13063–13073. doi: 10.1523/JNEUROSCI.3193-09.2009. [DOI] [PMC free article] [PubMed] [Google Scholar]
- 66.Qu Z, Cui Y, Hartzell C. A short motif in the C-terminus of mouse bestrophin 4 inhibits its activation as a Cl channel. FEBS letters. 2006;580:2141–2146. doi: 10.1016/j.febslet.2006.03.025. [DOI] [PubMed] [Google Scholar]
- 67.Xiao Q, Yu K, Cui Yy, Hartzell HC. Dysregulation of human bestrophin-1 by ceramide-induced dephosphorylation. The Journal of Physiology. 2009;587:4379–4391. doi: 10.1113/jphysiol.2009.176800. [DOI] [PMC free article] [PubMed] [Google Scholar]
- 68.Barro-Soria R, Aldehni F, Almaca J, Witzgall R, Schreiber R, Kunzelmann K. ER-localized bestrophin 1 activates Ca2+-dependent ion channels TMEM16A and SK4 possibly by acting as a counterion channel. Pflugers Archiv: European journal of physiology. 2010;459:485–497. doi: 10.1007/s00424-009-0745-0. [DOI] [PubMed] [Google Scholar]
- 69.Duran C, Chien LT, Hartzell HC. Drosophila Bestrophin-1 Currents Are Regulated by Phosphorylation via a CaMKII Dependent Mechanism. PloS one. 2013;8:e58875. doi: 10.1371/journal.pone.0058875. [DOI] [PMC free article] [PubMed] [Google Scholar]
- 70.Chien LT, Hartzell HC. Rescue of volume-regulated anion current by bestrophin mutants with altered charge selectivity. The Journal of general physiology. 2008;132:537–546. doi: 10.1085/jgp.200810065. [DOI] [PMC free article] [PubMed] [Google Scholar]
Associated Data
This section collects any data citations, data availability statements, or supplementary materials included in this article.