

Abstract
Rodents consume water by performing stereotypic, rhythmic licking movements which are believed to be controlled by brainstem pattern-generating circuits. Previous work has shown that synchronized population activity of inferior olive neurons was phase locked to the licking rhythm in rats, suggesting a cerebellar involvement in temporal aspects of licking behavior. However, what role the cerebellum has in licking behavior and whether licking is represented in the high frequency simple spike output of Purkinje cells remains unknown. We recorded Purkinje cell simple and complex spike activity in awake mice during licking and determined the behavioral consequences of loss of cerebellar function. Mouse cerebellar cortex contained a multifaceted representation of licking behavior encoded in the simple spike activities of Purkinje cells distributed across Crus I, Crus II and lobus simplex of the right cerebellar hemisphere. Lick-related Purkinje cell simple spike activity was modulated rhythmically, phase-locked to the lick rhythm, or non-rhythmically. A subpopulation of lick-related Purkinje cells differentially represented lick interval duration in their simple spike activity. Surgical removal of the cerebellum or temporary pharmacological inactivation of the cerebellar nuclei significantly slowed the licking frequency. Fluid licking was also less efficient in mice with impaired cerebellar function, indicated by a significant decline in the volume per lick fluid intake. The gross licking movement appeared unaffected. Our results suggest a cerebellar role in modulating the frequency of the central pattern generating circuits controlling fluid licking and in the fine coordination of licking, while contributing little to the coordination of the gross licking movement.
Keywords: Cerebellum, Central pattern generator, Behavior, Brainstem, Drinking, Extracellular recordings, Motor control
Introduction
Fluid licking in rats and mice is a highly stereotyped movement involving rhythmic protrusions and retractions of the tongue, and opening and closing of the jaw. Licking constitutes an ideal behavioral paradigm for the study of motor control as it is a readily quantifiable and natural behavior in rodents. Evidence from physiological and anatomical studies suggests that licking movements are generated by central pattern-generating (CPG) circuits located in the brainstem (Brozek et al 96a; Travers et al 97c; Nakamura et al 04). These circuits are likely to receive modulatory inputs from supramedullary structures (Travers et al 97b). Evidence for supramedullary control of licking was first seen in lesion studies in rats which demonstrated impaired licking behavior after lesions in the frontal cortex (Whishaw and Kolb 83). Furthermore, licking-like movements can be elicited in anesthetized rabbits through electrical microstimulation of the frontal cortex (Liu et al 93). Electrophysiological recordings in rats revealed an extended representation of licking in the lateral striatum (Mittler et al 94) and in the olivo-cerebellar system (Welsh et al 95; Lang et al 99). Welsh et al. recorded complex spike activity in cerebellar Purkinje cells and showed that different populations of Purkinje cells synchronized their Complex spike firing during different phases of the lick rhythm. Complex spikes are a defining characteristic of Purkinje cell activity (Thach 68) and reflect climbing fiber input from the inferior olive (Palay and Chan-Palay 74). Based on these findings Welsh and colleagues suggested that the olivo-cerebellar system would be essential for controlling the timing of licks (Welsh et al 95). In a later study aimed at investigating the role of the cerebellum in the coordination of forepaw lever pressing with licking movements, (Vajnerova et al 00) inactivated the cerebellar nuclei and found a 10% increase in the average duration of inter-lick- intervals. This suggests a role of the cerebellum in modulating the licking rhythm. It is unknown whether and how the main cerebellar output, the Purkinje cell simple spikes, represents licking behavior and particularly the timing of licks of or duration of inter-lick intervals. Complex spikes have been suggested to represent precisely timed “teaching signals” to the cerebellum (Marr 69; Albus 71) which are responsible for shaping the behavior related simple spike outputs of Purkinje cells in cerebellar dependent forms of motor learning (Raymond et al 96; Mauk and Buonomano 04; Catz et al 05). Here we asked how the rhythmic fluid licking behavior is represented in the Purkinje cell simple spike activity of the mouse cerebellum and how loss of cerebellar function affects fluid licking behavior.
We used extracellular electrophysiological recording techniques in awake, head-restrained mice to record Purkinje cell simple spike and complex spike activity during fluid licking behavior in mice of the common strain C57BL/6J (B6) (Hayar et al 06; Bryant et al 09). The effect of loss of cerebellar function on licking behavior was tested in mice with permanent and temporary forms of cerebellar ataxia.
Materials and Methods
Animals
We performed three different types of experiments (electrophysiology, surgical removal, and pharmacological inactivation of the cerebellum) with three independent groups of mice. Animals were housed in a temperature controlled vivarium under a 12:12 h light/dark cycle. Five adult male C57BL/6J (B6) mice (Jackson Laboratories, Bar Harbor, ME) were used for electrophysiological experiments. Cerebellectomies were performed on 7 B6 mice at age P14 and their licking was compared to 7 age-matched controls after reaching maturity (>8 weeks). Finally, partial pharmacological inactivation of the cerebellar nuclei through injection of muscimol was performed on 9 mice. All mice had ad libitum access to food at all times. Access to water was controlled for the mice used for electrophysiological recordings but unlimited for all other mice.
Water restriction in the electrophysiology group was necessary to ensure that the mice would perform fluid licking behavior during the recording sessions. Water was removed from the cages 12 hours prior to the first of 5 consecutive days of recording sessions. During the 5 experimental days, all daily water was consumed during the experiments and during a 15 minute period with free access to water following each experimental session. If the body weight of a mouse fell below 90% of its initial weight, measured before restricted access, water intake was supplemented with 10 additional minutes of free access to water following recording sessions. All experiments adhered to procedural guidelines approved by the University of Tennessee Health Science Center Animal Care and Use Committee.
Surgery
A detailed description of the surgical and experimental procedures has been published previously (Hayar et al 06; Bryant et al 09). Anesthesia was induced with 3% isoflurane (Baxter Pharmaceutical Products, Deerfield IL) and maintained during surgery with 0.5%–1.5% isoflurane using an Ohio Isoflurane vaporizer (Highland Medical Equipment, CA). Body temperature was maintained between 36.5 and 38.0°C with a feedback controlled heating pad (FHC Inc, Bowdoinham, ME). Standard surgical techniques were used to secure 3 or 4 small machine screws in the skull (1/8′ dome head, 0.8 mm diameter, 2 mm long, Small Parts, Inc, Miami Lakes, FL) and to perform a craniotomy exposing Crus I and Crus II of the right cerebellar hemisphere. The exposed dura was covered with triple antibiotic ointment (Walgreens, US) to help keep the dura moist and reduce the risk of infection. A cylindrical plastic chamber (0.45 cm diameter and 8 mm height) was fashioned from a drinking straw, treated with 100% ETOH, and placed over the skull opening. After it was securely mounted the chamber was filled with triple antibiotic ointment. A stereotaxic manipulator was used to place a custom-made head post (3 × 3 mm, 16 mm high) in a stereotaxically defined position relative to Bregma. The chamber and head post were secured into place with dental acrylic (Teets methyl methacrylate denture material; CoOral-Lite Mfg. Co., Diamond Springs, CA, USA). Following surgery the mice were injected with 8 mg/kg Torbugesic (Fort Dodge, USA) to alleviate pain and with 0.5 ml of lactated ringer solution (s.c.) as a fluid supplement. A 4–5 day post-surgical recovery period was observed before electrophysiological experiments would begin.
For cerebellectomies, mice at postnatal day 14 were anesthetized with i.p. injections of ketamine-xylazine (9–15 mg/kg). After suboccipital craniectomy, both cerebellar hemispheres and the vermis were ablated by subpial suction (LeDoux et al 93). The cavity was filled with sterile collagen hemostat, Avitene (Davol, USA). The incision was sutured and the animals were allowed to recover from surgery. The licking behaviors of cerebellectomized mice and age-matched controls were measured 6–12 weeks after the surgery. In a subset of mice we also measured the efficiency of fluid licking by estimating the amount of water taken in per each individual lick. This required counting the number of licks and measuring the total volume of water consumed. Water volume was determined by weighing the water bottles before and after the test. Volume per lick was determined by dividing the volume by the lick count. Measurements were taken over a period of at least 12 hours.
For muscimol injections into the cerebellar nuclei
All surgical procedures for this experiment were as described above for the electrophysiology experiments except that two craniotomies were performed to provide bilateral access to the interposed cerebellar nuclei. Openings were approximately 2mm in diameter and centered relative to Bregma at AP −6.1 mm and ± 2.1 mm lateral from midline. Openings were protected by cylindrical plastic chambers as described above but with a smaller diameter (3mm). After 4 days of recovery, the mice were head-fixed and a glass pipette tipped injector needle (thin-walled, 1mm O.D.) was lowered into the cerebellum. As the electrode was lowered into the brain, placement of the electrode tip in the cerebellar nuclei was guided neuronal signals recorded with the same tip. The correct location of injection sites was also verified anatomically by injecting a dye (India ink, Salis International Inc, USA) at the site. This data was collected in Spike2 (CED, UK). Once the pipette tip was lowered to the level of the deep cerebellar nuclei at about −2mm below the surface, 0.250 μl of muscimol (0.5 mg/μl) in saline or just the vehicle of physiological saline (0.9% NaCl) was injected into the tissue at a rate of 0.1 μl /min. We continued monitoring neuronal spike signals to track and confirm the inhibitory effect of muscimol on spiking activity. Upon completing the injection mice were transferred to their home cages where fluid licking behavior was continuously monitored for two hours post injection. The amount of water consumed was also measured for three of these animals as to determine the average volume per lick as a measure of licking efficiency.
Electrophysiology and behavior
Mice were weighed daily prior to experiments. All electrophysiological recordings occurred during the light cycle. For the recording sessions, the heads were immobilized by affixing the head posts with a set screw to a stationary metal head post clamp, which was mounted onto the table. The mouse’s body was loosely covered with a plastic half-tube (5 cm diameter, 10 cm long) to restrain body movements. The recording chamber was cleaned and filled with Ringer’s solution. Recording electrodes (glass insulated tungsten/platinum, 80 μm O.D., impedance: 2–12 MΩ) were advanced into the brain using a computer controlled micro drive (MiniMatrix, Thomas Recording, Germany). Purkinje cells were identified based on their location and firing characteristics such as the presence of complex spikes as well as sustained high frequency simple spike firing rates (> 20 Hz). The raw signals were filtered (300 Hz – 8 kHz) and amplified (total: 230×) using a filter-amplifier (FA32, Multichannel Systems, Germany). Filtered and amplified voltage signals were digitized and stored on a computer hard disk (16 bit A/D converter, sampling rate >20 kHz) using a CED power1401 and Spike2 software (both Cambridge Electronic Design, UK). After recording 1.5–5 minutes of spontaneous neuronal activity while the animal was alert but at rest, the metal water spout of the lickometer was manually positioned in front of the mouse’s mouth so that the mouse could easily reach the orifice with its tongue to lick water (a distance of ~2–4 mm). Licks were recorded in form of junction potentials created when the mouse touched the water spout with its tongue (Hayar et al 06). Water flow from the spout was controlled by applying positive pressure to the inside of the sealed water bottle using a 20 cc syringe, connected to the bottle via a silicone tube.
The water spout was presented for approximately 100 seconds or until a sufficient number of licks (~60–80 licks) was performed. Licking behavior and Purkinje cell spike activity were recorded simultaneously and stored in the same data file (Fig. 2 A). After a sufficient number of licks were performed, the water spout was manually removed or the water flow was interrupted to stop licking behavior. Recording of spontaneous spiking activity was continued for 1–5 minutes. Then, a new unit was sought by either advancing the electrode or by retracting it from the tissue and moving to a different site on the cerebellar hemisphere. Electrodes were never advanced beyond the second encounter of the Purkinje cell layer.
Figure 2.
Correlation between Purkinje cell spike activity and licking behavior.
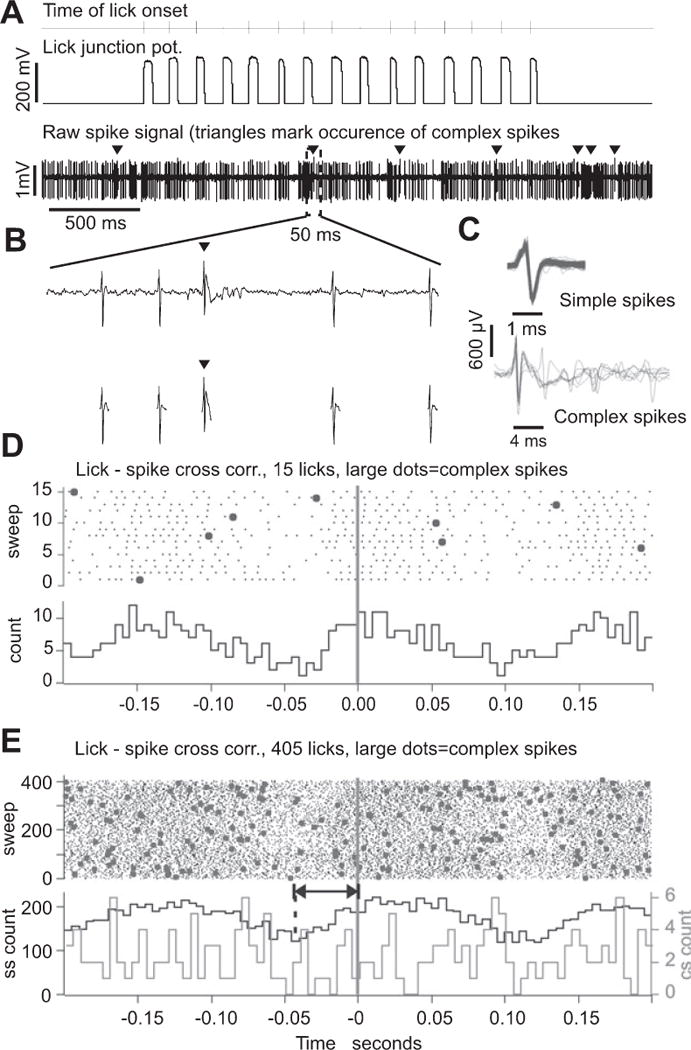
(A) Top trace: tick-marks show the times of lick onset, i.e. the time when the tongue touched the water spout. Middle trace: raw junction potential signals generated by 15 licks. Lower trace: simple and complex spike activity of a Purkinje cell recorded simultaneously with the licks. Arrowheads mark the occurrence of complex spikes. (B) Top trace: expansion of the raw spike signal containing four simple and one complex spike. Bottom trace: cutouts of simple and complex spikes after spike sorting based on differences in spike shapes. (C) Ten superimposed simple spikes (top) and ten superimposed complex spikes (bottom) from the data shown in (A) and (B). Voltage scale applies to both sets of traces, time scales are different. (D) Lick-spike cross correlation calculated for the burst of 15 licks and the segment spike activity shown in (A). Zero marks lick onset time, i.e. the time of tongue to spout contact. The large dots in the raster plots represent complex spikes. (E) Lick-spike cross correlation calculated for the same Purkinje cell but for >400 licks, including the 15 shown in (A). Bin width for both cross correlation histograms is 5 ms.
After completion of the recording session, the recording chamber was cleaned and filled with triple antibiotic ointment and mice were returned to their home cages. Animals participated in electrophysiological experiments for 2–6 weeks. During the last 2 or 3 experimental sessions 2–3 small electrolytic lesions (10 μA, 10 s) were set in stereotaxically defined locations using the Bregma-centered head post as a reference. The lesion sites were used as reference points to map recording sites onto cerebellar cortex. After completion of electrophysiological experiments, mice were transcardially perfused with a 3.7% formaldehyde fix. Following fixation, brains were cut into 40 μm coronal sections using a vibratome (Vibratome Series 3000 Plus, Vibratome, USA). Sections were mounted and stained with cresyl violet.
Mean inter-lick intervals of fluid licking behavior of cerebellectomized mice and an equal number of age-matched control B6 mice were measured while the mice were in their home cages using a custom lickometer modified from Hayar et al. (2006). After lick-behavioral testing, all lesioned animals were deeply anesthetized with tribromoethanol (0.7 mg/g) and transcardially perfused as described above. The extent of cerebellectomies was evaluated from cresyl violet-stained 40 μm-thick sections. Although some surgeries resulted in only partial ablation of the floccular complex, animals were still regarded as cerebellectomized because the deep cerebellar nuclei and cerebellar peduncles had been completely removed.
Data analysis
1) Licking behavior
The times of licks were marked when the ascending junction potential crossed a fixed voltage threshold (dashed line in Fig. 1A, lower trace). This corresponds to the time of tongue to waterspout contact. Licking behavior was characterized by the mean and standard deviation of the inter-lick interval (ILI) distribution. A lick burst may consist of a few to more than one hundred licks. Lick bursts were defined as uninterrupted trains of licks with no ILI longer than 500 ms. In order to determine whether changes in Purkinje cell activity precede or follow licks, the first licks of all bursts were marked (arrows in Fig. 1a) so that a correlation analysis of “first licks” or lick behavior onset with Purkinje cell spike activity could be performed.
Figure 1.
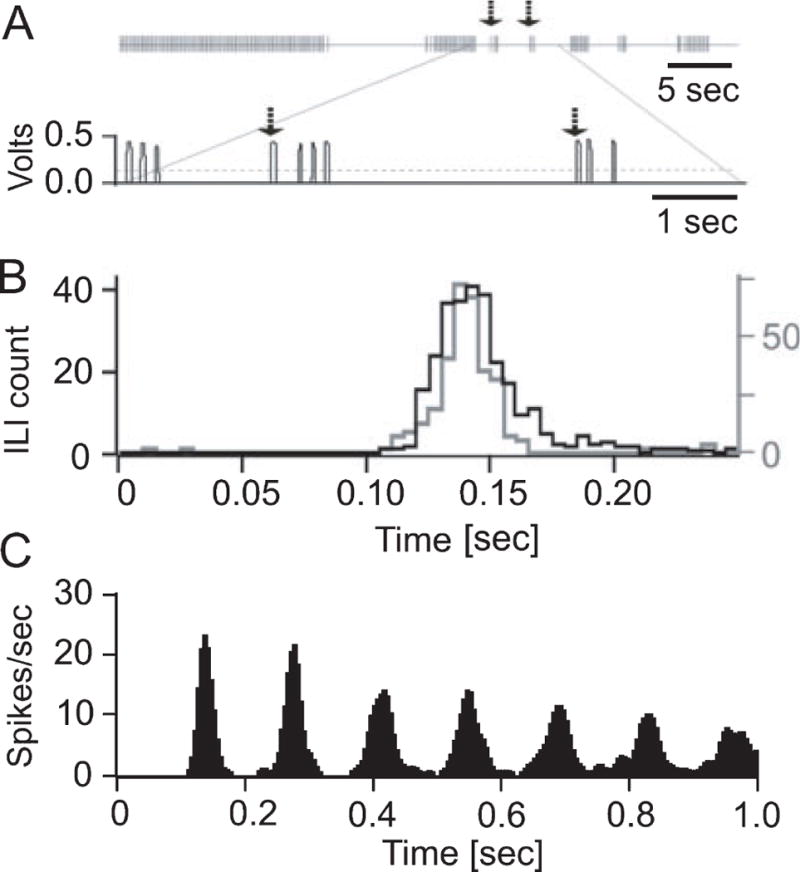
Temporal structure of licking behavior in mice. (A) A typical raw data example of mouse licking behavior recorded during head fixation. Each vertical line in the upper trace represents one lick. The lower trace shows the raw lick voltage signals corresponding to the area in the upper trace indicated by the lines. The dashed line indicates the voltage threshold used to detect lick times at the ascending slope of the voltage step, i.e. at the beginning of the tongue to waterspout contact. Typically mice licked in bursts of licks with the number of licks per burst being highly variable. The upper row in Fig. 1 shows 7 lick bursts. In the lower trace the last few licks of the second burst and the short 3rd and 4th bursts are shown Arrows in the upper and lower trace mark the onsets of 3rd and 4th lick bursts. (B) Inter-lick interval distributions of licking behavior recorded prior to surgery (black histogram) and during a typical experimental session (gray histogram) involving head fixation and recording of neuronal activity. The two distributions are nearly identical, demonstrating that head fixation did not affect the licking rhythm. (C) The autocorrelation analysis of the licking behavior shown in (A) exhibits multiple equidistant side peaks, indicative of a highly regular lick rhythm.
To verify that licking frequency was not altered by the head-fixed experimental conditions for electrophysiological recordings, we measured the licking frequency of two mice before surgery and during performance of an experiment. The ILI distributions under both conditions were almost identical (Fig. 1B) and the statistical comparison (student’s t-test) showed no significant difference.
All statistical comparisons were made using the Student’s T-test performed with either Origin 8 (OriginLab, Northampton, MA, USA) or SigmaStat (Systat, Chicago,IL, USA) software. For the analysis of differences in LII durations and variability (coefficient of variation) between experimental groups, the null hypothesis (H0:μ1 = μ2) assumed that there was no difference between group mean ILIs. For the mice subjected to pharmacological treatments, a paired T-test was used to compare licking characteristics before and after treatments. The alpha level used for these tests is p = 0.05.
2) Neuronal activity
Single-unit Purkinje cell simple and complex spikes were identified based on spike rates and shapes using the Spike2 software (CED, Cambridge, UK) (Fig. 2 B,C). The correlations of simple and complex spikes with licking behavior were analyzed separately using cross-correlation analysis (Spike2 and NeuroExplorer software from Nex Technologies, Littleton, MA) (Fig. 2 D,E). Single-unit spike activity was characterized by 1) simple-spike amplitudes exceeding 6 standard deviations (SD) of the baseline signal voltage distribution measured during brief epochs without spikes and 2) by the presence of a refractory period of at least 2 ms as determined from the inter-spike interval distribution. If either of these criteria were not met, data were categorized as multi-unit activity. Occasionally movement artifacts occurred which compromised the careful analysis of spike activity, resulting in the exclusion of the data from further analysis.
For each recording site the baseline spike rate (mean +/− SD) was obtained from the 100 second time window immediately preceding the onset of licking behavior. Average spike activity during licking was obtained from 10–30 s periods of uninterrupted licking. Cross-correlation analysis, using lick times as the temporal aligns, was performed to determine if Purkinje cell spike activity was modulated during licking (Spike2 software, CED, UK). The variability of a baseline-spike-lick correlation under the null-hypothesis that spikes and licks were independent trains of events was estimated from correlations of lick-event trains with spike trains recorded during resting periods. Peak and trough amplitudes of the raw correlation histograms were measured in multiples of the thus obtained standard deviation values. In order to determine whether spike activity changes followed or preceded licking movements we performed a separate analysis in which we correlated Purkinje cell simple spike activity only with the “first licks” of lick bursts. This way, changes in the spike activity preceding the lick event could not have been related to a preceding lick.
Finally, we determined if the duration of inter lick intervals was represented in the simple spike firing rates of Purkinje cells. For this analysis we converted the spike trains to continuous rate functions by calculating the number of spikes around each sampling point (+/− 20 ms) weighted by a Gaussian with a standard deviation of 3 ms. The 20–30 shortest and longest inter-lick intervals within the ILI distribution were identified and the interval onsets (i.e. tongue to water spout contact time of the first lick) were used as temporal aligns for the calculation of the average rate trajectories. Average rate trajectories were calculated for a 40 millisecond time window starting 10 milliseconds prior to interval onset.
3) Classification of Purkinje cell firing patterns
We identified three major types of Purkinje cells based on their firing patterns during licking behavior. These types were defined as follows: 1) lick-related rhythmically firing, 2) lick-related nonrhythmically firing and 3) non lick-related cells. Rhythmically firing units were further subdivided into strongly and weakly modulated rhythmical units. A unit was classified as strongly lick-related if a peak or trough in the lick-spike cross correlation histogram (expressed in spikes/sec) deviated from the correlation mean by at least one standard deviation (SD) (Fig. 3 A,B). Units were classified as weakly lick-related if the modulation of spike activity remained below the 1 SD thresholds and if the lick-spike cross correlation showed at least 3 peaks with inter-peak intervals matching the mean inter-lick interval (Fig. 3D). Units which had neither correlation peaks nor troughs exceeding 1 SD nor fitted the classification for “weakly modulated” were classified as non lick-related (Fig. 3C).
Figure 3.
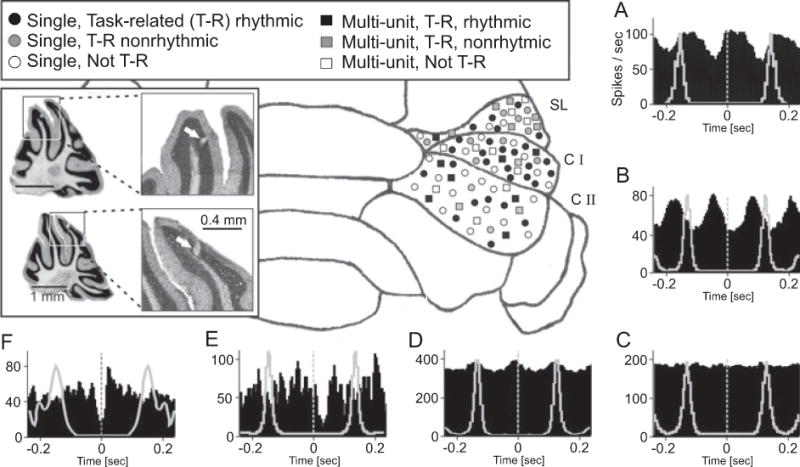
Neuronal representation of licking behavior in the cerebellar hemisphere. Summary of electrophysiological results showing recording locations and classifications of Purkinje cell activity recorded during licking behavior.
(A–F) Cross-correlation analysis (black histograms) of simple spike and licking behavior revealed different classes of Purkinje cells defined by different temporal relationships between Purkinje cell activity and licking. To illustrate the phase relationship between spike modulation and lick rhythm the autocorrelogram of the licking behavior is plotted with gray lines in each correlation histogram. The neuronal activity recorded during licking was categorized as described in details in the main text. Examples show are: (A) Lick-related, rhythmically modulated single unit; (B) Lick-related, rhythmically modulated multi-unit recording; (C) Not lick-related, Multi-unit; (D) Lick-related, weakly modulated rhythmic multi-unit; (E) Nonrhythmic, lick-related multi-unit; and (F) Nonrhythmic, lick-related single-unit. The symbols in the schematic map of the cerebellar cortex represent the different response types described in the legend and indicate the approximate recording site. The inset shows photomicrographs of Nissl stained 50 μm sagittal slices with electrolytic lesions marking recording sites. Top: lesion in the simple lobule, Bottom: lesion in Crus I. Bin width in all histograms is 5 ms. Histograms were smoothed with a 3 point Gaussian. SL= Simple Lobule, CI = Crus I lobule, CII = Crus II lobule.
As a quantitative measure for the phase relationship between rhythmic simple spike rate modulations and rhythmic licking behavior, delays between the lick onsets and the peaks or troughs of the spike-lick cross-correlograms were measured. We determined the delays between the temporal align (time zero = lick onset) and the nearest minimum and maximum in the cross correlation histogram. Minima and maxima occurring before or after lick onset were assigned negative and positive delays respectively. The probability distribution of maxima and minima was plotted in histogram form.
Results
Licking behavior
Different strains of mice have different strain specific lick frequencies which vary little with environmental conditions (Horowitz et al 77b; Smith et al 01; Boughter et al 07). In our study, adult B6 mice licked at an average inter-lick interval of 125.2 ± 12 ms, corresponding to an average rate of 8 ± 0.6 Hz (mean ± SD) (Fig. 1). Several pronounced side peaks in the autocorrelation histogram (Fig. 1C) revealed the temporal precision of the licking rhythm. The lick rates observed in this study were concordant with previously published lick rates for B6 mice (8 +/− 0.4 Hz, mean +/− SD) (Horowitz et al 77a; Boughter et al 07). Multiple pronounced side peaks in the autocorrelation histogram (Fig. 1C) revealed the temporal precision of the licking rhythm.
Figure 1 B shows the inter-lick intervals of the same mouse before surgical placement of head post and recording chamber (black histogram, mean ILI 139 ms) and under head fixed experimental conditions (gray histogram, mean ILI 146 ms). When averaging across all mice (n = 5) we calculated a mean lick rate of 8.0± 0.3 Hz (mean ± SD) before surgery and of 7.4 ± 0.6 Hz during electrophysiological recording sessions. This difference was not statistically significant (t4=2.0, P= 0.12, paired Student’s t-test).
We used extracellular recording techniques to monitor Purkinje cell spiking activity in the cerebellar cortex of five B6 mice during fluid licking (Fig. 2). Mice started to lick as soon as the water spout was brought within reach of the tongue (about 2–4 mm from the mouth) and licked several hundred times during a single recording session. If a Purkinje cell had lick related simple spike activity the correlation between spike activity and licking was evident even for as few as 15 licks (Fig 2D). We did not find correlations between single unit complex spike activity and licking behavior (Large dots in Fig. 2D, E).
Spatial distribution of lick-related Purkinje cells
Purkinje cell activity was recorded from 72 different recording sites, all located within crus I, crus II and lobus simplex of the right cerebellar hemisphere (Fig. 3). The Purkinje cell layer was identified first by the presence of high frequency spiking activity after moving the electrode tip through the “quiet” molecular or granule layer and second by the occurrence of complex spikes. Single unit Purkinje cells were isolated whenever possible. The location of recordings sites was mapped relative to Bregma (Fig. 3, inset) and verified through electrolytic lesion. Mapping the recording locations of all cells onto a schematic drawing of the cerebellar cortex revealed that neurons of all categories were widely distributed and intermingled with nonlick-related cells (Fig. 3). There was no apparent topographical organization of behavior related response patterns.
A total of 52 single-units were isolated and the remaining spike trains (n = 27) were analyzed as multi-unit signals. Multi-unit responses were used to map the representation of licks in the cerebellar cortex but were not analyzed further. Purkinje cell responses were divided into three different categories based on behavior related changes in simple spike activity: 1) lick-related rhythmically firing (single unit: n = 24, Fig. 3A, multi unit: n = 8, Fig. 3B), 2) lick-related nonrhythmically firing (single unit: n = 8, Fig. 3F, multi unit: n = 9, Fig. 3E) and 3) nonlick-related (single unit: n = 20 Fig. 3C, multi unit: n = 10). Of the lick-related rhythmically firing single units, 6 were classified as weakly modulated, based on the fact that their rhythmic rate modulation was within 1 SD of the baseline correlation. Five of 8 multiunit recordings were weakly modulated with lick-related, rhythmic firing (Fig. 3D). To illustrate the individual phase relationship between rhythmic simple spike modulation and licking behavior, the autocorrelation histograms of the licking behavior were calculated and plotted as gray line graphs on top of the corresponding lick-spike cross correlations in Fig. 3. The photomicrographs in Fig. 3 show examples of cresyl violet-stained cerebellar sections with stereotaxically identified lesions set at recording sites.
Behavior-related changes in baseline firing rate
To investigate whether Purkinje cells changed their average level of spike activity during licking behavior or whether spike rates were instead modulated around a stable mean firing rate, we compared the average firing rates of single-unit Purkinje cells before and during licking. Purkinje cells were either grouped by their location in one of the three lobules (Fig. 4 A–C) or by their type of lick related spike activity (Fig. 4 D–F). There were no significant changes in the mean firing rates between rest and licking behavioral conditions differences between pre- and during- behavior baseline firing rates in any of the groups (Student’s t-test). The average firing rates of nonrhythmic lick-related units did slightly decrease during licking behavior as compared to pre-licking activity (Fig. 4 E) but this difference was not statistically significant.
Figure 4.
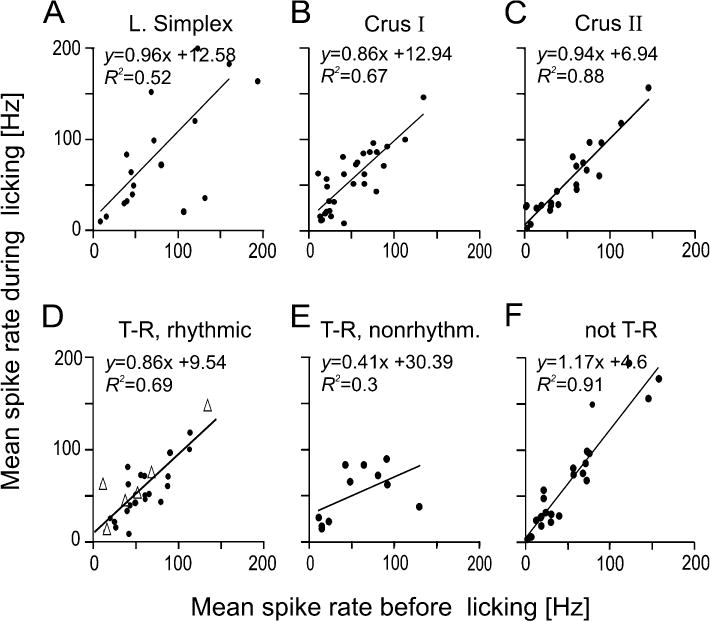
Scatter plots comparing the base line simple spike rates of single unit Purkinje cells before and during licking behavior. (A–C) Comparison by lobule. The top row of scatter plots display a comparison of spike rates before and during licking for single units segregated by the lobule in which each unit was recorded. The equation from the linear regression analysis and the coefficient of determination is shown for each data set. While no region displayed a significant difference between firing rates before and during licking, Purkinje cells in Crus II displayed the least variability in firing rate. (D–F) Comparison by response type. Single unit firing rates before and during licking for different response types: (D) Lick-related, rhythmic single units showed no change in firing rates among those with a strong rhythmic firing pattern (black dots) and those that were weakly correlated (white triangles). (E) Lick-related, nonrhythmic single units displayed the most variance between firing rates before and during licking. (F) Nonlick-related units showed no change to firing rates before and during licking.
Rhythmically firing units
The fact that the lick-spike cross-correlations of lick-related rhythmically firing units had multiple peaks at delays, which were multiples of the mean inter-lick interval, indicates that rate modulations were phase locked with the lick rhythm. To evaluate whether there were preferred phase relationships between the lick rhythm and the rhythmic modulations of Purkinje cell spike activity, we determined the temporal relationships between spike rate minima and maxima and lick onset times for all rhythmically firing single units. The resulting histograms in Fig. 5 A, B show that spike rate minima (Fig. 5A) and maxima (Fig. 5B) typically occur near lick onset, with no bias of occurrence before or after lick onsets. Each Purkinje cell had its own individual, but stable phase relationship with the licking rhythm (see also Figs. 3A, B). To determine the temporal relationship between lick related changes in Purkinje cells simple spike activity and an individual lick we performed the lick-spike cross correlation analysis using only the occasionally occurring single licks and the first licks of all lick burst (Fig. 5C–D) as temporal aligns. In about 50% of Purkinje cells rate minima occurred before the tongue to spout contact and in the other 50% rate minima occurred afterwards (Fig. 5C). For rate maxima, however, we found a larger number of cells with maxima occurring after the tongue to spout contact (Fig. 5D).
Figure 5.
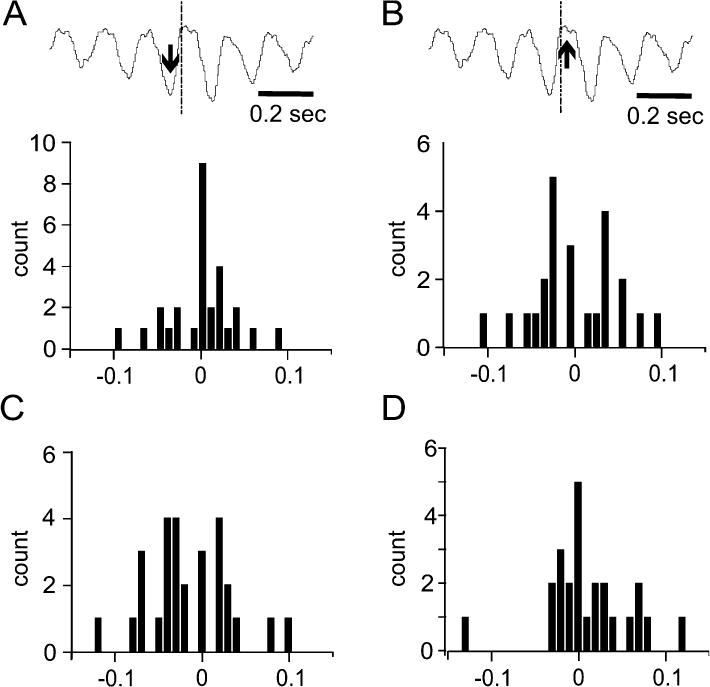
Phase relationship between single unit spike activity and licking across all licks (A,B) and for the first licks of each lick bust only (C,D). The delays between spike rate minima and maxima and lick onset times were measured as described in the method section and as shown in the example cross correlogram plotted above the two histograms in (A) and (B). Vertical lines in the example correlogram indicate time zero, i.e. the time of tongue to waterspout contact. Arrows point to the minimum (A) and maximum (B) nearest to time zero. (A), Temporal relationship of spike rate minima and licking expressed in a probability distribution of delays between rate minima and time of tongue to water spout contact. In the example the nearest-to-zero firing rate minimum (down arrow) occurred at −0.045 seconds. (B) As in (A) but for spike rate maxima. In the example the nearest-to-zero firing rate maximum (up arrow) occurred at 0.018 seconds. (C) Temporal relationship of spike rate minima with first licks or single licks only expressed in a probability distribution of delays between rate minima and time of tongue to water spout contact. (D) As in (C) but for spike rate maxima. Bin width: 10 ms.
Weakly-modulated units showed rhythmic lick-related simple spike rate modulations similar to those observed in strongly modulated rhythmically firing units, except for the fact that the rate modulations did not exceed 1 SD of the baseline rate variability. As with strongly modulated units, the mean firing rates of weakly modulated units did not significantly change during licking behavior compared to rest (Fig. 4D, white triangles). As was the case for strongly modulated rhythmically firing units, there was no preferred phase relationship for weakly modulated units with licking behavior.
Lick-related nonrhythmically firing units
Our analysis shows that 8 out of 52 single units (15%) and 9 out of 27 multi unit signals (33%) were nonrhythmically lick-related. The lick-spike cross-correlation analysis showed lick-related reductions in simple spike rate in 4 single units, rate increases in 2 single units and triphasic rate modulation in 2 single units. Triphasic rate modulation consisted of a rate increase followed by a decrease and then another increase. One unit completed this pattern of activity change within the 30 ms prior to tongue to waterspout contact while the other began an increase in firing rate 15 ms prior to tongue contact and completed the triphasic pattern within 10 ms after the tongue to waterspout contact.
Nonlick-related units
Out of 52 recorded single units, 20 were classified as not lick-related (38%). Nonlick-related units were found interspersed between lick-related cells.
Spatial distribution of lick-related activity
Lick-related and non lick-related cells were spatially distributed in an apparently random manner (Fig. 3). There was no indication of a spatial clustering or somatotopical organization of different types of lick related Purkinje cells comparable to the fractured representation of orofacial sensory inputs previously described for the rat (Shambes et al 78).
Neuronal representation of inter-lick interval duration
Although the mean ILI is very stable for individual animals, closer examinations have revealed that systematic variations in the duration of individual ILIs are behaviorally highly relevant. For example, swallowing movements have been shown to occur during longer than average ILIs (Weijnen et al 84), presumably to provide the additional time needed to complete the swallowing movement before the next lick occurs. In order to determine whether the cerebellum might be involved in controlling this temporal aspect of the licking behavior we asked if lick related Purkinje cell simple spike activity represented ILI duration. We separated and compared the average simple spike responses of rhythmically firing units during the longest and shortest inter-lick intervals performed during a recording session (see methods). In 13 out of 28 rhythmically firing Purkinje cells information about interval duration was represented in the simple spike rate changes based on differences between their average rate trajectories for long and short ILIs. These duration-encoding units typically showed a rapid increase in simple spike rate at the beginning of a lick interval followed by a slower decrease. The time course of the rate decrease differed between short and long ILIs. During short ILIs the rate decreased faster and reached a rate minimum earlier than during long ILIs (Fig. 6 A, B).
Figure 6.
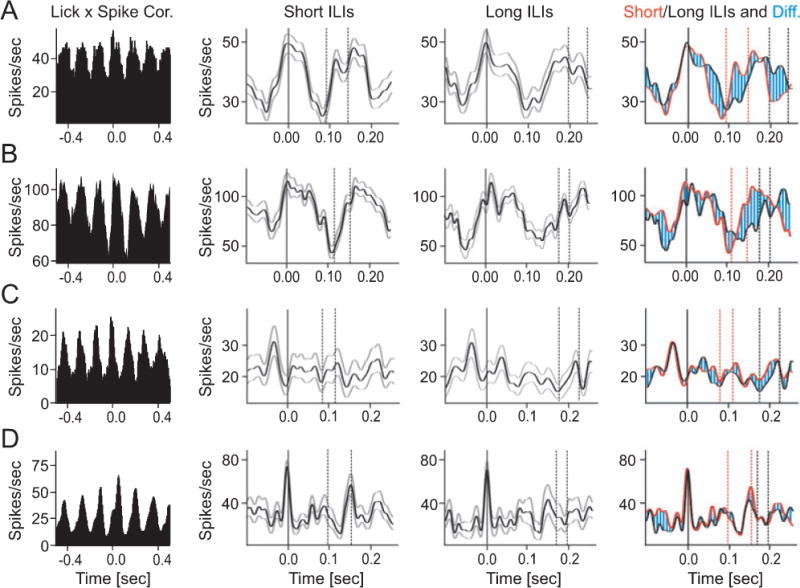
Inter-lick interval duration is represented in Purkinje cell simple spike activity. The average firing rates of four rhythmically modulated lick-related Purkinje cells (A–D) were calculated separately for the 30 shortest and 30 longest inter-lick intervals (ILIs) in the data set. The histograms in the left column show the lick-spike correlations (all licks included) for the four units. The center two columns show average spike rate trajectories (black curves) recorded during short (center left) and long (center right) ILIs. Gray curves mark +/− one standard deviation. Solid vertical lines in each histogram mark the times of tongue to water spout contact, dashed vertical lines delimit the time intervals within which the next tongue contact occurred. The right-most column shows an overlay of the data in the two center columns with responses during short ILIs shown in red, responses during long ILIs shown in black and the difference hatched in blue. The time course of the spikes rates of units (A) and (B) were different during long and short ILIs. Spike rate minima and maxima occurring earlier during short ILIs than during long ILIs. Units (C) and (D) generated similar spike rate patterns during long and short ILIs. All of the cross correlations contained 5 ms bins that were smoothed with a 3-point Gaussian function.
A second group (8 of 24) of rhythmically firing cells showed long lasting rate modulations which were identical for long and short ILIs (Fig. 6C). A third group (7 out of 24) generated brief increases in simple spike activity around the time of contact between the tongue and the water spout (25%). Those rate increases were the same for long and short intervals (Fig. 6D).
Licking behavior in cerebellectomized mice
The spontaneous licking behavior (i.e. without prior water deprivation) of the 7 cerebellectomized mice and age-matched controls was measured in the home cage environment. Cerebellectomized mice had a significantly slower licking rhythm than the control animals with an average inter-lick interval duration in cerebellectomized mice of 141 ± 6 ms (mean ± S.D) and in wild-type mice of 122 ± 5 ms (Fig. 7). The data passed the equal variance test (P=0.871) and normality test (P=0.616) and the difference was found to be significant (t11=−7.06, P=1.313 ×10⁻⁵) (Student’s t-test). As a measure of the movement efficiency we evaluated the average volume of water taken in per individual lick for all of these mice. The statistical analysis applied to the volume-per-lick measurement was as described above for ILI analysis. In cerebellectomized mice water intake per lick was 0.95 ± 0.1 μL compared to 1.4 ± 0.2 μL per lick (t8=−5.324, p= 4.0 × 10⁻⁴) in healthy controls.
Figure 7.
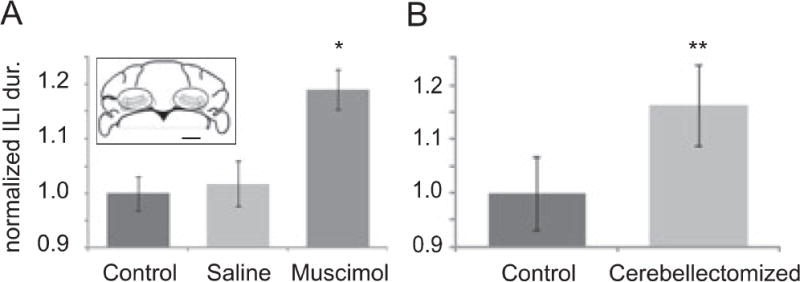
Loss of cerebellar function significantly slows the licking rhythm. (A) Average lick interval durations increase significantly following bilateral microinjections of muscimol into the cerebellar nuclei compared to pre-treatment values and to control conditions involving bilateral injections of saline (n = 9). ILI values are normalized to the pre-treatment values. Error bars depict standard error and the asterisk statistical significance at P < 0.05. The inset shows a line drawing of a coronal section of the mouse cerebellum at 6 mm posterior to bregma, where injections into the cerebellar nuclei were made. Ovals outline the approximate regions targeted by the bilateral injections of muscimol. The small bar in the lower right corner represents 1 mm. B) Average inter lick interval duration of mice that were cerebellectomized at postnatal day 14 (n = 7) and of healthy litter mates (n = 7) Cerebellectomized mice had longer inter lick intervals and thus a slower lick rhythm than normal mice (P < 0.05, Student’s t-test). ILI values are normalized to average ILI of healthy or untreated mice in A and B.
Licking behavior in acutely ataxic mice
The partial and transient inactivation of the cerebellar output through microinjections of muscimol into the cerebellar nuclei also resulted in a significant slowing of the licking rhythm. Prior to any experimental intervention, these mice (n = 9) had an average ILI duration of 105. ± 7 ms. Following an injection of muscimol into the cerebellar nuclei the average ILI duration increased significantly to 125 ± 9 ms (t16=5.3, p = 0.001, paired Student’s t-test). Mice injected with the vehicle (saline) had average post injection ILI durations of 106 ± 13 ms, which was not significantly different (t16 = 0.20, p=0.84) from pre-treatment durations (Fig. 7B). The average volume of water consumed per individual lick was measured in 3 animals. Consistent with our findings in cerebellectomized mice, blocking cerebellar nuclei activity fluid licking efficiency by reducing the fluid intake volume per lick. Muscimol treated animals consumed 0.94± 0.1 μL per lick whereas the same mice consumed 1.2 ± 0.2μL per lick prior to microinjection (t2= 5.0, p=0.038 with a paired t-test). When these mice were subjected to a saline microinjection, they consumed an average of 1.3 ± 0.3 μL per lick. The difference in volume per lick between saline injection and untreated conditions was not significant.
Discussion
In a series of multi-electrode experiments in awake and behaving rats Welsh and colleagues (1995) showed that population complex spike activity in the cerebellum was phase-locked to the rhythm of fluid licking behavior. Even though complex spikes reflect an input signal arriving from the inferior olive and contribute little to the cerebellar spike output, these findings clearly showed a cerebellar involvement in licking behavior. Welsh et al suggested that the olivo-cerebellar system was crucially involved in the generation of the lick-motor rhythm. This proposed role that was consistent with the longstanding view of the cerebellum as a timing and motor control device (Braitenberg 67; Ivry et al 88) but was never experimentally tested. Here we investigated the role of the cerebellum in rhythmic fluid licking by addressing two key questions: 1) How is fluid licking behavior represented in neuronal output signals of the cerebellar cortex, i.e. the high frequency simple spike activity of Purkinje cells? 2) How does loss of cerebellar function affect fluid licking behavior? Electrophysiological recordings of cerebellar cortical output activity, i.e. Purkinje cell spikes, in awake and behaving mice revealed a dynamic representation of fluid licking behavior by a large and widely distributed population of Purkinje cells. A subset of these lick related Purkinje cells differentially represented the duration of inter-lick intervals, consistent with a cerebellar involvement in controlling the licking rhythm. Loss of cerebellar function, either permanent of temporary, significantly slowed, but did not eliminate the licking rhythm. Moreover, the gross licking movement seemed unaffected in ataxic mice.
Electrophysiological results
Welsh et al (1995) had shown that climbing fiber inputs to the cerebellar cortex originating in the inferior olive generated widely distributed patterns of correlated complex spike activity that was phase locked with the fluid licking rhythm in rats. Complex spikes occur at low frequencies (~1 Hz) they contribute very little to the main spike output from the cerebellar cortex, which consists of Purkinje cell simple spikes with average firing rates (in our experiments) ranging from around 10 to 200 Hz. Instantaneous control of behavioral outcome, particularly of a fast rhythmic movement such as licking, is more likely to depend on the modulation of simple spike rather than complex spike activity. Complex spikes have been implicated in cerebellar dependent forms of motor learning by shaping behavior related simple spike activity through long term depression of the excitatory inputs to Purkinje cells (Boyden et al 04). It is thus possible that the phase locked lick related modulation of simple spike activity is at least partially caused by phase locked population climbing fiber inputs. The fact that we did not observe a correlation between complex spikes and licking does not contradict this view, since it requires the observation of a larger population of cells to measure the phase locked population activity (see Welsh et al 95).
Mapping of all recording sites onto the cerebellar surface showed that licking behavior was represented in the simple spike activity of a large and widely distributed population of Purkinje cells in crus I, crus II and lobus simplex (Fig. 3). There was no obvious topographical organization or clustering of lick-related Purkinje cells in general, or of the two functionally distinct lick related groups of rhythmic and nonrhythmic cells. Instead, spatial distribution of rhythmic, non-rhythmic and non task-related Purkinje cells seemed random.
It is unclear to what extent the neuronal representation of licking behavior in the cerebellum is related to sensory feedback, motor commands, or a combination of both. In an initial attempt at addressing this question, we measured the timing of simple spike rate changes relative to the timing of tongue-to-waterspout contacts. The assumption was that a purely sensory driven neuronal signal would coincide with the movement, particularly with the sensory event of tongue-to-waterspout contact, whereas motor command related changes in neuronal activity would preferentially occur before the movement. The results of this analysis showed no general preference for simple spike rate changes to occur before or after tongue-to-waterspout contact (Fig. 5). Instead simple spike rate maxima and minima were about normally distributed around the moment of tongue-to-waterspout contact within a time window of ~240 ms (± 120 ms), with the possible exception of rate maxima when analyzing only the first licks in a burst (Fig. 5D).
The separate analysis of rate changes during short and long inter-lick-intervals revealed firing patterns in some Purkinje cells that consisted of very brief increases in firing rates coinciding with the time of tongue-to-waterspout contact (Fig. 6D). This form of lick-related activity was most consistent with a purely sensory representation of the tongue. Other cells had more complex spike rate patterns suggesting that they represented timing related aspects of the behavior. Particularly interesting were Purkinje cells with simple spike rate changes that differentiated between short and long inter-lick intervals. These cells could play an important role in modulating the lick rhythm and the loss of their function might explain the reduced lick frequency we observed in ataxic mice. We also investigated whether Purkinje cells showed a static change in baseline simple spike activity during licking behavior. By comparing average firing rates during rest and during licking we determined that baseline simple spike rates did not change during licking behavior. Regression line slopes of the scatter plots for firing rates during rest vs. behavior (Fig. 4) were close to one, with the exception of Lick-related, nonrhythmic single units which displayed the most variability in their firing rates but there was no clear trend towards increased or decreased rates during licking. Thus, the neuronal representation of licking behavior in Purkinje cells consisted of dynamic modulations of simple spike firing without changes in baseline firing rates. Cerebellar output activity in crus I,II and lobus simplex thus seems to be concerned with licking behavior on the time scale of individual licks and not in the general behavioral state of licking or fluid consumption.
While it is plausible to assume that rhythmically firing lick related cells were concerned with the behavior on a lick by lick basis, it is less clear what the function of non-rhythmic lick-related Purkinje cells (Fig. 3 F, E) might be. These cells seem to be involved in nonrhythmic events that occur during fluid licking and we propose that their activity is related to swallowing movements. Swallowing movements are known to be highly coordinated with fluid licking movements in rats. During licking fluid is accumulated in the oral cavity and swallowing occurs at irregular intervals every 6th to 8th lick (Weijnen et al 84). The nonrhythmic cross-correlations between simple spike activity and licking could reflect the activity of swallowing related Purkinje cells. Related to this might be the subset of Purkinje cells encoding ILI durations. These cells provide a potential neuronal substrate for a coordination of licking with swallowing or respiratory movements as their activity might be involved in delaying or accelerating the onset of the next pattern generator cycle.
Licking rhythm in ataxic mice
In order to understand the role of the cerebellum in fluid licking we measured licking behavior in mice with permanent and temporary loss of cerebellar function. We compared mice with permanent and temporary ataxia to control for potential compensatory effects from long term adaptation of cerebellectomized mice to loss of cerebellar function. Both the permanent removal of the cerebellum and the temporary block of cerebellar spike output resulted in a significant slowing of the licking frequency as previously seen with functional ablation in the rat (Vajnerova et al 00) further supporting a cerebellar role in modulating the licking frequency. The effect was slightly more severe in acutely ataxic mice (19% increase in ILI duration) compared to mice that were cerebellectomized at an early age (P14, 15% increase in ILI duration). This might be the result of compensatory mechanisms established over the lifetime of cerebellectomized mice which are not available to temporarily ataxic mice. The fact that the gross licking movement was not obviously altered in either form of ataxia is consistent with the notion that the licking movement is controlled by a brainstem central pattern generator (Nishijo and Norgren 91; Brozek et al 96b; Travers et al 97a) which would be responsible for generating the muscle activity pattern underlying the gross licking movement. However, our finding of a decrease in the average volume of fluid consumed with each lick shows that the cerebellum is involved in fine motor coordination to increase the efficiency of the licking movement.
A proposed functional explanation for the cerebellar involvement in fluid licking
We suggest that the cerebellum is involved in the temporal coordination of licking and swallowing movements. Both of those movements are also coordinated with respiration (Welzl and Bures 77; Weijnen et al 84; Uchida et al 94), a task which also might involve the cerebellum. Licking, swallowing, suckling, and breathing are all vitally important movements controlled by brainstem pattern generators (Nistri et al 06; Cifra et al 09; Barlow 09). Projections from the cerebellar nuclei to the brainstem, including the areas containing licking, swallowing, and respiratory pattern generating circuits (Asanuma et al 83; Teune et al 00) provide a possible anatomical substrate for a cerebellar coordination of brain stem pattern generators. In humans, an increase in cerebellar activity during swallowing movements has been demonstrated with functional magnetic resonance imaging (Suzuki et al 03) and difficulties in swallowing (dysphagia) are common in patients with cerebellar disease (Ramio-Torrentia et al 06). The fact that the larynx has a neuronal representation in the primate cerebellum (Lam and Ogura 52) is consistent with a proposed cerebellar involvement in swallowing movements.
The cerebellum does not seem to contribute to respiration under normal physiological circumstances. But neuroimaging studies in humans have shown that the cerebellum is strongly activated during respiratory challenges (Harper et al 98). Related findings from studies in rats have shown that the interposed and fastigial nuclei are involved in the regulation of respiratory frequency and in the generation of respiratory responses to hypercapnic challenges (Xu and Frazier 00; Xu and Frazier 02). Considering that the parts of the cerebellum linked to respiration are located more medially in the vermis and paravermis (Williams et al 86) and that our recordings were restricted to the cerebellar hemispheres, it is more likely that the nonrhythmic lick-related activity we observed was related to swallowing rather than to breathing movements.
In summary, based on the available anatomical, clinical, and animal-experimental evidence it is possible that the cerebellum performs a temporal modulation of the brainstem pattern generator activity with the overall goal to improve the coordination of respiratory with licking and swallowing movements. Given the vital need for such coordination it is likely that more than one neuronal mechanism is in place to perform this task. Removing the cerebellum significantly slowed the licking frequency but mice survived and did not any signs of repeated asphyxiation during fluid licking. Thus the slowing of the licking rhythm in ataxic mice may reflect a less effective, more time consuming coordination of brain stem pattern generators through compensatory neuronal mechanisms. The faster and more efficient coordination of brainstem pattern generators by the cerebellum would thus provide an evolutionary advantage as it reduces the vulnerable times spent drinking and improves the protection of the airways from asphyxiation. Even small improvements in these vital functions may add up to provide significant advantages over the course of evolution.
Acknowledgments
We would like to thank Dr. H. Kita for helpful comments on earlier versions of the manuscript. This work was supported by grants from the National Institute of Mental Health to DHH (5R01MH068433) and from the National Institute of Neurological Disorders and Stroke to MSL (5R01NS048458) and an award from the American Psychological Association’s Diversity Program in Neuroscience (APA Fellowship R079008117) to JLB. The content of this publication is solely the responsibility of the authors and do not necessarily represent the official views of the NIH.
Footnotes
Associate Editor: Scott Thompson
Reference List
- Albus JS. A theory of cerebellar function. Mathematical Biosci. 1971;10:25–61. [Google Scholar]
- Asanuma C, Thach WT, Jones EG. Brainstem and spinal projections of the deep cerebellar nuclei in the monkey, with observations on the brainstem projections of the dorsal column nuclei. Brain Res. 1983;286:299–322. doi: 10.1016/0165-0173(83)90017-6. [DOI] [PubMed] [Google Scholar]
- Barlow SM. Central pattern generation involved in oral and respiratory control for feeding in the term infant. Curr Opin Otolaryngol Head Neck Surg. 2009;17:187–193. doi: 10.1097/MOO.0b013e32832b312a. [DOI] [PMC free article] [PubMed] [Google Scholar]
- Boughter JD, Baird JD, Bryant JL, St John SJ, Heck DH. C57BL/6J and DBA/2J Mice Vary in Lick rate and Ingestive Microstructure. Genes, Brain and Behavior. 2007;6:619–627. doi: 10.1111/j.1601-183X.2006.00293.x. [DOI] [PubMed] [Google Scholar]
- Boyden ES, Katoh A, Raymond JL. Cerebellum-dependent learning: the role of multiple plasticity mechanisms. Annu Rev Neurosci. 2004;27:581–609. doi: 10.1146/annurev.neuro.27.070203.144238. [DOI] [PubMed] [Google Scholar]
- Braitenberg V. Is the Cerebellar Cortex a Biological Clock in the Millisecond Range? In: Fox CA, Snider RS, editors. Progress in Brain Research. Vol. 25. The Cerebellum. Elsevier; Amsterdam: 1967. pp. 334–346. [DOI] [PubMed] [Google Scholar]
- Brozek G, Zhuravin IA, Megirian D, Bures J. Localization of the central rhythm generator involved in spontaneous consummatory licking in rats: functional ablation and electrical brain stimulation studies. Proc Natl Acad Sci USA. 1996a;93:3325–3329. doi: 10.1073/pnas.93.8.3325. [DOI] [PMC free article] [PubMed] [Google Scholar]
- Brozek G, Zhuravin IA, Megirian D, Bures J. Localization of the central rhythm generator involved in spontaneous consummatory licking in rats: functional ablation and electrical brain stimulation studies. Proc Natl Acad Sci USA. 1996b;93:3325–3329. doi: 10.1073/pnas.93.8.3325. [DOI] [PMC free article] [PubMed] [Google Scholar]
- Bryant JL, Roy S, Heck DH. A technique for stereotaxic recordings of neuronal activity in awake, head-restrained mice. J Neurosci Methods. 2009;178:75. doi: 10.1016/j.jneumeth.2008.11.014. [DOI] [PMC free article] [PubMed] [Google Scholar]
- Catz N, Dicke PW, Thier P. Cerebellar complex spike firing is suitable to induce as well as to stabilize motor learning. Curr Biol. 2005;15:2179–2189. doi: 10.1016/j.cub.2005.11.037. [DOI] [PubMed] [Google Scholar]
- Cifra A, Nani F, Sharifullina E, Nistri A. A repertoire of rhythmic bursting produced by hypoglossal motoneurons in physiological and pathological conditions. Philos Trans R Soc Lond B Biol Sci. 2009;364:2493–2500. doi: 10.1098/rstb.2009.0071. [DOI] [PMC free article] [PubMed] [Google Scholar]
- Harper RM, Gozal D, Bandler R, Spriggs D, Lee J, Alger J. Regional brain activation in humans during respiratory and blood pressure challenges. Clin Exp Pharmacol Physiol. 1998;25:483–486. doi: 10.1111/j.1440-1681.1998.tb02240.x. [DOI] [PubMed] [Google Scholar]
- Hayar A, Bryant JL, Boughter JD, Heck DH. A low-cost solution to measure mouse licking in an electrophysiological setup with a standard analog-to-digital converter. J Neurosci Methods. 2006;2:203–207. doi: 10.1016/j.jneumeth.2005.10.023. [DOI] [PMC free article] [PubMed] [Google Scholar]
- Horowitz GP, Stephan FK, Smith JC, Whitney G. Genetic and environmental variability in lick rates of mice. Physiol Behav. 1977a;19:493–496. doi: 10.1016/0031-9384(77)90224-4. [DOI] [PubMed] [Google Scholar]
- Horowitz GP, Stephan FK, Smith JC, Whitney G. Genetic and environmental variability in lick rates of mice. Physiol Behav. 1977b;19:493–496. doi: 10.1016/0031-9384(77)90224-4. [DOI] [PubMed] [Google Scholar]
- Ivry RB, Keele SW, Diener HC. Dissociation of the lateral and medial cerebellum in movement timing and movement execution. Exp Brain Res. 1988;73:167–180. doi: 10.1007/BF00279670. [DOI] [PubMed] [Google Scholar]
- Lam RL, Ogura JH. An afferent representation of the larynx in the cerebellum. Laryngoscope. 1952;62:486–495. doi: 10.1288/00005537-195205000-00007. [DOI] [PubMed] [Google Scholar]
- Lang EJ, Sugihara I, Welsh JP, Llinas R. Patterns of spontaneous purkinje cell complex spike activity in the awake rat. J Neurosci. 1999;19:2728–2739. doi: 10.1523/JNEUROSCI.19-07-02728.1999. [DOI] [PMC free article] [PubMed] [Google Scholar]
- LeDoux MS, Lorden JF, Ervin JM. Cerebellectomy eliminates the motor syndrome of the genetically dystonic rat. Exp Neurol. 1993;120:302–310. doi: 10.1006/exnr.1993.1064. [DOI] [PubMed] [Google Scholar]
- Liu ZJ, Masuda Y, Inoue T, Fuchihata H, Sumida A, Takada K, Morimoto T. Coordination of cortically induced rhythmic jaw and tongue movements in the rabbit. J Neurophysiol. 1993;69:569–584. doi: 10.1152/jn.1993.69.2.569. [DOI] [PubMed] [Google Scholar]
- Marr D. A theory of cerebellar cortex. J Physiol (Lond) 1969;202:437–470. doi: 10.1113/jphysiol.1969.sp008820. [DOI] [PMC free article] [PubMed] [Google Scholar]
- Mauk MD, Buonomano DV. The neural basis of temporal processing. Annu Rev Neurosci. 2004;27:307–340. doi: 10.1146/annurev.neuro.27.070203.144247. [DOI] [PubMed] [Google Scholar]
- Mittler T, Cho J, Peoples LL, West MO. Representation of the body in the lateral striatum of the freely moving rat: single neurons related to licking. Exp Brain Res. 1994;98:163–167. doi: 10.1007/BF00229122. [DOI] [PubMed] [Google Scholar]
- Nakamura Y, Katakura N, Nakajima M, Liu J. Rhythm generation for food-ingestive movements. Prog Brain Res. 2004;143:97–103. doi: 10.1016/S0079-6123(03)43009-4. [DOI] [PubMed] [Google Scholar]
- Nishijo H, Norgren R. Parabrachial gustatory neural activity during licking by rats. J Neurophysiol. 1991;66:974–985. doi: 10.1152/jn.1991.66.3.974. [DOI] [PubMed] [Google Scholar]
- Nistri A, Ostroumov K, Sharifullina E, Taccola G. Tuning and playing a motor rhythm: how metabotropic glutamate receptors orchestrate generation of motor patterns in the mammalian central nervous system. J Physiol. 2006;572:323–334. doi: 10.1113/jphysiol.2005.100610. [DOI] [PMC free article] [PubMed] [Google Scholar]
- Palay SL, Chan-Palay V. Cerebellar Cortex Cytology and Organization. Springer; Berlin: 1974. [Google Scholar]
- Ramio-Torrentia L, Gomez E, Genis D. Swallowing in degenerative ataxias. J Neurol. 2006;253:875–881. doi: 10.1007/s00415-006-0122-2. [DOI] [PubMed] [Google Scholar]
- Raymond JL, Lisberger SG, Mauk MD. The Cerebellum: A Neuronal Learning Machine? Science. 1996;272:1126–1131. doi: 10.1126/science.272.5265.1126. [DOI] [PubMed] [Google Scholar]
- Shambes GM, Gibson JM, Welker W. Fractured somatotopy in granule cell tactile areas of rat cerebellar hemispheres revealed by micromapping. Brain Behav Evol. 1978;15:94–140. doi: 10.1159/000123774. [DOI] [PubMed] [Google Scholar]
- Smith BK, Volaufova J, West DB. Increased flavor preference and lick activity for sucrose and corn oil in SWR/J vs. AKR/J mice. Am J Physiol Regul Integr Comp Physiol. 2001;281:R596–R606. doi: 10.1152/ajpregu.2001.281.2.R596. [DOI] [PubMed] [Google Scholar]
- Suzuki M, Asada Y, Ito J, Hayashi K, Inoue H, Kitano H. Activation of cerebellum and basal ganglia on volitional swallowing detected by functional magnetic resonance imaging. Dysphagia. 2003;18:71–77. doi: 10.1007/s00455-002-0088-x. [DOI] [PubMed] [Google Scholar]
- Teune TM, van der BJ, van der MJ, Voogd J, Ruigrok TJ. Topography of cerebellar nuclear projections to the brain stem in the rat. Prog Brain Res. 2000;124:141–172. doi: 10.1016/S0079-6123(00)24014-4. [DOI] [PubMed] [Google Scholar]
- Thach WT. Discharge of cerebellar Purkinje and nuclear neurons during rapidly alternating arm movements in the monkey. J Neurophysiol. 1968;31:785–797. doi: 10.1152/jn.1968.31.5.785. [DOI] [PubMed] [Google Scholar]
- Travers JB, DiNardo LA, Karimnamazi H. Motor and premotor mechanisms of licking. Neurosci Biobehav Rev. 1997b;21:631–647. doi: 10.1016/s0149-7634(96)00045-0. [DOI] [PubMed] [Google Scholar]
- Travers JB, DiNardo LA, Karimnamazi H. Motor and premotor mechanisms of licking. Neurosci Biobehav Rev. 1997c;21:631–647. doi: 10.1016/s0149-7634(96)00045-0. [DOI] [PubMed] [Google Scholar]
- Travers JB, DiNardo LA, Karimnamazi H. Motor and premotor mechanisms of licking. Neurosci Biobehav Rev. 1997a;21:631–647. doi: 10.1016/s0149-7634(96)00045-0. [DOI] [PubMed] [Google Scholar]
- Uchida K, Yamada Y, Sato T. The coordination of rhythmical drinking behavior with swallowing in rabbits. Physiol Behav. 1994;55:795–801. doi: 10.1016/0031-9384(94)90062-0. [DOI] [PubMed] [Google Scholar]
- Vajnerova O, Zhuravin IA, Brozek G. Functional ablation of deep cerebellar nuclei temporarily impairs learned coordination of forepaw and tongue movements. Behav Brain Res. 2000;108:189–195. doi: 10.1016/s0166-4328(99)00147-3. [DOI] [PubMed] [Google Scholar]
- Weijnen JA, Wouters J, van Hest JM. Interaction between licking and swallowing in the drinking rat. Brain Behav Evol. 1984;25:117–127. doi: 10.1159/000118857. [DOI] [PubMed] [Google Scholar]
- Welsh JP, Lang EJ, Sugihara I, Llinás R. Dynamic organization of motor control within the olivocerebellar system. Nature. 1995;374:453–457. doi: 10.1038/374453a0. [DOI] [PubMed] [Google Scholar]
- Welzl H, Bures J. Lick-synchronized breathing in rats. Physiol Behav. 1977;18:751–753. doi: 10.1016/0031-9384(77)90079-8. [DOI] [PubMed] [Google Scholar]
- Whishaw IQ, Kolb B. “Stick out your tongue”: tongue protrusion in neocortex and hypothalamic damaged rats. Physiol Behav. 1983;30:471–480. doi: 10.1016/0031-9384(83)90154-3. [DOI] [PubMed] [Google Scholar]
- Williams JL, Robinson PJ, Lutherer LO. Inhibitory effects of cerebellar lesions on respiration in the spontaneously breathing, anesthetized cat. Brain Res. 1986;399:224–231. doi: 10.1016/0006-8993(86)91512-x. [DOI] [PubMed] [Google Scholar]
- Xu F, Frazier DT. Role of the cerebellar deep nuclei in respiratory modulation. Cerebellum. 2002;1:35–40. doi: 10.1080/147342202753203078. [DOI] [PubMed] [Google Scholar]
- Xu F, Frazier DT. Modulation of respiratory motor output by cerebellar deep nuclei in the rat. J Appl Physiol. 2000;89:996–1004. doi: 10.1152/jappl.2000.89.3.996. [DOI] [PubMed] [Google Scholar]