

Abstract
Aims
Familial drug abuse history has been shown to have an impact on cognitive development during adolescence. The present study examined the relationship between white matter volume and cognitive processing speed in adolescents with and without a familial substance abuse history.
Participants
The sample consisted of thirty-three female and male adolescents stratified by risk (family history positive, FH+) and low-risk (FH−) groups.
Measurements
Gray and white matter volumes were measured by segmenting magnetic resonance imaging (MRI) data. The neurocognitive test battery included tests that assessed processing speed, verbal ability and mental flexibility.
Findings
Information proceeding speed was examined as a function of WM volume and only weak support was found for a relationship between these variables (FH− females only). Age related differences in neuropsychological functioning were seen but did not differ by risk group status, although there was some evidence for an age by gender effect. Information processing speed (Digit Symbol and Stroop Word Color Naming) was significantly correlated with white matter volume, however this pattern was only observed in FH− females. Cognitive performance and tissue volumes did not differ significantly between risk groups.
Conclusions
Age related differences in neuropsychological functioning were seen that might, in larger samples, prove to be related to risk for substance abuse in adolescents who have not yet initiated drug use.
Keywords: Adolescence, brain volume, processing speed, family history, substance abuse
INTRODUCTION
Adolescence is a time notable for brain re-organization, with white and gray matter tissue volume each undergoing distinctly different patterns of maturation [1–4]. In general, white matter volume has been reported to increase during adolescence [3–7], although decreased white matter volume also has been reported during late adolescence [8]. Gray matter volume changes during childhood and adolescence have been shown to occur in a non-monotonic fashion, with rapid increases in gray matter volume occurring earlier in development, followed by a dramatic decrease in volume during late childhood and adolescence [2, 3]. Age-related alterations in white matter are thought to chiefly reflect myelination, whereas gray matter volume reductions are thought to reflect synaptic and dendritic pruning, but also cell death. Significant and rapid improvements in cognitive abilities during this age period are observed concurrently with structural reorganization of the adolescent brain [9–11], due in part to increased speed and efficiency of information processing [11]. Not surprisingly, there is substantial evidence for a relationship between structural brain development and improvements in cognitive function in adolescent cohorts [4, 12–14].
The onset of alcohol and illicit substance use also typically occurs during this period of critical brain development [15, 16]. The majority of brain imaging studies to date have documented structural and functional brain impairments in youth who have already begun using drugs or alcohol or who have an ongoing substance use disorder [17–19]. It is difficult to discern, however, whether such impairments are antecedent to the initiation of substance use or are the consequence of substance use during adolescent brain development. Although the available data are limited, two brain imaging studies have documented significant influences of a positive family history for substance abuse in adolescents selected for minimal alcohol exposure. Adolescents from multiplex alcohol dependence families (high-risk; more than one first and second degree alcoholic relatives) have been reported to exhibit smaller amygdalar volumes [20] and larger cerebellar volumes [21] relative to low-risk adolescent counterparts. Furthermore, youth family history positive (FH+) for alcoholism were found to exhibit less inhibitory frontal activation during the performance of a GO-NO GO functional MRI task, as compared to family history negative (FH−) comparison subjects [22].
Studies of adolescents reporting active drug/alcohol use have demonstrated poorer neuropsychological function relative to non-using counterparts [23–26], however a number of recent studies have examined adolescents who have not yet begun using illicit substances, but who are at risk for substance abuse. These studies found that although intellectual functioning generally falls within the average range [27–29], poorer performance across a number of cognitive domains is evident in non-using FH+ youth compared to their FH− counterparts [22, 30, 31]. Nevertheless, some studies have failed to find such deficits [32, 33]. For instance, children of alcoholics (aged 7.5 yrs. old) demonstrated deficits in abstract reasoning and planning, as well as IQ, spelling and math performance, relative to children of non-alcoholics (aged 7.4 yrs old). These findings were predominantly found in children of antisocial alcoholics [30]. Poorer academic performance also has been reported in adolescents at risk for substance abuse versus counterparts at low risk [34, 35], with a more rapid trajectory of cognitive improvement being observed in the later group measured at baseline and again one year later [36]. Taken together, these studies suggest that during childhood and adolescence decrements in cognitive abilities and academic performance, associated with familial history of substance abuse, may be present prior to cognitive impairments that result from early initiation and continued use of alcohol and drugs.
Importantly, a positive family history of substance abuse (FH+) has been shown to predict future abuse and is associated with an earlier age of onset of use [37, 38], a greater magnitude of use [39–42] and increased incidence of an alcohol use disorder [41, 43–45] in adolescents and young adults ranging from 10 to 21 years of age. Therefore, developmental studies examining the role of FH status may help determine whether alterations in cerebral structure and/or function reflect vulnerabilities that may contribute to the initiation of drug use. The objective of the present was to study examine the relationship between cerebral tissue volume (gray and white matter) and cognitive performance in female and male adolescents stratified into high-risk (FH+) or low-risk (FH−) groups. Given the significant influence of age and sex on cognitive performance and brain tissue volume, age was included in the statistical model as a continuous variable (covariate) and females and males were examined independently [14, 46, 47]. Based on previous evidence [4, 13, 14], it was hypothesized that a positive relationship would be observed between white matter volume and performance on tasks that measure information processing speed/efficiency, whereas a negative relationship was expected between gray matter volume and performance on these tasks. It was further hypothesized that FH status would have a significant influence on these relationships.
METHODS
Participants
The study sample consisting of 33 healthy adolescent volunteers (17 girls and 16 boys; see Table 1) were recruited from the local surrounding communities via advertisement and word of mouth. The overall sample was 52% female, 82% Caucasian (9% African American, 3% Hispanic, 3% Asian) and typically from middle-upper class socioeconomic status [48], and had a mean age of 12.5 ± 2.5 yrs. (mean ± SD; age ranging from 8 to 18 yrs. old) and a mean education of 7.1 ± 2.5 yrs. (education ranging from 3 to 12 years). The accompanying parent, almost exclusively the mother, underwent a Family History – Epidemiologic (FHE) structured interview to obtain information about the parents and children, as well as an unstructured family interview to obtain information about second-degree relatives. A licensed clinical psychologist, at the PhD level, conducted all clinical interviews. Information from parental interviews was used to stratify subjects by family history status (low risk (FH−) or high risk (FH+)). Subjects met the criteria for FH+ status if there was a positive parental report of either parental or grandparent substance abuse (41%, 59% of the sample, respectively) or both parental and grandparent substance abuse (12% of the sample). Thus, no teens were excluded from the study based on family history status. Demographic data from the study subjects, which did not differ significantly between groups, are stratified by sex and FH status in Table 1.
Table 1.
Subject Demographics
| FH− (n=16) | FH+ (n=17) | ||||
|---|---|---|---|---|---|
| Female (n=8) | Male (n=8) | Female (n=9) | Male (n=8) | p | |
| Age | 12.4 ± 2.1 | 12.6 ± 2.5 | 12.4 ± 3.0 | 12.6 ± 2.7 | .97 |
| Education | 6.9 ± 2.4 | 7.1 ± 2.4 | 7.2 ± 3.0 | 7.1 ± 2.5 | .85 |
| Handedness | 8R, 0L | 7R, 1L | 8R, 1L | 8R, 0L | |
| Ethnicity | 82% Caucasian | 81% Caucasian | |||
(data represent mean yrs. ± SD)
Procedure
All aspects of the clinical research protocol were reviewed and approved by the Institutional Review Board of McLean Hospital (Belmont, MA, USA). After a complete description of the study, all subjects and their parent(s) or guardian(s) provided written informed assent or consent, respectively, prior to participation. Subjects received monetary compensation for participating in the study.
Clinical and Cognitive Assessments
Trained research personnel administered all clinical assessments (licensed clinical psychologist, at the PhD level), and neuropsychological testing (trained clinician, at the MA level). Adolescent subjects underwent a structured clinical psychiatric interview, using the Kiddie-Schedule for Affective Disorders and Schizophrenia (K-SADS-E, [49], to rule out Axis I pathologies according to the Diagnostic and Statistical Manual IV (DSM) (e.g., depression, bipolar illness, schizophrenia, conduct disorder, attention deficit disorder). All participating subjects were free of psychiatric diagnoses, neurological illness, severe medical problems, and current or >3 lifetime episodes of alcohol or drug use.
The battery of academic and intellectual screening administered included the Wide Range Achievement Test (WRAT-R; Reading, Spelling and Arithmetic subtests) [50], Stroop Color-Word Interference test [51], and Wechsler Adult Intelligence Scale-Revised (WAIS-R; Digit Span and Symbol subtests) [52]. An abbreviated battery of neuropsychological tests was chosen to characterize academic and cognitive functioning between groups (FH status, sex and age-related differences). Based on previous work, Digit Symbol subtest and Stroop Color Naming/Word Reading were chosen to represent processing speed/efficiency, which was examined relative to brain volume [14].
Magnetic Resonance Imaging Protocol
All imaging data were acquired on a 1.5 Tesla GE scanner. High-resolution three-dimensional sets were acquired. Three set of images were generated: a T1-weighted sagittal localizer (spin echo, 256 × 192 256 × 192, 1 NEX, 24 slices, SLT=4mm with a 1-mm gap, TE=19msec, TR=600msec), a dual echo T2-weighted axial series (VEMP, 256 × 192, 0.5 NEX, 54 slices interleaved, SLT=3mm, TE=30/80msec, TR=3000msec) and 3) 3-D Fourier transformed spoiled gradient-recalled acquisition images (SPGR, 256 × 192, 124 slices, 1 NEX, SLT=1.5mm, TR=35msec, TE=5msec, flip angle=45°). A trained neuroradiologist reviewed the clinical images of each subject.
Morphometric Analysis of Images
Reconstruction of images was conducted off-line on a SUN Microsystems (Mountainview, California) Sparc2 workstation using a semiautomated segmentation software package [53]. The presently reported reconstruction and segmentation procedures have been used previously in our laboratory and are described further in earlier publications [54, 55]. Coronal volumetric images were segmented into gray and white matter using a semiautomated algorithm in MrX (GE Medical Systems, Schenectady, New York; Brigham and Women’s Hospital, Boston, Massachusetts). The full series of coronal images were restored by an experienced image analyst (G.T.) with established interrater reliability of r>0.87 [56]. Images were initially filtered to reduce noise and ensure consistent range of pixel intensities between slices. Computerized semi-automated segmentation was then used to separate skull and meninges from the brain tissue. To differentiate tissues of interest, seed points of similar intensity were selected to define gray matter, white matter and cerebrospinal fluid (Figure 1). This automated process placed a visible segmentation boundary separating the tissues with the greatest contrast values in each coronal slice, generally corresponding to gray matter, white matter and cerebrospinal fluid [14].
Figure 1.

A representative coronal slice of an adolescent brain identifying the tissue segmentation boundaries used for calculating the volume of gray matter, white matter and cerebral spinal fluid.
Following computerized segmentation, the same image analyst edited each slice with reference to a standard anatomical atlas to ensure that tissue boundaries were placed correctly. Anatomical segmentation was conducted by this analyst, blind to the experimental hypotheses and without knowledge of the ages, family history status or neurocognitive performances of the subjects. Regional tissue volumes were calculated by summing all voxels within the segmentation boundaries of each region across slices and multiplying these summed values by the thickness of each slice and the voxel aspect ratio.
Data Analysis
The measured volumes of gray matter, white matter and cerebrospinal fluid (CSF) were corrected for individual variations in cerebral volume by dividing each subject’s total tissue by intracranial volume (ICV; summation of gray and white tissue and CSF). Separate 2(FH+ vs. FH−) × 2(Sex) analyses of covariance (ANCOVAs), using age as a covariate, and Fishers post hoc tests were used to examine differences in academic and cognitive measures, and brain volume data. If Age was determined to have no influence on the dependent measures (nonsignificant effect of Age as a covariate), it was removed from the statistical model, and subsequent 2(FH) × 2(Sex) ANOVAs were calculated. Academic and cognitive dependent variables included WRAT Reading, Spelling and Math performance; WAIS-R Digit Symbol, Digit Span Forward, Backward, and Total number correct; Stroop Test Color Naming, Word Reading and Derived Interference time (sec) to complete the task. Derived interference was calculated to control for differences related to psychomotor speed: Interference (sec) - Color Naming (sec). Brain volume dependent measures included total brain volume (ICV), white matter volume (WM) relative to ICV, gray matter (GM) volume relative to ICV and cerebral spinal fluid volume (CSF) relative to ICV. Based on a priori hypotheses regarding adolescent changes in white and gray matter volumes and age-related improvements in processing speed/efficiency, one-tailed Pearson’s correlation coefficients with Z-tests were used to examine the relationship between WM/ICV and GM/ICV and Digit Symbol Number Correct, Stroop Color Naming time and Stroop Word Reading time. Correlations were stratified by FH status and sex. Statistical ANCOVAs, Fishers post hoc analyses and correlations were conducted using Statview 5.1 (SAS Institute, Cary, NC), with α= 0.05.
RESULTS
Cognitive Performance
Significant age-related improvements were observed for each of the academic and cognitive measures examined, p<.001, when Age was included in the statistical model as a covariate, 2(FH status) × 2(Sex), Covariate(Age) ANCOVA (Table 2). However, no significant effects or interactions involving FH or Sex were observed for cognitive measures when Age was not included in the statistical model, 2(FH status) × 2(Sex) ANOVA (data not shown).
Table 2.
Cognitive Performance
| FH− (n=16) | FH+ (n=17) | p | Regression Analyses (p) | ||||||
|---|---|---|---|---|---|---|---|---|---|
| Female (n=8) | Male (n=8) | Female (n=9) | Male (n=8) | Main Effects Interactions | Age | Age x Sex | Age x FH | ||
| WAIS-R (# correct) | Digit Symbol | 50.4 ± 5.0 | 48.1 ± 3.0 | 51.9 ± 5.2 | 46.8 ± 4.9 | ns | <.0001 | .07 | .22 |
| WAIS-R (# correct) | Digit Span: | ||||||||
| Forward | 6.9 ± 0.7 | 8.9 ± 0.7 | 8.1 ± 0.7 | 8.4 ± 0.8 | ns | .0004 | .42 | .63 | |
| Backward | 6.0 ± 0.5 | 7.4 ± 0.9 | 7.8 ± 0.9 | 6.1 ± 0.7 | ns | <.0001 | .95 | .49 | |
| Total | 12.9 ± 1.2 | 16.3 ± 1.4 | 15.9 ± 1.5 | 14.5 ± 1.4 | ns | <.0001 | .65 | .48 | |
| Stroop (sec) | Color Naming | 71.6 ± 7.4 | 66.4 ± 4.5 | 70.3 ± 6.9 | 68.3 ± 3.8 | .007A | <.0001 | .01 | .95 |
| Word Reading | 54.8 ± 4.7 | 50.3 ± 3.0 | 52.2 ± 3.9 | 50.8 ± 2.6 | .001A, .04B | <.0001 | .002 | .98 | |
| Derived Interference | 74.4 ± 7.5 | 63.9 ± 11.2 | 54.6 ± 6.5 | 63.1 ± 10.6 | ns | .0006 | .37 | .79 | |
| WRAT | Reading | 45.3 ± 4.2 | 47.5 ± 2.0 | 42.3 ± 2.1 | 46.5 ± 2.3 | ns | <.0001 | .77 | .48 |
| Spelling | 37.0 ± 2.3 | 41.6 ± 2.0 | 37.1 ± 2.2 | 40.8 ± 2.9 | ns | <.0001 | .92 | .67 | |
| Arithmetic | 39.1 ± 3.1 | 41.5 ± 1.7 | 37.8 ± 2.9 | 40.3 ± 2.6 | .01A | <.0001 | .01 | .91 | |
Data represent mean ± SEM. Data represent mean ± SEM.
Indicates a significant main effect of sex.
Indicates a significant FH x sex interaction.
The ANCOVA for Stroop Color Naming revealed a significant main effect of sex (F(1,25)=8.36, p<.01), which was tempered by an interaction with Age (F(1,25)=7.90, p<.01). Although overall mean time (sec) to complete the Color Naming task did not differ significantly between females and males (Age not included as a covariate), the magnitude of the trajectory of improvement with age did differ between sexes. Females appeared to exhibit longer times to complete the Color Naming task at the younger ages relative to similarly-aged males, however the slope of the improvement in females was steeper than in males: females – regression, F(1,16)=40.18, p<.001, regression coefficient=−6.78, standard error=1.07, and males: regression, F(1,16)=6.89, p=.02, regression coefficient=−2.65, standard error=1.01 (Figure 2).
Figure 2.
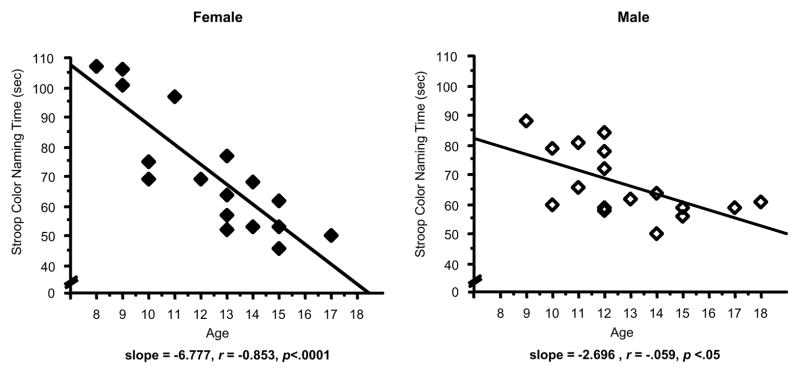
Scatterplots represent individual subject data for the relationship between Age and Stroop Color Naming Time (sec) in female (left panel, solid diamonds) and male adolescents (right panel, open diamonds). Solid lines represent the linear regression. Less time (sec) time to complete the Color Naming component of the Stroop Test reflects better performance. Linear regression analyses of age versus performance revealed: for females, F(1,16)=40.18, p<.001, regression coefficient=−6.78, standard error=1.07; for males, regression, F(1,16)=6.89, p=.02, regression coefficient=−2.65, standard error=1.01.
The ANCOVA for Stroop Word Reading also revealed a significant main effect of Sex (F(1,25)=13.30, p<.005), but also significant FH x Sex (F(1,25)=4.86, p<.05) and Sex x Age (F(1,25)=12.39, p<.005) interactions; these effects were moderated by a three-way interaction with Age (F(1,25)=4.55, p<.05). Although overall mean time (sec) to complete the Word Reading task did not differ significantly between FH groups, females and FH+ males, not FH− males, demonstrated a significant trajectory of improvement with Age: FH− females – regression, F(1,7)=25.89, p<.005, regression coefficient=−5.66, standard error=1.11; and FH+ females – regression: F(1,8)=28.96, p<.005, regression coefficient=−3.50, standard error=0.65. FH+ males displayed an age trajectory of improvement similar to females: FH+ males – regression: F(1,7)=8.89, p<.05, regression coefficient=−2.12, standard error=0.71. FH− males, however, tended to perform better at the younger ages than females or FH+ males, with little subsequent improvement with age being observed: FH− males – nonsignificant regression, F(1,7)=0.04, p>.05, regression coefficient=−0.30, standard error=1.42 (Figure 3).
Figure 3.

Scatterplots represent individual subject data for the relationship between Age and Stroop Word Reading Time (sec) in female (top panels) and male adolescents (bottom panels), stratified by FH status. Less time (sec) time to complete the Word Reading component of the Stroop Test reflects better performance. Open circles represent individual FH− subjects and filled circles represent FH+ subjects). Dashed lines and solid lines represent linear regressions for FH− and FH+ subjects, respectively. Linear regression analyses of age versus performance revealed: for FH− females, F(1,7)=25.89, p<.005, regression coefficient=−5.66, standard error=1.11; for FH+ females, F(1,8)=28.96, p<.005, regression coefficient=−3.50, standard error=0.65; for FH− males (nonsignificant), F(1,7)=0.04, p>.05; for FH+ males F(1,7)=8.89, p<.05, regression coefficient=−2.12, standard error=0.71.
Brain Volume
No significant effects involving FH or Sex were observed for total ICV, gray matter/ICV, white matter/ICV or CSF/ICV when Age was included in the statistical model as a covariate, 2(FH status) x 2(Sex) x Covariate(Age) ANCOVA (Table 3). A significant effect of Sex was observed for total ICV when Age was not included in the statistical model, 2(FH status) x 2(Sex) ANOVA. Total intracranial volume was significantly greater in males (1480.69 ± 20.68) than in females (1331.99 ± 22.45), regardless of FH group, F(1,29)=23.69, p<.0001. There also was a significant effect of Sex for gray matter, with males (913.72 ± 21.77) demonstrating a greater values than females (799.15 ± 30.25), F(1,29)=9.12, p<.01; this effect was absent when gray matter volume was corrected for ICV (Table 3).
Table 3.
Brain Volume
| FH− (n=16) | FH+ (n=17) | p | |||
|---|---|---|---|---|---|
| Female (n=8) | Male (n=8) | Female (n=9) | Male (n=8) | Main Effects Interactions | |
| Total Brain Volume (ICV) | 1366.8 ± 33.7 | 1464.1 ± 32.5 | 1301.1 ± 27.7 | 1497.3 ± 26.4 | .0001A |
| Gray/ICV | 0.61 ± 0.02 | 0.61 ± 0.01 | 0.58 ± 0.03 | 0.63 ± 0.02 | ns |
| White/ICV | 0.38 ± 0.02 | 0.38 ± 0.01 | 0.41 ± 0.02 | 0.37 ± 0.02 | ns |
| CSF/ICV | 0.01 ± 0.003 | 0.01 ± 0.004 | 0.01 ± 0.001 | 0.01 ± 0.001 | ns |
Data represent mean ± SEM.
Indicates a significant main effect of sex. No significant Age, Age x Sex or Age x FH regressions were observed.
Correlations: White and Gray Matter Volume vs. Cognitive Processing Speed
Significant correlations were observed between white matter volume/ICV and performance on the Digit Symbol subtest (greater number correct) and the Color Naming component of the Stroop task (less time to complete the task) (Figures 4,5). These significant associations were observed only in FH− female adolescents (Digit Symbol: r =.67, z=1.81, p = .03; Color Naming: r = −.62, z=−1.60, p = .05) (Table 4). Furthermore, FH− females also displayed trends for relationships between white matter volume/ICV and performance on the Word Reading component of the Stroop task (r =−.60, z=−1.53, p=.06) and gray matter volume/ICV and performance on the Digit Symbol subtest (r = −.60, z=−1.55, p = .06) and Color Naming task (r = .53, z=1.31, p = .09) (Figure 6, Table 4). No significant correlations were observed between cerebral tissue volume (white or gray matter, or CSF) and the other cognitive domains measured for any of the groups examined.
Figure 4.

Scatterplots represent individual subject data for the relationship between White Matter Volume, relative to ICV, versus Digit Symbol # Correct, in female (left panel) and male adolescents (right panel). A greater number correct for the Digit Symbol test reflects better performance. Open circles represent individual FH− subjects and filled circles represent FH+ subjects. Dashed lines and solid lines represent linear regressions for FH− and FH+ subjects, respectively. A significant correlation was observed between White Matter Volume/ICV and Digit Symbol # Correct in FH− females (r= .669, p=.03).
Figure 5.

Scatterplots represent individual subject data for the relationship between White Matter Volume, relative to ICV, versus Stroop Color Naming Time (sec), in female (left panel) and male adolescents (right panel). Less time (sec) time to complete the Color Naming component of the Stroop Test reflects better performance. Open circles represent individual FH− subjects and filled circles represent FH+ subjects. Dashed lines and solid lines represent linear regressions for FH− and FH+ subjects, respectively. A significant correlation was observed between White Matter Volume/ICV and Stroop Color Naming Time in FH− females (r= −.621, p=.05).
Table 4.
Correlations between Brain Volume and Processing Speed/Efficiency
| FH− (n=16) | FH+ (n=17) | |||
|---|---|---|---|---|
| Correlation | Female (n=8) | Female (n=9) | Male (n=8) | Male (n=8) |
| White Matter | ||||
| WM/ICV vs. Digit Symbol | r= .67* | r= .05 | r= −.55 | r= .49 |
| z=1.81, p=.03 | z=0.12, p=.45 | z=−1.39, p=.92 | z=1.19, p=.17 | |
| WM/ICV vs. Color Naming | r= −.62* | r= .25 | r= .13 | r= −.43 |
| z= −1.60, p=.05 | z= 0.64, p=.74 | z= 0.30, p=.62 | z= −1.02, p=.16 | |
| WM/ICV vs. Word Reading | r= −.60 | r= .08 | r= .04 | r= −.40 |
| z= −1.53, p=.06 | z= 0.20, p=.58 | z= 0.87, p=.53 | z= −0.94, p=.18 | |
|
| ||||
| Gray Matter | ||||
| GM/ICV vs. Digit Symbol | r= −.60 | r= −.05 | r= −.28 | r= −.05 |
| z= −1.55, p=.06 | z= −0.13, p=.45 | z= 0.63, p=.74 | z= −1.24, p=.11 | |
| GM/ICV vs. Color Naming | r= .53 | r= −.24 | r= .11 | r= .44 |
| z= 1.31, p=.09 | z= −0.59, p=.72 | z= 0.26, p=.40 | z= 1.07, p=.14 | |
| GM/ICV vs. Word Reading | r= .51 | r= −.07 | r= .12 | r= .41 |
| z= 1.26, p=.10 | z= −0.18, p=.57 | z= 0.26, p=.40 | z= 0.97, p=.17 | |
Data represent one-tailed Pearson’s Moment correlations, with z scores, α=.05.
Indicates a significant correlation, p ≤ .05.
Figure 6.

Scatterplots represent individual subject data for the relationship between White Matter Volume, relative to ICV, versus Stroop Word Reading Time (sec), in female (left panel) and male adolescents (right panel). Less time (sec) time to complete the Word Reading component of the Stroop Test reflects better performance. Open circles represent individual FH− subjects and filled circles represent FH+ subjects. Dashed lines and solid lines represent linear regressions for FH− and FH+ subjects, respectively. A trend for a significant correlation was observed between White Matter Volume/ICV and Stroop Word Reading in FH− females (r= −.595, p=.06).
DISCUSSION
To our knowledge, this is one of the first studies to examine the relationship between cerebral tissue volume and cognitive performance in adolescents who have not yet begun to use licit or illicit substances, but who are FH+ or FH− for substance abuse. Not surprisingly, dramatic age-related improvements were observed across all cognitive domains examined. In addition, we observed sex-specific influences of FH status on the relationships between white matter volume and information processing speed. Interestingly, overall cognitive performance and brain tissue volumes did not statistically differ between FH+ and FH− youth.
Modest sex differences were observed for age-related improvement in performance on Stroop Color Naming, with female subjects generally showing more rapid improvement with age compared to males. Sex differences also were observed for the trajectory of improvement for Stroop Word Reading, with females demonstrating a similarly steep trajectory of improvement relative to males. This sex effect for Word Reading was moderated by FH status, however, with FH− males appearing to perform better at the youngest ages tested relative to similar aged subjects in all other groups. Given that there was little room for subsequent improvement at the older ages in FH− males, the regression of age versus performance on Word Reading was nonsignificant in this group. Significant age regressions were observed on this cognitive measure for females, regardless of FH status, and FH+ males.
Family history status did not significantly influence whole brain total, gray or white matter volumes in the present study, although prior reports have demonstrated volume differences in focal regions of interest such as the amygdala and cerebellum in FH+ adolescents [20, 21]. Consistent with previous studies, significant sex differences were observed, with males exhibiting ~10% greater total brain volume than females [6, 14, 46], regardless of FH status. Although males also exhibited greater gray matter volume than females, this difference was no longer present when gray matter volume was corrected for intracranial volume. Brain volumes were not significantly influenced by age in the present study, however there were nonsignificant age-related increases in white matter volume (r= 0.10, p=.57) and decreases in gray matter volume (r= −0.12, p=.50), regardless of FH status. Power estimates were calculated and revealed the following effect sizes for the ANOVAs of brain volume data as a function of FH group (16 FH− and 17 FH+): total brain volume effect size f=.39, gray matter volume/ICV effect size f=.23 and white matter volume/ICV effect size f=.38. For the given sample size (n=33), an effect size of at least .50 would be necessary to detect significant group differences. Furthermore, the achieved power for each of these analyses was .58 (total brain volume), .25 (GM/ICV), and .57 (WM/ICV). In order to achieve power =.80, a priori power calculations determined that total sample sizes of 54 (total brain volume), 150 (GM/ICV) and 56 (WM/ICV) per group would be necessary to detect significant group differences. These analyses suggest that the study may have been somewhat underpowered, minimizing the likelihood of detecting significant differences in the current sample.
Family history status appeared to moderate the relationship between information processing speed, as measured using the Digit Symbol and Stroop Color Naming subtests, and whole brain white matter volume in the present study. Information proceeding speed was tested for its relationship to WM volume and only weak support was found (FH− females only). It is plausible that the time course of structural brain development and associated improvements in cognitive functioning may be influenced by an interaction between sex and FH status, given that FH+ girls and boys demonstrate different patterns and rates of development than FH− counterparts. Regardless, FH+ youth did not display deficits in cognitive processing or brain tissue volume in the present study. These results are consistent with previous reports that a negative influence of FH status on cognitive performance is not always observed [27–29]. It is important to note, however, that given the limited sample size, only modest power was achieved for the significant relationships between WM/ICV and processing speed in FH− females. For instance, the following power was achieved for the relationships observed in FH− females for WM/ICV and digit symbol number correct = .73, WM/ICV and color naming = .63, and WM/ICV and word reading = .58. The sample size of FH− females (n=8 in the current study) would need only be increased to 13 subjects to achieve power = .80, suggesting that the significant relationships observed between these variables in FH− females do not reflect variability alone. For the other groups, however, a minimum of 35 FH+ males, greater than 100 FH+ females and greater than 100 FH− males would be required to obtain significant relationships between WM/ICV and cognitive processing speed variables, with power = .80.
Overall, total brain volume, and gray and white matter volumes did not change significantly with age, perhaps due in part to the limited sample sizes included in this investigation. It is plausible, given the relationship between white matter volume and cognitive performance, that developmental increases in myelination may subserve age-related improvements in some cognitive abilities, at least in FH− girls [8, 57–59]. Whole brain white and gray matter volumes were not significantly associated with verbal ability or mental flexibility/working memory. The absence of a relationship between brain volumes and these other domains suggests that processing speed may be reflected structurally on a global level as measured in this study, whereas more specific cognitive abilities may be associated with tissue volumes in anatomically distinct regions of interest, such as mesiotemporal or prefrontal regions.
There are a number of factors that must be considered when interpreting these study findings. First, since the current investigation includes a moderate sample size for neuroimaging studies, the sample may be limited in the ability to parse out sex and FH status effects on cognition and brain volume. Significant relationships were observed in FH− girls when subjects were stratified by sex and FH status, however these findings will need to be confirmed in future studies that include larger sample sizes. Second, the discrepancy between the lack of significant FH effects and previous reports documenting negative FH effects on neuropsychological function and tissue volumes may be due to differences in demographic factors across studies. All adolescents examined in the present study had less than three episodes of lifetime alcohol use and no lifetime use of other psychoactive substances. Subjects also had middle to upper class SES status, regardless of FH status, and did not meet criteria for psychiatric conditions such as attention deficit disorder or conduct disorder. Risk associated with FH status could have also been minimized due to the determination of family history of substance abuse, as a structured interview with a single parent has been shown to be less sensitive for detecting accurate family history status than interviewing multiple family members [60]. Furthermore, the majority of adolescents in the FH+ group were from simplex families with alcohol dependence, where only a single relative, parent or grandparent, determined meeting the criteria for a positive family history of substance abuse (88%). To this end, Hill and colleagues [61] have suggested that a greater family loading of alcoholism (multiplex family history of alcoholism) is associated with a greater genetic susceptibility for developing a substance use disorder than a lesser degree of family loading (simplex family history of alcoholism).
In conclusion, age related differences in neuropsychological functioning were seen that might, in expanded samples, prove to be related to risk for substance abuse in adolescents who have not yet initiated drug use. Given the critical period of brain development occurring during the adolescent period, as evidenced by significant improvements in neurocognitive functioning, it is imperative that youth become educated about the risks associated with early alcohol or drug use, as altered structural and functional brain development could lead to poor cognitive performance, which in turn could compromise educational attainment and mitigate healthy psychosocial development.
Acknowledgments
This work was supported by NIAAA K01 grant AA014651 (MMS), NIDA RO1 grant DA020269 (DYT) and a grant from the Charles H. Hood Foundation (DYT).
References
- 1.Giedd JN, Snell JW, Lange N, Rajapakse JC, Casey BJ, Kozuch PL, et al. Quantitative magnetic resonance imaging of human brain development: ages 4–18. Cereb Cortex. 1996;6:551–60. doi: 10.1093/cercor/6.4.551. [DOI] [PubMed] [Google Scholar]
- 2.Jernigan TL, Trauner DA, Hesselink JR, Tallal P. A Maturation of human cerebrum observed in vivo during adolescence. Brain. 1991;114 ( Pt 5):2037–49. doi: 10.1093/brain/114.5.2037. [DOI] [PubMed] [Google Scholar]
- 3.Pfefferbaum A, Mathalon DH, Sullivan EV, Rawles JM, Zipursky RB, Lim KO. A quantitative magnetic resonance imaging study of changes in brain morphology from infancy to late adulthood. Arch Neurol. 1994;51:874–87. doi: 10.1001/archneur.1994.00540210046012. [DOI] [PubMed] [Google Scholar]
- 4.Reiss AL, Abrams MT, Singer HS, Ross JL, Denckla MB. Brain development, gender and IQ in children A volumetric imaging study. Brain. 1996;119 ( Pt 5):1763–74. doi: 10.1093/brain/119.5.1763. [DOI] [PubMed] [Google Scholar]
- 5.De Bellis MD, Keshavan MS, Beers SR, Hall J, Frustaci K, Masalehdan A, et al. Sex differences in brain maturation during childhood and adolescence. Cereb Cortex. 2001;11:552–7. doi: 10.1093/cercor/11.6.552. [DOI] [PubMed] [Google Scholar]
- 6.Giedd JN, Blumenthal J, Jeffries NO, Castellanos FX, Liu H, Zijdenbos A, et al. Brain development during childhood and adolescence: a longitudinal MRI study. Nat Neurosci. 1999;2:861–3. doi: 10.1038/13158. [DOI] [PubMed] [Google Scholar]
- 7.Sowell ER, Trauner DA, Gamst A, Jernigan TL. Development of cortical and subcortical brain structures in childhood and adolescence: a structural MRI study. Dev Med Child Neurol. 2002;44:4–16. doi: 10.1017/s0012162201001591. [DOI] [PubMed] [Google Scholar]
- 8.Nagel BJ, Medina KL, Yoshii J, Schweinsburg AD, Moadab I, Tapert SF. Age-related changes in prefrontal white matter volume across adolescence. Neuroreport. 2006;17:1427–31. doi: 10.1097/01.wnr.0000233099.97784.45. [DOI] [PMC free article] [PubMed] [Google Scholar]
- 9.Munakata Y, Casey BJ, Diamond A. Developmental cognitive neuroscience: progress and potential. Trends Cogn Sci. 2004;8:122–8. doi: 10.1016/j.tics.2004.01.005. [DOI] [PubMed] [Google Scholar]
- 10.Steinberg L. Cognitive and affective development in adolescence. Trends Cogn Sci. 2005;9:69–74. doi: 10.1016/j.tics.2004.12.005. [DOI] [PubMed] [Google Scholar]
- 11.Yurgelun-Todd DA, Killgore WD, Cintron CB. Cognitive correlates of medial temporal lobe development across adolescence: a magnetic resonance imaging study. Percept Mot Skills. 2003;96:3–17. doi: 10.2466/pms.2003.96.1.3. [DOI] [PubMed] [Google Scholar]
- 12.Casey BJ, Trainor R, Giedd J, Vauss Y, Vaituzis CK, Hamburger S, et al. The role of the anterior cingulate in automatic and controlled processes: a developmental neuroanatomical study. Dev Psychobiol. 1997;30:61–9. [PubMed] [Google Scholar]
- 13.Sowell ER, Delis D, Stiles J, Jernigan TL. Improved memory functioning and frontal lobe maturation between childhood and adolescence: a structural MRI study. J Int Neuropsychol Soc. 2001;7:312–22. doi: 10.1017/s135561770173305x. [DOI] [PubMed] [Google Scholar]
- 14.Yurgelun-Todd DA, Killgore WD, Young AD. Sex differences in cerebral tissue volume and cognitive performance during adolescence. Psychol Rep. 2002;91:743–57. doi: 10.2466/pr0.2002.91.3.743. [DOI] [PubMed] [Google Scholar]
- 15.Bates ME, Labouvie EW. Adolescent risk factors and the prediction of persistent alcohol and drug use into adulthood. Alcohol Clin Exp Res. 1997;21:944–50. [PubMed] [Google Scholar]
- 16.Johnston LD, O’Malley PM, Bachman JG. Monitoring the Future national survey results on drug use, 1975–1999 Volume 1: Secondary school students. Rockville: National Institute on Drug Abuse; 2000. (NIH publication No. 00-4802) [Google Scholar]
- 17.De Bellis MD, Clark DB, Beers SR, Soloff PH, Boring AM, Hall J, et al. Hippocampal volume in adolescent-onset alcohol use disorders. Am J Psychiatry. 2000;157:737–744. doi: 10.1176/appi.ajp.157.5.737. [DOI] [PubMed] [Google Scholar]
- 18.Tapert SF, Brown GG, Kindermann SS, Cheung EH, Frank LR, Brown SA. fMRI measurement of brain dysfunction in alcohol-dependent young women. Alcohol Clin Exp Res. 2001;25:236–45. [PubMed] [Google Scholar]
- 19.Tapert SF, Schweinsburg AD, Barlett VC, Brown SA, Frank LR, Brown GG, et al. Blood oxygen level dependent response and spatial working memory in adolescents with alcohol use disorders. Alcohol Clin Exp Res. 2004;28:1577–86. doi: 10.1097/01.alc.0000141812.81234.a6. [DOI] [PubMed] [Google Scholar]
- 20.Hill SY, De Bellis MD, Keshavan MS, Lowers L, Shen S, Hall J, et al. Right amygdala volume in adolescent and young adult offspring from families at high risk for developing alcoholism. Biol Psychiatry. 2001;49:894–905. doi: 10.1016/s0006-3223(01)01088-5. [DOI] [PubMed] [Google Scholar]
- 21.Hill SY, Muddasani S, Prasad K, Nutche J, Steinhauer SR, Scanlon J, et al. Cerebellar volume in offspring from multiplex alcohol dependence families. Biol Psychiatry. 2007;61:41–7. doi: 10.1016/j.biopsych.2006.01.007. [DOI] [PMC free article] [PubMed] [Google Scholar]
- 22.Schweinsburg AD, Paulus MP, Barlett VC, Killeen LA, Caldwell LC, Pulido C, et al. An FMRI study of response inhibition in youths with a family history of alcoholism. Ann N Y Acad Sci. 2004;1021:391–4. doi: 10.1196/annals.1308.050. [DOI] [PubMed] [Google Scholar]
- 23.Aytaclar S, Tarter RE, Kirisci L, Lu S. Association between hyperactivity and executive cognitive functioning in childhood and substance use in early adolescence. J Am Acad Child Adolesc Psychiatry. 1999;38:172–8. doi: 10.1097/00004583-199902000-00016. [DOI] [PubMed] [Google Scholar]
- 24.Nigg JT, Glass JM, Wong MM, Poon E, Jester JM, Fitzgerald HE, et al. Neuropsychological executive functioning in children at elevated risk for alcoholism: findings in early adolescence. J Abnorm Psychol. 2004;113:302–14. doi: 10.1037/0021-843X.113.2.302. [DOI] [PubMed] [Google Scholar]
- 25.Tapert SF, Brown SA. Substance dependence, family history of alcohol dependence and neuropsychological functioning in adolescence. Addiction. 2000;95:1043–53. doi: 10.1046/j.1360-0443.2000.95710436.x. [DOI] [PubMed] [Google Scholar]
- 26.Drejer K, Theilgaard A, Teasdale TW, Schulsinger F, Goodwin DW. A prospective study of young men at high risk for alcoholism: neuropsychological assessment. Alcohol Clin Exp Res. 1985;9:498–502. doi: 10.1111/j.1530-0277.1985.tb05590.x. [DOI] [PubMed] [Google Scholar]
- 27.Alterman AI, Searles JS, Hall JG. Failure to find differences in drinking behavior as a function of familial risk for alcoholism: a replication. J Abnorm Psychol. 1989;98:50–3. doi: 10.1037//0021-843x.98.1.50. [DOI] [PubMed] [Google Scholar]
- 28.Johnson JL, Rolf JE. Cognitive functioning in children from alcoholic and non-alcoholic families. Br J Addict. 1988;83:849–57. doi: 10.1111/j.1360-0443.1988.tb00520.x. [DOI] [PubMed] [Google Scholar]
- 29.Schuckit MA, Butters N, Lyn L, Irwin M. Neuropsychologic deficits and the risk for alcoholism. Neuropsychopharmacology. 1987;1:45–53. doi: 10.1016/0893-133x(87)90009-1. [DOI] [PubMed] [Google Scholar]
- 30.Poon E, Ellis DA, Fitzgerald HE, Zucker RA. Intellectual, cognitive, and academic performance among sons of alcoholics, during the early school years: differences related to subtypes of familial alcoholism. Alcohol Clin Exp Res. 2000;24:1020–7. [PubMed] [Google Scholar]
- 31.Ozkaragoz T, Satz P, Noble EP. Neuropsychological functioning in sons of active alcoholic, recovering alcoholic, and social drinking fathers. Alcohol. 1997;14:31–7. doi: 10.1016/s0741-8329(96)00084-5. [DOI] [PubMed] [Google Scholar]
- 32.Reich W, Earls F, Frankel O, Shayka JJ. Psychopathology in children of alcoholics. J Am Acad Child Adolesc Psychiatry. 1993;32:995–1002. doi: 10.1097/00004583-199309000-00017. [DOI] [PubMed] [Google Scholar]
- 33.Vitaro F, Dobkin PL, Carbonneau R, Tremblay RE. Personal and familial characteristics of resilient sons of male alcoholics. Addiction. 1996;91:1161–77. doi: 10.1046/j.1360-0443.1996.91811618.x. [DOI] [PubMed] [Google Scholar]
- 34.McGrath CE, Watson AL, Chassin L. Academic achievement in adolescent children of alcoholics. J Stud Alcohol. 1999;60:18–26. doi: 10.15288/jsa.1999.60.18. [DOI] [PubMed] [Google Scholar]
- 35.Murphy RT, O’Farrell TJ, Floyd FJ, Connors GJ. School adjustment of children of alcoholic fathers: comparison to normal controls. Addict Behav. 1991;16:275–87. doi: 10.1016/0306-4603(91)90020-i. [DOI] [PubMed] [Google Scholar]
- 36.Silveri MM, Tzilos GK, Pimentel PJ, Yurgelun-Todd DA. Trajectories of adolescent emotional and cognitive development: effects of sex and risk for drug use. Ann N Y Acad Sci. 2004;1021:363–70. doi: 10.1196/annals.1308.046. [DOI] [PubMed] [Google Scholar]
- 37.Hill SY, Shen S, Lowers L, Locke J. Factors predicting the onset of adolescent drinking in families at high risk for developing alcoholism. Biol Psychiatry. 2000;48:265–75. doi: 10.1016/s0006-3223(00)00841-6. [DOI] [PubMed] [Google Scholar]
- 38.McGue M, Iacono WG, Legrand LN, Elkins I. Origins and consequences of age at first drink. II Familial risk and heritability. Alcohol Clin Exp Res. 2001;25:1166–73. [PubMed] [Google Scholar]
- 39.Chassin L, Barerra M. Substance use escalation and substance use restraint among adolescent children of alcoholics. Psychology of Addictive Behaviors. 1993;7:3–20. [Google Scholar]
- 40.Chassin L, Pillow DR, Curran PJ, Molina BS, Barrera M., Jr Relation of parental alcoholism to early adolescent substance use: a test of three mediating mechanisms. J Abnorm Psychol. 1993;102:3–19. doi: 10.1037//0021-843x.102.1.3. [DOI] [PubMed] [Google Scholar]
- 41.Chassin L, Flora DB, King KM. Trajectories of alcohol and drug use and dependence from adolescence to adulthood: The effects of familial alcoholism and personality. Journal of Abnormal Psychology. 2004;113:483–498. doi: 10.1037/0021-843X.113.4.483. [DOI] [PubMed] [Google Scholar]
- 42.Clark DB, Cornelius JR, Kirisci L, Tarter RE. Childhood risk categories for adolescent substance involvement: a general liability typology. Drug Alcohol Depend. 2005;77:13–21. doi: 10.1016/j.drugalcdep.2004.06.008. [DOI] [PubMed] [Google Scholar]
- 43.Milberger S, Faraone SV, Biederman J, Chu MP, Feighner JA. Substance use disorders in high-risk adolescent offspring. Am J Addict. 1999;8:211–9. doi: 10.1080/105504999305820. [DOI] [PubMed] [Google Scholar]
- 44.Biederman J, Faraone SV, Monuteaux MC, Feighner JA. Patterns of alcohol and drug use in adolescents can be predicted by parental substance use disorders. Pediatrics. 2000;106:792–7. doi: 10.1542/peds.106.4.792. [DOI] [PubMed] [Google Scholar]
- 45.Lieb R, Merikangas KR, Hofler M, Pfister H, Isensee B, Wittchen HU. Parental alcohol use disorders and alcohol use and disorders in offspring: a community study. Psychol Med. 2002;32:63–78. doi: 10.1017/s0033291701004883. [DOI] [PubMed] [Google Scholar]
- 46.Lenroot RK, Gogtay N, Greenstein DK, Wells EM, Wallace GL, Clasen LS, et al. Sexual dimorphism of brain developmental trajectories during childhood and adolescence. Neuroimage. 2007;36:1065–73. doi: 10.1016/j.neuroimage.2007.03.053. [DOI] [PMC free article] [PubMed] [Google Scholar]
- 47.Waber DP, De Moor C, Forbes PW, Almli CR, Botteron KN, Leonard G, et al. The NIH MRI study of normal brain development: performance of a population based sample of healthy children aged 6 to 18 years on a neuropsychological battery. J Int Neuropsychol Soc. 2007;13:729–46. doi: 10.1017/S1355617707070841. [DOI] [PubMed] [Google Scholar]
- 48.Hollingshead AB. Two factor index of social position. New Haven: Author; 1957. [Google Scholar]
- 49.Puig-Antich J, Orvaschel H, Tabrizi M, Chambers W. The Schedule for Affective Disorders and Schizophrenia for School-Aged Children - Epidemiologic Version (Kiddie-SADS-E) New York: New York State Psychiatric Institute and Yale University School of Medicine; 1980. [Google Scholar]
- 50.Jastak S, Wilkenson G. The Wide Range Achievement Test- Revised. Wilmington, DE: Jastak Assoc; 1984. [Google Scholar]
- 51.Stroop JR. Studies of interference in serial verbal reactions. Journal of Experimental Psychology. 1935;18:643–662. [Google Scholar]
- 52.Wechsler D. Wechsler Adult Intelligence Scale- Revised. New York, NY: Psychological Corp; 1981. [Google Scholar]
- 53.Kikinis R, Shenton ME, Gerig G, Martin J, Anderson M, Metcalf D, et al. Routine quantitative analysis of brain and cerebrospinal fluid spaces with MR imaging. J Magn Reson Imaging. 1992;2:619–29. doi: 10.1002/jmri.1880020603. [DOI] [PubMed] [Google Scholar]
- 54.Loeber RT, Cintron CM, Yurgelun-Todd DA. Morphometry of individual cerebellar lobules in schizophrenia. Am J Psychiatry. 2001;158:952–4. doi: 10.1176/appi.ajp.158.6.952. [DOI] [PubMed] [Google Scholar]
- 55.Rosso IM, Cintron CM, Steingard RJ, Renshaw PF, Young AD, Yurgelun-Todd DA. Amygdala and hippocampus volumes in pediatric major depression. Biol Psychiatry. 2005;57:21–6. doi: 10.1016/j.biopsych.2004.10.027. [DOI] [PubMed] [Google Scholar]
- 56.Tzilos GK, Cintron CB, Wood JB, Simpson NS, Young AD, Pope HG, Jr, et al. Lack of hippocampal volume change in long-term heavy cannabis users. Am J Addict. 2005;14:64–72. doi: 10.1080/10550490590899862. [DOI] [PubMed] [Google Scholar]
- 57.Hasan KM, Halphen C, Sankar A, Eluvathingal TJ, Kramer L, Stuebing KK, et al. Diffusion tensor imaging-based tissue segmentation: Validation and application to the developing child and adolescent brain. Neuroimage. 2006 doi: 10.1016/j.neuroimage.2006.10.029. [DOI] [PMC free article] [PubMed] [Google Scholar]
- 58.Mabbott DJ, Noseworthy M, Bouffet E, Laughlin S, Rockel C. White matter growth as a mechanism of cognitive development in children. Neuroimage. 2006;33:936–46. doi: 10.1016/j.neuroimage.2006.07.024. [DOI] [PubMed] [Google Scholar]
- 59.Silveri MM, Rohan ML, Pimentel PJ, Gruber SA, Rosso IM, Yurgelun-Todd DA. Sex differences in the relationship between white matter microstructure and impulsivity in adolescents. Magn Reson Imaging. 2006;24:833–41. doi: 10.1016/j.mri.2006.03.012. [DOI] [PubMed] [Google Scholar]
- 60.Rice JP, Reich T, Bucholz KK, Neuman RJ, Fishman R, Rochberg N, et al. Comparison of direct interview and family history diagnoses of alcohol dependence. Alcohol Clin Exp Res. 1995;19:1018–23. doi: 10.1111/j.1530-0277.1995.tb00983.x. [DOI] [PubMed] [Google Scholar]
- 61.Hill SY, Hoffman EK, Zezza N, Thalamuthu A, Weeks DE, Matthews AG, et al. Dopaminergic mutations: Within-family association and linkage in multiplex alcohol dependence families. Am J Med Genet B Neuropsychiatr Genet. 2007 doi: 10.1002/ajmg.b.30630. [DOI] [PMC free article] [PubMed] [Google Scholar]