

Abstract
Intravital microscopy, microscopy of living animals, is a powerful research technique that combines the resolution and sensitivity found in microscopic studies of cultured cells with the relevance and systemic influences of cells in the context of the intact animal. The power of intravital microscopy has recently been extended with the development of multiphoton fluorescence microscopy systems capable of collecting optical sections from deep within the kidney at subcellular resolution, supporting high-resolution characterizations of the structure and function of glomeruli, tubules, and vasculature in the living kidney. Fluorescent probes are administered to an anesthetized, surgically prepared animal, followed by image acquisition for up to 3 hr. Images are transferred via a high-speed network to specialized computer systems for digital image analysis. This general approach can be used with different combinations of fluorescent probes to evaluate processes such as glomerular permeability, proximal tubule endocytosis, microvascular flow, vascular permeability, mitochondrial function, and cellular apoptosis/necrosis.
Keywords: multiphoton microscopy, intravital microscopy, in vivo microscopy, fluorescence microscopy
Introduction
Intravital microscopy, microscopy of living animals, is a powerful research technique that combines the resolution and sensitivity found in microscopic studies of cultured cells with the relevance and systemic influences of cells in the context of the intact animal. Intravital microscopy has been applied to renal research for nearly 100 years, having first been used to observe the function of the kidney of a living mouse in 1912 (Ghiron, 1912, and see review in Steinhausen and Tanner, 1976). Since that time, investigators have exploited that ability to observe blood flow and tubular function at the cortical surface to better understand kidney function under normal and pathological conditions. The power of intravital microscopy has recently been extended with the development of multiphoton fluorescence microscopy systems. These systems are capable of collecting optical sections from deep within the kidney at subcellular resolution, supporting high-resolution characterizations of the structure and function of glomeruli, tubules, and vasculature in the living kidney.
Intravital microscopy requires a combination of unique skills and specialized equipment. Studies require technicians skilled in microscopy as well as in animal handling, including surgery. Studies require facilities for animal housing and surgery, microscope systems equipped with systems for maintenance and monitoring of living animals, and computer systems equipped with image-analysis software.
A typical study begins with the preparation of fluorescent probes to be introduced into the animal, followed by anesthesia, surgical preparation, and mounting of the animal on the stage of the microscope system. Fluorescent probes are administered to the animal, followed by image acquisition for a period of up to 3 hr. In many cases, the animal is then euthanized, or in the case of survival surgery techniques, they may be surgically closed and allowed to recuperate. Images are transferred via a high-speed network to specialized computer systems for digital image analysis.
As described below, this general approach can be used with different combinations of fluorescent probes to evaluate processes such as glomerular permeability, proximal tubule endocytosis, microvascular flow, vascular permeability, mitochondrial function, and cellular apoptosis/necrosis.
Image Capture
While much of the problem of sample movement can be minimized through proper surgical preparation and mounting of the kidney, best results are generally obtained when images are captured at a high rate, which for the authors' systems is limited to around 1 frame per second for a 512-by-512 frame. This frame rate is typically high enough to freeze residual levels of sample movement, and to capture moderately fast dynamic events such as glomerular filtration, but not fast enough to capture processes such as blood flow or vascular leakage. For these faster processes, the rate of image capture can be increased by limiting the number of lines scanned (scanning a smaller region). Frame rate increases almost linearly as the number of scanned lines decreases. At the limit, one may collect an “image” of a single line in the sample. These “line scan” images can be captured at a rate of more than 480 lines per second. As outlined below, this approach can be used to capture the dynamics of a process traversing along the axis of the line scan, such as blood flow or vascular leakage.
The choice of excitation wavelength is dictated by the probes being used. For the assays described here, imaging can be conducted using excitation wavelengths centered at 800 nm.
Basic Protocol 1
Glomerular Permeability
The superficial glomeruli of Munich-Wistar rats allow microscopic imaging of the capillaries and Bowman's space of individual glomeruli. The process of glomerular filtration is apparent in the intravital image shown in Figure 12.9.1. This figure shows a multiphoton optical section of the kidney of a rat injected with Hoechst 33342 to label nuclei (blue), a 500-kDa dextran–Alexa 488 (green) that is retained in the vasculature, and a 5-Kda dextran-rhodamine (red) that is rapidly filtered, appearing first in the Bowman's space (center), then in the proximal tubules (top), and finally concentrating in the distal tubules (bottom left). For evaluation of altered glomerular permeability, a probe closer to threshold size of permeability, such as a 40,000-Da dextran, will provide a more sensitive indicator.
Figure 12.9.1.

Intravital assay of glomerular permeability. This figure shows a multiphoton fluorescence optical section of the kidney of a living rat injected with Hoechst 33342 to label nuclei (blue), a 500-Kda dextran–Alexa 488 (green) that is retained in the vasculature, and a 5-Kda dextran-rhodamine (red) that is rapidly filtered, appearing first in the Bowman's space (center), then in the proximal tubules (top), and finally concentrating in the distal tubules (bottom left). The field of view is 200 μm across. For the color version of this figure go to http://www.currentprotocols.com/protocol/cy1209.
Materials
Animal (Support Protocol)
70,000-Da dextran–Alexa 488 (see recipe)
40,000-Da dextran-rhodamine (see recipe)
Isotonic saline, sterile
10 mg/ml Hoechst 33342 (Invitrogen)
Additional reagents and equipment for animal preparation (Support Protocol)
Prepare the animal (see Support Protocol).
Prepare a mixture of 70,000-Da dextran–Alexa 488 and 40,000-Da dextran-rhodamine (1 mg/kg of each in 0.5 ml sterile, isotonic saline). Adjust the laser power and detectors such that the signals in the two channels are similar, and below saturation.
- Inject Hoechst 33342 (1 mg/kg in 0.5-ml of sterile, isotonic saline) intravenously. Collect images in blue, red, and green channels.
- Images collected in red and green channels will serve as “background” images.
After ∼10 min, find a suitable glomerulus for analysis. Ensure that the animal and the field are stable.
Rapidly inject 70,000-Da dextran–Alexa 488 and 40,000-Da dextran-rhodamine (1 mg/kg each in 0.5 ml of sterile, isotonic saline) intravenously.
Starting immediately after injection, collect images of the glomerulus every second for a period of 2 min.
-
Determine the permeability of the 40,000-Da relative to that of the 70,000-Da dextran by measuring, at each point in time, the fluorescence of each in the capillaries and Bowman's space of the glomerulus. These quantities can then be expressed as a “generalized polarity” measurement that varies from +1 to −1 (Yu et al., 2005), by the following equation:
where I = the measured signal intensity minus the background, as measured in the corresponding channel of the background images. The relative glomerular permeability is then measured as the difference between the GP measured in the glomerulus and that measured in the original solution.- Alternatively, the permeability of a single glomerulus may also be quantified from the relative fluorescence of a single, freely filtered probe in the capillaries versus the Bowman's space under conditions of constant probes infusion. The authors have found that this technique yields results nearly identical to those obtained through equilibrium dialysis (Tanner et al., 2004; Russo et al., 2007).
Basic Protocol 2
Proximal Tubule Endocytosis
One of the primary functions of the renal proximal tubules is to scavenge small- to medium-sized, biologically important compounds that are freely filtered before their loss to urinary excretion, through the process of endocytosis. Intravital multiphoton microscopy is capable of detecting uptake of luminal filtrate into individual endosomes, and to quantify endocytic uptake. This approach has recently been used to illuminate unforeseen aspects of albumin transport in the kidney. Using the approach described above, Russo et al. (2007) determined that 30 to 50 times more albumin is filtered by the glomerulus than previously predicted from urinalysis. However, intravital studies demonstrated that nearly all of the filtered albumin is rapidly and effectively reclaimed via endocytosis by proximal tubule cells, particularly in the S1 segment. An example of the use of fluorescent dextrans to characterize proximal tubule endocytosis is shown in Figure 12.9.2.
Figure 12.9.2.

Intravital assay of proximal tubule endocytosis. This figure shows a projection of multiphoton fluorescence images of the kidney of a living rat injected with Hoechst 33342 and a 3000-Da dextran–Cascade Blue, and then with a 3000-Da dextran–Texas Red 1 hr later. The image shown was collected 10 min following injection of the dextran-Texas Red. In this image, the Texas Red–dextran has progressed only as far as early endosomes, distributed in the apex of the proximal tubule cells (red puncta), whereas the Cascade Blue–dextran is seen in distinct, basally localized compartments, reflecting the progression of this probe into later endocytic and lysosomal compartments. Note the absence of endocytic uptake by the epithelial cells of the distal tubule on the right. Scale bar is 20 μm. For the color version of this figure go to http://www.currentprotocols.com/protocol/cy1209.
Materials
Animal (see Support Protocol)
3,000-Da fluorescent dextran (see recipe), 10,000-Da fluorescent dextran (see recipe), or fluorescent bovine serum albumin (see recipe)
Isotonic saline, sterile
Additional reagents and equipment for animal preparation (Support Protocol)
Prepare the animal (see Support Protocol).
Acquire images of the kidney prior to infusion of any compound to characterize the autofluorescence associated with the lysosomes of proximal tubules (particularly important if planning quantitative studies).
- Depending on the study design, infuse 0.8 to 1.6 mg of a fluorescent dextran in 0.5 ml sterile, isotonic saline; be sure to flush the access line with saline to clear compound from the dead space in the line. Follow uptake and internalization closely for up to 1 hr.
- It is important to carefully monitor acquisition parameters for quantitative studies, since probes will rapidly accumulate in endosomes and lysosomes, and can result in saturating signal levels.
Quantify endocytic uptake from the increase in punctate endocytic fluorescence (using a median filter to remove background fluorescence) as a function of time in a series of images collected from the same field.
Basic Protocol 3
Vascular Flow
Peritubular and glomerular blood flow has an intrinsic relationship with tubular function and glomerular filtration, respectively. More than 30 years ago Steinhausen and coworkers (1973) utilized intravital videomicroscopy to examine peritubular blood flow on the cortical surface of the kidney. The greater imaging depths possible with multiphoton microscopy provide a less invasive method for examining the renal microvasculature and vascular blood flow beyond the surface of the cortex.
Materials
Animal (Support Protocol)
Fluorescent 500,000-Da dextran (see recipe) or fluorescent bovine serum albumin (see recipe)
Additional reagents and equipment for animal preparation (Support Protocol)
Prepare the animal (see Support Protocol).
Inject fluorescent-labeled 500,000-Da dextran (10 to 15 mg/kg using undiluted stock solution) or albumin (∼1 mg/kg using undiluted stock solution) intravenously.
- Obtain a line scan (oriented parallel to the vessel walls) in the center of the lumen of the vessel of interest (Fig. 12.9.3), collected over a period of several seconds.
- Several such vessels may be analyzed, although it is critical to choose for comparison vessels that are of equal diameter.
Analyze line-scan data to determine flow as previously described (Kleinfeld et al., 1998; Ogasawara et al., 2000; Brown et al., 2001; Yamamoto et al., 2002; Kang et al., 2006) based upon the measured slope of the RBC tracks.
Figure 12.9.3.

Measurement of microvascular blood flow. Rhodamine-labeled albumin was infused by bolus injection into the jugular vein of an animal, and an area of interest in the kidney was imaged by multiphoton microscopy. (A) A line scan was performed along the central axis of the vessel of interest (white line) continuously at a rate of 2 msec per line for 1 sec (500 lines total). Flowing red blood cells, which exclude the fluorescent probe, appear as black objects. (B) The line scans were combined into a single image in B, resulting in an image in which the vertical axis represents time (the 1-sec interval of line-scan collection), and the horizontal axis represents distance (the length of the scan). Thus, the dark lines in panel B reflect the passage of blood cells along the linescan over time, and the velocity of each can be determined by measuring the slope of the line (Δd/Δt) as described by Kang et al. (2006). Field of view is 70-μm across.
Basic Protocol 4
Vascular Permeability
Alteration in vascular permeability has important pathophysiological consequences in conditions such as inflammation and ischemia-reperfusion injury. Multiphoton microscopy provides a noninvasive method to examine vessel permeability deeper than the surface of the kidney.
Materials
Animal (Support Protocol)
Fluorescent 500,000-Da dextran (see recipe)
Fluorescent 10,000-Da dextran, 40,000-Da dextran, 70,000-Da dextran,150,000-Da dextran (see recipe), or fluorescent-labeled bovine serum albumin (see recipe; choice of probe will depend upon the intrinsic permeability of the vessel of interest)
Additional reagents and equipment for animal preparation (Support Protocol)
Prepare the animal (see Support Protocol).
- Inject fluorescent 500,000-Da dextran (10-15 mg/kg) intravenously.
- This probe will be used to define the vascular space.
Determine the vessel of interest for permeability study and obtain a “pre” image (512-by-128 frame).
Rapidly inject fluorescent-labeled low-molecular-weight dextran (15 to 30 mg/kg in an appropriate volume of sterile, isotonic saline, 0.01 to 0.03 ml for mice and 0.1 to 0.2 ml for rats) intravenously.
Simultaneous with the dextran injection, begin obtaining a rapid time-series collection (1 to 2 frames/second) of the vessel of interest (Fig. 12.9.4).
- Measure vessel permeability utilizing a method previously described by Brown et al. (2001), in which the fluorescence level along a line perpendicular to the vessel is measured as a function of time or by a ratiometric method comparing the change in fluorescent intensity of a region outside the vessel to the change in fluorescent intensity of an adjacent region in the lumen of the vessel over time, as described by Yu et al. (2005).
- Alternatively, if the permeability defect is large enough that larger molecular-weight probes get trapped in the perivascular space, then images of multiple vascular fields can be collected during the experiment and a digital grid can be placed over the image. Permeability can be measured by determining the number of grid segments demonstrating leakage of the fluorescent probe (Sutton et al., 2003).
- It is very useful to optimize the amount and size of the fluorescent probe to be injected in a set of preliminary experiments on the individual setup to be used. The goal is to deliver sufficient probe to the vessel of interest such that the amount leaked from the vessel results in a rapidly detected signal that can be measured, but does not result in saturation of signal levels in the vascular space.
Figure 12.9.4.

Measurement of vascular permeability. (A) A rhodamine-labeled (red) dextran (500,000 Da) was infused by bolus injection into the jugular vein of an animal and a renal microvessel of interest was imaged by multiphoton microscopy to determine the vascular space. This was followed by the bolus injection of a fluorescein (green)-dextran (10,000 Da). The vessel of interest was imaged every 0.45 sec after injection of the fluorescein-dextran. (B) Representative image from this time series. The permeability of the vessel can be measured by integrating the fluorescence intensity along a line perpendicular to the vessel as described by Brown et al. (2001). Indicated lines reflect a distance of 3 μm. For the color version of this figure go to http://www.currentprotocols.com/protocol/cy1209.
Basic Protocol 5
Mitochondrial Function
A number of fluorescent probes, such as rhodamine B hexyl ester, accumulate in compartments on the basis of membrane potential (Fig. 12.9.5). These probes, commonly used to label mitochondria in studies of cultured cells, can also be utilized for intravital fluorescence studies. Following intravenous injection rhodamine B hexyl ester rapidly accumulates in the mitochondria of vascular and circulating cells, but does not label renal tubular cells.
Figure 12.9.5.

Intravital assay of mitochondrial function. Metabolically active mitochondria of vascular and circulating cells can be labeled by intravenous injection of rhodamine B hexyl ester. In this figure, mitochondrial accumulation is seen as bright red labeling adjacent to the characteristically flattened nuclei of the endothelia of the intertubular capillaries (arrowheads), many of which have been imaged en face in this optical section (ef), and glomerular capillaries (arrow). The vasculature was labeled with a large 500,000-Da fluorescein-dextran, nuclei were labeled with Hoechst 33342, and the proximal tubules above and below the glomerulus were previously labeled with 3,000-Da dextran–Texas Red and dextran–Cascade Blue, sequentially, giving the unique staining pattern. (Bar = 10 μm). For the color version of this figure go to http://www.currentprotocols.com/protocol/cy1209.
Materials
Animal (Support Protocol)
5 mg/ml rhodamine B hexyl ester in dimethylformamide (DMF), anhydrous (store wrapped in foil ≤6 months at −20°C)
Isotonic saline, sterile
Hoechst 33342 to label nuclei (optional)
Additional reagents and equipment for animal preparation (Support Protocol)
Prepare the animal (see Support Protocol).
- Prepare 1 ml of a 5 μg/ml working concentration of rhodamine B hexyl ester in sterile, isotonic saline.
- For a standard 200 to 250 g rat, this should be enough for 5 to 8 doses or more.
- The target dilution in the plasma (not total blood volume) is about the same as in cell culture, 0.1 μg/ml. Assuming that a rat this size will have ∼10 to 12 ml of blood, half of which will be plasma (∼5 ml), each 100 to 200 μl working concentration should achieve sufficient labeling.
Infuse Hoechst solution to label nuclei and wait ∼5 to 10 min for complete incorporation.
- While viewing an area through the eyepiece, infuse in the rhodamine B hexyl ester solution.
- An immediate flush of red fluorescence will be visible followed by incorporation into the endothelia and circulating white cells over a period of ∼20 to 30 sec.
Basic Protocol 6
Apoptosis
Apoptosis is a fundamental process in tissue development and injury. The nuclei of all the cells of the kidney can be easily labeled and imaged intravitally, using blue-fluorescing DNA-binding Hoechst 33342 injected intravenously to label nuclei. The authors have found that nuclear morphology can be reliably used to evaluate apoptosis in vivo (Dunn et al., 2002; Kelly et al., 2003; see Fig. 12.9.6). In addition, Hoechst 33342 can be combined with propidium iodide, a red-fluorescing DNA-binding probe, to assay apoptosis and necrosis simultaneously. Unlike Hoechst 33342, which is membrane permeant, propidium iodide is membrane impermeant and so labels only nuclei of cells whose plasma membrane is disrupted, as during necrosis.
Figure 12.9.6.

Apoptosis and necrosis. Apoptotic cells can be identified by their characteristically fragmented nuclear morphology, using Hoechst 33342 to fluorescently label nuclei. (A) Optical section collected from a living rat previously given a cecal ligation and puncture injury. This animal was injected with Hoechst, as well as a large green dextran (labeling vasculature) and a small red dextran (labeling tubule lumens and endosomes). Arrows indicate a few of the apoptotic tubular cells imaged in this field. (B) Corresponding image from an untreated animal. The nuclei in this image are characteristically regular in shape, and labeled less intensely with Hoechst 33342. Fields are 100 μm in diameter. For the color version of this figure go to http://www.currentprotocols.com/protocol/cy1209.
Materials
Animal (Support Protocol)
Hoechst 33342
Propidium iodide
Isotonic saline, sterile
Additional reagents and equipment for preparing the animal (Support Protocol)
Prepare the animal (see Support Protocol).
- Collect images in blue, red, and green channels.
- These images will serve as “background” images.
Inject Hoechst 33342 and propidium iodide (1 mg/kg and 50 μg/kg, respectively, combined in 0.5 ml sterile, isotonic saline) intravenously.
After ∼15 min, find a suitable field for analysis. Ensure that the animal and the field are stable and collect images in red, green, and blue channels.
- Score apoptosis and necrosis by visual inspection of the images.
- Healthy cells are characterized by nuclear labeling by Hoechst, but not propidium iodide, with an intact, regular nuclear morphology. Primary apoptotic cells are characterized by a fragmented nuclear labeling with Hoechst, but not propidium iodide. Necrotic cells are characterized by nuclear labeling with both Hoechst and PI, and an intact, regular nuclear morphology. Apoptotic cells with secondary necrosis are characterized by nuclear labeling with both Hoechst and PI, and a fragmented nuclear morphology. Thus rates of apoptosis, necrosis, and apoptosis with secondary necrosis can be scored as the fraction of cells per field observed, and categorized by cell type, tubular segment, and so on.
Support Protocol
Anesthesia and Surgical Creation of a Retroperitoneal Surgical Window for Intravital Imaging
The surgical procedure described is for a nonsurvival surgery (image acquisition is the terminal experiment). Appropriate steps need to be taken to insure rigorous sterile technique if animal survival following image acquisition is planned.
Materials
Animal to be imaged
5% (v/v) and 2% (v/v) isoflurane/oxygen mixtures
Pentabarbital (optional)
Buprinorphine
Germicidal soap
0.9% sterile saline, prewarmed
Appropriate probes
Anesthesia induction chamber (Braintree Scientific)
Homeothermic table (Braintree Scientific)
Rectal probe (Braintree Scientific)
Electric clippers
Vascular catheters (PE-60 tubing for rats and PE-50 tubing for mice; Becton Dickinson)
Kidney cup
Surgical scissors (Braintree Scientific)
Appropriate temperature control devices (e.g., circulating water blanket attached to a temperature-controlled circulating water bath, Repti Therm heating pad)
Prepare the animal for surgery
- Place the animal to be imaged into an anesthesia induction chamber containing a 5% isoflurane/oxygen mixture.
- General anesthesia with intravenous anesthetic agents is an alternative approach.
After initial anesthesia is obtained, rapidly move the animal from the induction chamber to a clean surgical area on a homeothermic table. Maintain anesthesia with a 2% isoflurane/oxygen mixture titrated to effect.
Inject 0.05 mg/kg buprinorphine subcutaneously.
Shave the left flank area and any areas requiring vascular catheter insertion (i.e., neck for internal jugular, inner thigh for femoral) using electric clippers. Cleanse the respective areas with germicidal soap and water and then towel dry.
Insert rectal probe for temperature monitoring.
Perform surgery
Make a small incision (using surgical scissors) over the desired vessels to be accessed and insert the appropriate vascular catheters (PE-60 tubing for rats and PE-50 tubing for mice).
- Make a 0.5- to 1-cm incision (using surgical scissors) in the left flank through the retroperitoneum to expose the left kidney.
- For utilizing a kidney cup on an upright system make a 1.5- to 2.0-cm incision.
- Move the animal to the microscope stage and position the left kidney covered with prewarmed saline next to the objective while maintaining appropriate anesthesia.
- For inverted systems, this requires laying the animal over the objective with the kidney in contact with the objective (Fig. 12.9.7); for upright systems, this can best be achieved by placing the kidney in a kidney cup attached to a support pole that holds the kidney stable in the animal (Fig. 12.9.8).
- Employ appropriate temperature control devices.
- For inverted systems, this can be accomplished by covering the animal in a circulating water blanket attached to a temperature-controlled circulating water bath and two Repti Therm heating pads placed beneath the rat (one below the head and one below the thighs, as close to the coverslip dish as possible to maximize contact with the rat); for an upright system, this can be accomplished by utilizing a customized heated stage cover–typically an aluminum stage cover attached to a temperature-control device–or enclosing the entire system in a heated chamber.
Introduce appropriate probes via intravenous injection, making sure to flush dead space of catheter.
Monitor depth of anesthesia, core body temperature, and blood pressure (if desired) during image acquisition.
Figure 12.9.7.

A schematic diagram of the arrangement for imaging a living rodent on an inverted microscope. The kidney of a living rat or mouse can be imaged on an inverted microscope stand by placing the kidney into an isotonic saline–filled 50-mm cell-culture dish whose bottom has been replaced with a no. 1.5 coverslip. As shown, the rat lies on its side on a heated microscope stage, wrapped in a heating pad. (Two Repti Therm heating pads placed beneath the head and legs are not shown). The kidney is thus gently pressed against the coverslip, so that it may be imaged by the objective located below the microscope stage.
Figure 12.9.8.
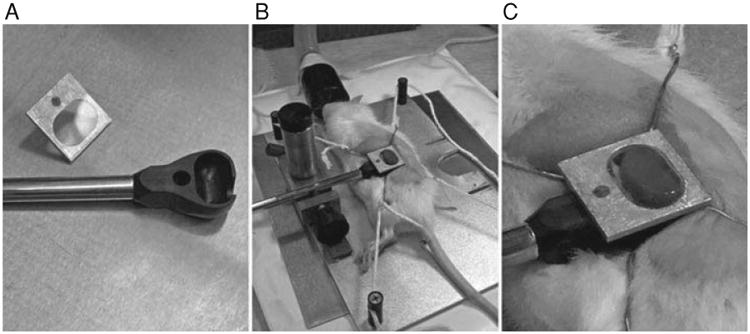
In order to image the kidney of a living animal with an upright microscope, the kidney must be supported in a kidney cup. The kidney cup can be fashioned out of thin plastic or metal. It is critical that the cup be small enough to fit within the animal and positioned around the kidney in such a way that blood flow to the kidney is not significantly altered (i.e., by placing excessive tension on the renal pedicle). (A) The kidney cup (black) is mounted on a support rod. A coverglass, mounted on an aluminum bracket, is attached to the top of the cup, after insertion of the kidney. (B) Following surgery, the kidney of a living rat is placed into the kidney cup, whose support rod is attached to an adjustable support structure. (C) Close-up of the kidney cup in position.
Reagents and Solutions
Use deionized, distilled water in all recipes and protocol steps. For common stock solutions, see Appendix 2A; for suppliers, see Suppliers Appendix.
Bovine serum albumin (conjugated to fluorescent label of choice; see dextrans recipe for fluorescent conjugates)
10 mg/ml in 0.9% sterile saline
Store fluorophore-conjugated albumin wrapped in foil ≤1 month at 4°C
Dextrans (3,000-, 10,000- 40,000-, 70,000-, and 500,000-Da dextrans conjugated to fluorescent label of choice)
3,000, 10,000, 40,000, 70,000-Da and 150,000-Da fluorescently conjugated (see below) dextrans: 20 mg/ml in 0.9% sterile saline
500,000-Da fluorescently conjugated (see below) dextran: 8 mg/ml in 0.9% (w/v) sterile saline, dialyze 5 to 10 ml using a 10,000 MWCO membrane against 0.9% (w/v) sterile saline (5 liters) overnight at room temperature
Store all fluorophore-conjugated dextrans wrapped in foil ≤1 month at 4°C
Fluorescent conjugates
Fluorescent conjugates may be either purchased directly or prepared using reactive fluors. The choice of fluor to use for multiphoton microscopy is never obvious. Very few probes have been characterized for multiphoton microscopy, and the simple rule of doubling the one-photon excitation wavelength for two-photon excitation is seldom effective. The authors have obtained excellent results using fluorescent conjugates prepared with fluorescein, rhodamine, Texas Red, and Cascade Blue using excitation wavelengths centered at 800 nm.
Commentary
Background Information
Intravital microscopy is a powerful research technique that brings the speed, temporal resolution, and multiparameter capabilities of microscopy to the study of intact, living organisms. Thus, powerful microscopy approaches previously limited to studies of cultured cells may be applied to study of cell biology in physiological, differentiated cells in the relevant context of the living organism, with all systemic interactions intact.
Intravital microscopy has been applied to studies of the kidney for nearly 100 years. In part this reflects the ease with which the kidney can be presented to the microscope objective lens, combined with the wealth of microvascular and tubular processes that can be easily imaged at the surface of the cortical surface of the kidney. Microscopic analysis of kidney function in vivo is also facilitated by the fact that many of the functions of the kidney are easily evaluated using probes introduced intravenously, or into tubule lumens via micropuncture. An excellent review of the use of intravital microscopy for studies of kidney function is found in Steinhausen and Tanner (1976).
Intravital microscopy is enjoying a renaissance, thanks to the development of multiphoton microscopy (Denk et al., 1990; Denk and Svoboda, 1997; Zipfel et al., 2003; Dunn and Young, 2006). This technique, which depends upon the simultaneous absorption of two infrared photons by a fluorophore, resulting in spatially localized fluorescence excitation, is capable of collecting high-resolution (0.4 μm) fluorescence images deep into tissues (Centonze and White, 1998). In addition to providing better penetration and resolution than traditional methods of microscopy, the use of infrared light also makes multiphoton microscopy significantly less toxic to living systems (Squirrell et al., 1999). Thus, multiphoton has been used to extend the reach of intravital fluorescence microscopy hundreds of microns into the tissues of intact, living animals, with minimal damage.
Intravital multiphoton microscopy has been applied to analyze skin structure (Masters et al., 1997), angiogenesis, blood-flow and tumor-cell dynamics in skinfold preparations (Brown et al., 2001; Condeelis and Segall, 2003), and blood flow, neural development, and neural activity in the superficial layers of the brain (Denk and Svoboda, 1997; Svoboda et al., 1997; Kleinfeld et al., 1998; Helmchen et al., 1999). More recently, intravital multiphoton microscopy has been combined with surgical procedures to allow for imaging of internal organs. For example, multiphoton microscopy was applied by Miller et al. (2003) in studies of T cell trafficking in lymph nodes of mice, Watson et al. (2005) in studies of epithelial barrier function in vivo in the mouse intestine, and te Velde et al. (2005) in studies of tumor-cell adhesion in the liver of living mice. Recent reviews of the use of intravital multiphoton microscopy for studies of immune cell traffic and neural function can be found in Cahalan and Parker (2006) and Svoboda and Yasuda (2006), respectively.
With respect to studies of the kidney, investigators of the nephrology group at Indiana University have used intravital multiphoton microscopy to analyze necrosis and apoptosis (Kelly et al., 2003), microvascular function (Sutton et al., 2003, 2005), proximal tubule transport (Tanner et al., 2004), proximal tubule uptake of folate (Sandoval et al., 2004), glomerular permeability (Yu et al., 2005), and albumin filtration and reabsorption by the proximal tubule (Russo et al., 2007). Peti-Peterdi has applied intravital multiphoton microscopy to analyze renin dynamics in vivo (Toma et al., 2006) and fluid flow in the juxtaglomerular apparatus (Rosivall et al., 2006). Overviews and reviews of the use of intravital multiphoton microscopy for studies of renal function can be found in Dunn et al. (2002), Molitoris and Sandoval (2005), and Kang et al. (2006).
Special equipment
Microscope system
While intravital microscopy of the kidney can be conducted with nearly any kind of epi-illumination microscope system, the need for optical sections favors either confocal or multiphoton microscopy. Multiphoton microscopy has several advantages over confocal microscopy, supporting deeper imaging into scattering tissues (Centonze and White, 1998; Konig, 2000) with minimal adverse physiological and photophysical effects (Squirrell et al., 1999). Once the province of specialized laboratories, multiphoton microscope systems are now commercially available from a number of companies. Alternatively, numerous investigators have successfully built their own systems, allowing them to customize the system according to their specific needs (Majewska et al., 2000; Nguyen et al., 2001; Muller et al., 2003). In many cases, multiphoton microscope systems can be adapted from existing confocal microscope systems with relatively minor modifications.
Microscope systems can be configured in either an upright design, in which the microscope objective is located above the stage, or an inverted design, in which the microscope objective is located below the stage. Both systems may be used to image the kidney of living animals, as will be described below.
Microscope objective lens
Multiphoton microscopy of the kidney places unique requirements on the microscope objective. Objective lenses may be designed for use with a coverslip, or in the case of “dipping objectives,” designed for use without a coverslip. Imaging with an inverted microscope obviously requires the use of a coverslip. While dipping objectives can be used with upright microscopes, the authors have found that the normal curvature of the kidney is such that it limits the region that can be imaged to a small region at the apex of the exposed kidney. A much larger region of the kidney may be imaged when its surface is gently depressed with a coverslip. Thus, the authors almost exclusively use objective lenses designed for use with a coverslip.
A large numerical aperture (NA) is important not only for resolution, but also for efficient multiphoton excitation of fluorescence. On the other hand, high-NA objectives show a steep attenuation of signal with depth, owing to a greater susceptibility to spherical aberration, as results from refractive index mismatch. The refractive index of the kidney has been estimated at ∼1.4, which is intermediate between that of water and glass. Accordingly, the refractive index of the immersion medium differs from that of the kidney with either water- or oil-immersion objectives. In both cases, this mismatch results in spherical aberration that increases with depth, significantly reducing multiphoton excitation. However, both oil- and water-immersion objectives have been used to collect images up to 150 μm into the kidney of living animals (Dunn et al., 2002; Kelly et al., 2003; Sutton et al., 2003; Sandoval et al., 2004; Tanner et al., 2004; Molitoris and Sandoval, 2005; Sutton et al., 2005; Yu et al., 2005; Kang et al., 2006; Rosivall et al., 2006; Toma et al., 2006; Russo et al., 2007). Other considerations include sufficient working distance, and transmission of the infrared (IR) wavelengths of light used for multiphoton fluorescence excitation. Whereas multiphoton microscopy has in the past been hampered by objectives with poor IR transmission, this problem has been addressed in recent designs optimized for transmission of the IR wavelengths used in multiphoton microscopy.
Laser system
Multiphoton microscopy requires a specialized laser capable of providing very powerful, very brief pulses of IR light. Most systems employ titanium-sapphire lasers, which are tunable across a wavelength range from around 700 to 1050 nm. These systems typically provide highest power at intermediate wavelengths, but are nonetheless useful in that they can be tuned to optimize particular fluors. A simpler alternative is the neodymium laser, which provides a single 1047-nm excitation wavelength. Titanium-sapphire lasers may be configured to provide pulses of picosecond duration (picosecond lasers), and of 100- to 300-fsec durations. While picosecond lasers are capable of multiphoton excitation, femtosecond lasers are generally preferred, owing to the fact that they stimulate more fluorescence for the same average power delivered to the tissue.
While it may be argued that power is not limiting in multiphoton microscopy and that the laser systems provide many times more power than is necessary to saturate fluorophores, laser power can become limiting at depth in tissues. Owing to scattering, absorption, and spherical aberration, much of the illuminating light fails to reach the focus at depth in tissue. For this reason, the authors frequently find that stimulation of satisfactory levels of fluorescence at depth requires the delivery of >50 mW at the surface of the kidney. Given the 80% to 90% losses of illumination in the optical system, it is thus important to obtain a laser system providing at least 700 mW of power (at a wavelength of 800 nm).
Multiphoton laser systems are actually simpler than confocal microscopes, but until recently their use was complicated by the fussy laser systems. In the past 5 years, this problem has essentially disappeared with the development of “closed-box,” computer-controlled laser systems that seldom require attention from the user.
Fluorescence detection systems
Because fluorescence excitation is spatially constrained in multiphoton fluorescence microscopy, fluorescence emissions must only be collected, rather than imaged. Thus, large-area detectors may be used to collect both ballistic and scattered emissions. The efficiency of collection of scattered photons is increased as the distance to the detector is reduced, and thus the most efficient systems are designed with “nondescanned” detectors located as close as possible to the plane of the back aperture of the objective lens. In modified confocal microscope systems, it is also possible to collect emissions via the same descanned detectors used for confocal microscopy. However, these systems sacrifice sensitivity in the inevitable losses of light in the descanning optics, and losses of scattered light in the elongated light-path.
Light collection may be split among multiple photomultiplier tubes, so that multiple colors of fluorescence may be imaged simultaneously. Although these systems suffer from significant between-channel crosstalk, owing to the simultaneous excitation of multiple fluors, they are invaluable to intravital microscopy. Such systems support ratiometric measurements, comparisons of multiple parameters, and independent labeling of structures for identification and processes for functional analysis, and also facilitate identification of tissue autofluorescence, which has a characteristic, multichannel spectral signature. While most systems can be equipped with detectors on both the epi- and trans-illumination sides of the sample, only detectors on the epi-illumination pathway will be capable of collecting fluorescence from the kidney of a living animal.
Adaptations of the microscope stage for imaging living animals
The primary considerations for imaging living animals pertain to presenting the tissue within the narrow range of the microscope objective, immobilizing the tissue, and maintaining the tissue and the animal itself at physiological temperature. The stage of most microscopes is typically large enough to support rats and mice. Special stages and alternative microscope designs must be used for larger animals.
For an upright microscope, the kidney must be presented and immobilized via a custom-designed “kidney cup,” into which the exteriorized kidney is placed (Fig. 12.9.8). For an inverted microscope, the exteriorized kidney is placed into a 50-mm-diameter cell-culture dish whose bottom has been fitted with a number 1 1/2 coverslip (Warner Instruments), filled with saline (Figure 12.9.7). The specifics of each of these methods are presented below.
Anesthetized animals require auxiliary sources of heat to maintain their body temperature. The authors typically accomplish this by topically warming the animal with a heated water jacket (TPZ-1215VF on a TPZ-747 Micro-Temp LT circulation pump, Kent Scientific, Torrington) and heating the stage with a surface heater [an aluminum plate fitted with two Kapton heat mats (Cole-Parmer) controlled with a custom-built TET-612 temperature controller, and a T-type thermistor probe]. When using immersion objectives, it is critical to heat the objective lens, which can otherwise act as a local heat sink, thus cooling the tissue in proximity to the objective lens. The authors are currently using OW series objective warmers along with TC124 controllers (Warner Instruments). Alternatively, the entire microscope stage may be enclosed in a heated chamber. This second alternative heats both the animal and the objective lens, and provides excellent temperature control, but complicates access to the animal during the course of imaging.
Equipment for preparing and maintaining animals
Generally, the standard surgical equipment utilized in small animal surgery is sufficient for preparing rodents for intravital microscopy. PE-50 or PE-60 hollow tubing is a useful size for intravenous (internal jugular, femoral) and intra-arterial (femoral) catheters placed for probe delivery and animal monitoring. A calibrated anesthetic vaporizer and a closed anesthesia circuit with a rubber diaphragm that fits snugly over the snout of the animal is required if inhaled anesthetics are to be used. A charcoal canister attached to the exhalation vent of the anesthesia circuit is necessary for scavenging volatile anesthetic waste. Requisite equipment to adapt the microscope stage for intravital imaging is discussed in the preceding section.
Once the animal is appropriately positioned on the stage, monitoring the animal's depth of anesthesia, core temperature, and blood pressure during imaging are important considerations. The depth of anesthesia can be sufficiently monitored by visual inspection of respiration rate, peripheral perfusion, and the lack of withdrawal reflexes following tail or leg pinch. A rectal temperature probe coupled to a thermometer is a customary method to monitor the animal's core temperature. Blood pressure can be monitored with a transducer/amplifier system attached to a femoral artery catheter or by commercially available noninvasive blood-pressure monitoring devices.
Equipment for digital image analysis
When combined with digital image analysis, multiphoton microscopy is capable of being a truly quantitative tool. Since image analysis is a time-consuming task, it is generally most expedient to perform image analysis on a separate computer system dedicated to image analysis, rather than conducting image analysis on the computer associated with the microscope system. Owing to the recent development of inexpensive, powerful personal computer systems, it is not difficult to find a computer system capable of conducting most forms of image analysis. That said, multiphoton microscopy is capable of generating enormous datasets—image volumes consisting of 200 image planes in three channels are not uncommon and when digitized to 12 bits occupy more than 300 Mb of memory. The memory requirements increase for many forms of image analysis in which multiple copies of an image volume may need to be stored and for stud-ies conducted in time series. In a world where typical operating systems require >100 Mb of memory, it is clear that users should configure systems with as much memory as their systems will accommodate. Image-analysis systems thus also need to be configured with sufficient storage for large numbers of such data sets, as well as a system for archiving data to digital video disk or some alternative.
Suitable image-analysis software is available for purchase commercially, or via shareware. For routine, quantitative analysis the authors' group favors the commercial Metamorph image-analysis software and the ImageJ freeware. For volumetric analysis, the group utilizes the commercially available Amira program, and Voxx, shareware that was developed in-house.
Critical Parameters and Troubleshooting
Animal support considerations and problems
Alterations of core temperature and blood pressure can have a significant impact upon the processes examined by the protocols outlined in this unit. Consequently, monitoring and controlling these two parameters throughout the image acquisition process as previously outlined is essential.
Stability of the sample
The ability of multiphoton microscopy to provide sub-micron resolution depends critically upon minimizing the effects of even the most subtle body movements. In large part, this can be accomplished by ensuring adequate anesthesia. However, significant movement of the microscopic field can result from respiration and the heartbeat. These factors can be minimized through optimizing the plane of anesthesia and utilizing a kidney cup to mechanically isolate the kidney in the animal. As a last resort, adhering the kidney to the coverslip via a cyanoacrylate adhesive can aid in further diminishing motion artifact. The effects of motion can also be reduced by minimizing the time during which each image is collected. In practice, the authors try to collect images at no less than one frame per second.
Effects of injection of probes
In general, the probes utilized in these protocols are inert and have minimal interaction with other homeostatic mechanisms in the animal. The probes can be rapidly injected (over the course of seconds) in small volumes (<100 to 200 μl) without significant alterations in animal stability.
Fluorescence bleedthrough
Owing to the need for high-speed image capture and to the fact that changing excitation wavelengths is a relatively slow process with current laser technology, most multi-parameter studies involve the simultaneous collection of the fluorescence of multiple fluors excited by a single excitation wavelength. This approach almost inevitably leads to “bleed-through” of fluorescent signals between channels, typically where a fraction of the emissions of one fluor is collected in the channel intended to collect those of a fluor emitting at a longer wavelength. To some extent, this problem can be minimized through the use of probes whose fluorescence distributions are known to be distinct from one another. So, for example, while the blue fluorescence of Hoechst bleeds into the channel collecting the green fluorescence of a fluorescein dextran in the vasculature, no bleedthrough will be found in the image of the vascular lumen, and the appearance of nuclear fluorescence in the green detector channel is not confusing. When it is not possible to design studies in which the distribution of spectrally adjacent signals is distinct, researchers can minimize crosstalk by using short wavelength–emitting fluors for the probe with a weaker signal, and longer wavelength–emitting fluors for the probe with a stronger signal. To some degree, the relative fluorescence of different fluors can be adjusted by shifting the excitation wavelength one direction or the other.
Tissue autofluorescence
Careful choice of fluorescent probes and excitation wavelength can also minimize the consequences of endogenous autofluorescence. So, for example, the authors find that the endogenous autofluorescence of lysosomes of proximal kidney cells can be minimized by shifting the excitation wavelength from 800 to 860 nm. To the degree that such manipulations are not possible, autofluorescence may also be identified by its characteristic spectral signature. The authors find that lysosomal autofluorescence can be identified by its broad spectrum throughout the green-to-red range, when excited at 800 nm.
Anticipated Results
Intravital multiphoton microscopy can be expected to provide high-resolution imaging deep into the kidney of a living rodent with frame rates on the order of one per second. As described above, these studies can yield unique, quantitative evaluations of numerous renal functions. In addition, because of the unique view of renal function provided by this technique, investigators frequently observe unforeseen phenomena beyond those anticipated in the original study design.
Time Considerations
Preparation of the animal for imaging depends upon the technical expertise of the operator. A reasonable estimate of the time from induction of anesthesia to the first image collected is ∼30 min depending on the experiment. Time estimates for image collection depend upon the particular experiment, but animals can be adequately maintained on the microscope stage for 3 hr or more.
Table 12.9.1. Probe Types and Characteristics.
| Probe | Characteristic |
|---|---|
| Hoecsht 33342 | A blue-fluorescing, DNA-binding probe. Membrane-permeant, it labels nuclei of all cells; especially useful in assays of apoptosis. |
| Propidium iodide | A red-fluorescing, DNA-binding probe. Membrane-impermeant, it labels the nuclei of necrotic cells. |
| 3,000-Da dextrana | A bulk probe that, when injected intravenously, is freely filtered by the glomerulus. Used for assays of glomerular permeability and proximal tubule endocytosis. |
| 10,000-Da dextrana | A bulk probe that, when injected intravenously, is freely filtered by the glomerulus, and is somewhat permeant in the vasculature. Used for assays of glomerular permeability, proximal tubule endocytosis, and vascular permeability. |
| 40,000-Da dextrana | A bulk probe that, when injected intravenously, is slowly filtered by the kidney, and is largely impermeant in the vasculature. Used for assays of glomerular permeability, vascular flow, and vascular permeability. |
| 500,000-Da dextrana | A bulk probe that, when injected intravenously, is not filtered by the kidney, but is retained in the vasculature. Used for assays of glomerular permeability, vascular flow, and vascular permeability. |
| Bovine serum albumina | A bulk probe that, when injected intravenously, is very slowly filtered by the kidney, and is largely impermeant in the vasculature. Used for assays of glomerular permeability, proximal tubule endocytosis, vascular flow, and vascular permeability. |
| Rhodamine B hexyl ester | A red-fluorescing probe that accumulates in mitochondria, on the basis of membrane potential. Injected intravenously, it labels the mitochondria of metabolically active endothelial cells. |
Nonfluorescent probes that must be conjugated to fluorophore (see Reagents and Solutions section).
Literature Cited
- Brown EB, Campbell RB, Tsuzuki Y, Xu L, Carmeliet P, Fukumura D, Jain RK. In vivo measurement of gene expression, angiogenesis and physiological function in tumors using multiphoton laser scanning microscopy. Nat Med. 2001;7:864–868. doi: 10.1038/89997. [DOI] [PubMed] [Google Scholar]
- Cahalan MD, Parker I. Imaging the choreography of lymphocyte trafficking and the immune response. Curr Opin Immunol. 2006;18:476–482. doi: 10.1016/j.coi.2006.05.013. [DOI] [PMC free article] [PubMed] [Google Scholar]
- Centonze VE, White JG. Multiphoton excitation provides optical sections from deeper within scattering specimens than confocal imaging. Biophys J. 1998;75:2015–2024. doi: 10.1016/S0006-3495(98)77643-X. [DOI] [PMC free article] [PubMed] [Google Scholar]
- Condeelis J, Segall JE. Intravital imaging of cell movement in tumours. Nat Rev Cancer. 2003;3:921–930. doi: 10.1038/nrc1231. [DOI] [PubMed] [Google Scholar]
- Denk W, Svoboda K. Photon upmanship: Why multiphoton imaging is more than a gimmick. Neuron. 1997;18:351–357. doi: 10.1016/s0896-6273(00)81237-4. [DOI] [PubMed] [Google Scholar]
- Denk W, Strickler JH, Webb WW. Two-photon laser scanning fluorescence microscopy. Science. 1990;248:73–76. doi: 10.1126/science.2321027. [DOI] [PubMed] [Google Scholar]
- Dunn KW, Young PA. Principles of multiphoton microscopy. Nephron Exp Nephrol. 2006;103:e33–e40. doi: 10.1159/000090614. [DOI] [PubMed] [Google Scholar]
- Dunn KW, Sandoval RM, Kelly KJ, Dagher PC, Tanner GA, Atkinson SJ, Bacallao RL, Molitoris BA. Functional studies of the kidney of living animals using multi-color two-photon microscopy. Am J Physiol Cell Physiol. 2002;283:C905–C916. doi: 10.1152/ajpcell.00159.2002. [DOI] [PubMed] [Google Scholar]
- Ghiron M. Uber eine neue Methode mikroskopischer Untersuchung im lebenden Organismus. Zbl Physiol. 1912;26:613–617. [Google Scholar]
- Helmchen F, Svoboda K, Denk W, Tank DW. In vivo dendritic calcium dynamics in deep-layer cortical pyramidal neurons. Nat Neurosci. 1999;2:989–996. doi: 10.1038/14788. [DOI] [PubMed] [Google Scholar]
- Kang JJ, Toma I, Sipos A, McCulloch F, Peti-Peterdi J. Quantitative imaging of basic functions in renal (patho)physiology. Am J Physiol Renal Physiol. 2006;291:F495–F502. doi: 10.1152/ajprenal.00521.2005. [DOI] [PubMed] [Google Scholar]
- Kelly KJ, Sandoval RM, Dunn KW, Molitoris BA, Dagher PC. A novel method to determine specificity and sensitivity of the TUNEL reaction in the quantitation of apoptosis. Am J Physiol Cell Physiol. 2003;284:C1309–C1318. doi: 10.1152/ajpcell.00353.2002. [DOI] [PubMed] [Google Scholar]
- Kleinfeld D, Mitra PP, Helmchen F, Denk W. Fluctuations and stimulus-induced changes in blood flow observed in individual capillaries in layers 2 through 4 of rat neocortex. Proc Natl Acad Sci USA. 1998;95:15741–15746. doi: 10.1073/pnas.95.26.15741. [DOI] [PMC free article] [PubMed] [Google Scholar]
- Konig K. Multiphoton microscopy in life sciences. J Microsc. 2000;200:83–104. doi: 10.1046/j.1365-2818.2000.00738.x. [DOI] [PubMed] [Google Scholar]
- Majewska A, Yiu G, Yuste R. A custom-made two-photon microscope and deconvolution system. Pflugers Arch. 2000;441:398–408. doi: 10.1007/s004240000435. [DOI] [PubMed] [Google Scholar]
- Masters BR, So PT, Gratton E. Multiphoton excitation fluorescence microscopy and spectroscopy of in vivo human skin. Biophys J. 1997;72:2405–2412. doi: 10.1016/S0006-3495(97)78886-6. [DOI] [PMC free article] [PubMed] [Google Scholar]
- Miller MJ, Wei SH, Cahalan MD, Parker I. Autonomous T cell trafficking examined in vivo with intravital two-photon microscopy. Proc Natl Acad Sci USA. 2003;100:2604–2609. doi: 10.1073/pnas.2628040100. [DOI] [PMC free article] [PubMed] [Google Scholar]
- Molitoris BA, Sandoval RM. Intravital multiphoton microscopy of dynamic renal processes. Am J Physiol Renal Physiol. 2005;288:F1084–F1089. doi: 10.1152/ajprenal.00473.2004. [DOI] [PubMed] [Google Scholar]
- Muller M, Schmidt J, Mironov SL, Richter DW. Construction and performance of a custom-built two-photon laser scanning system. J Phys D: Appl Phys. 2003;36:1747–1757. [Google Scholar]
- Nguyen QT, Callamaras N, Hsieh C, Parker I. Construction of a two-photon microscope for video-rate Ca(2+) imaging. Cell Calcium. 2001;30:383–393. doi: 10.1054/ceca.2001.0246. [DOI] [PubMed] [Google Scholar]
- Ogasawara Y, Takehara K, Yamamoto T, Hashimoto R, Nakamoto H, Kajiya F. Quantitative blood velocity mapping in glomerular capillaries by in vivo observation with an intravital videomicroscope. Methods Inf Med. 2000;39:175–178. [PubMed] [Google Scholar]
- Rosivall L, Mirzahosseini S, Toma I, Sipos A, Peti-Peterdi J. Fluid flow in the juxtaglomerular interstitium visualized in vivo. Am J Physiol Renal Physiol. 2006;291:F1241–F1247. doi: 10.1152/ajprenal.00203.2006. [DOI] [PubMed] [Google Scholar]
- Russo LM, Sandoval RM, McKee M, Osicka TM, Collins AB, Brown D, Molitoris BA, Comper WD. The normal kidney filters nephrotic levels of albumin retrieved by proximal tubule cells: Retrieval is disrupted in nephrotic states. Kidney Int. 2007;71:504–513. doi: 10.1038/sj.ki.5002041. [DOI] [PubMed] [Google Scholar]
- Sandoval RM, Kennedy MD, Low PS, Molitoris BA. Uptake and trafficking of fluorescent conjugates of folic acid in intact kidney determined using intravital two-photon microscopy. Am J Physiol Cell Physiol. 2004;287:C517–C526. doi: 10.1152/ajpcell.00006.2004. [DOI] [PubMed] [Google Scholar]
- Squirrell JM, Wokosin DL, White JG, Bavister BD. Long-term two-photon fluorescence imaging of mammalian embryos without compromising viability. Nat Biotechnol. 1999;17:763–767. doi: 10.1038/11698. [DOI] [PMC free article] [PubMed] [Google Scholar]
- Steinhausen M, Tanner GA. Microcirculation and tubular urine flow in the mammalian kidney cortex (in vivo microscopy) Sitzungsberichte Heidelberger Akad Wissensch Math-naturwissensch Kl. 1976;3:279–335. [Google Scholar]
- Steinhausen M, Eisenbach GM, Bottcher W. High-frequency microcinematographic measurements on peritubular blood flow under control conditions and after temporary ischemia of rat kidneys. Pflugers Arch. 1973;339:273–288. doi: 10.1007/BF00594163. [DOI] [PubMed] [Google Scholar]
- Sutton TA, Mang HE, Campos SB, Sandoval RM, Yoder MC, Molitoris BA. Injury of the renal microvascular endothelium alters barrier function after ischemia. Am J Physiol Renal Physiol. 2003;285:F191–F198. doi: 10.1152/ajprenal.00042.2003. [DOI] [PubMed] [Google Scholar]
- Sutton TA, Kelly KJ, Mang HE, Plotkin Z, Sandoval RM, Dagher PC. Minocycline reduces renal microvascular leakage in a rat model of ischemic renal injury. Am J Physiol Renal Physiol. 2005;288:F91–F97. doi: 10.1152/ajprenal.00051.2004. [DOI] [PubMed] [Google Scholar]
- Svoboda K, Yasuda R. Principles of two-photon excitation microscopy and its applications to neuroscience. Neuron. 2006;50:823–839. doi: 10.1016/j.neuron.2006.05.019. [DOI] [PubMed] [Google Scholar]
- Svoboda K, Denk W, Kleinfeld D, Tank DW. In vivo dendritic calcium dynamics in neocortical pyramidal neurons. Nature. 1997;385:161–165. doi: 10.1038/385161a0. [DOI] [PubMed] [Google Scholar]
- Tanner GA, Sandoval RM, Dunn KW. Two-photon in vivo microscopy of sulfonefluorescein secretion in normal and cystic rat kidneys. Am J Physiol Renal Physiol. 2004;286:F152–F160. doi: 10.1152/ajprenal.00264.2003. [DOI] [PubMed] [Google Scholar]
- te Velde EA, Reijerkerk A, Brandsma D, Vogten JM, Wu Y, Kranenburg O, Voest EE, Gebbink M, Borel Rinkes IH. Early endostatin treatment inhibits metastatic seeding of murine colorectal cancer cells in the liver and their adhesion to endothelial cells. Br J Cancer. 2005;92:729–735. doi: 10.1038/sj.bjc.6602385. [DOI] [PMC free article] [PubMed] [Google Scholar]
- Toma I, Kang JJ, Peti-Peterdi J. Imaging renin content and release in the living kidney. Nephron Physiol. 2006;103:71–74. doi: 10.1159/000090622. [DOI] [PubMed] [Google Scholar]
- Watson AJ, Chu S, Sieck L, Gerasimenko O, Bullen T, Campbell F, McKenna M, Rose T, Montrose MH. Epithelial barrier function in vivo is sustained despite gaps in epithelial layers. Gastroenterology. 2005;129:902–912. doi: 10.1053/j.gastro.2005.06.015. [DOI] [PubMed] [Google Scholar]
- Yamamoto T, Tada T, Brodsky SV, Tanaka H, Noiri E, Kajiya F, Goligorsky MS. Intravital videomicroscopy of peritubular capillaries in renal ischemia. Am J Physiol Renal Physiol. 2002;282:1150–1155. doi: 10.1152/ajprenal.00310.2001. [DOI] [PubMed] [Google Scholar]
- Yu W, Sandoval RM, Molitoris BA. Quantitative intravital microscopy using a Generalized Polarity concept for kidney studies. Am J Physiol Cell Physiol. 2005;289:1197–1208. doi: 10.1152/ajpcell.00197.2005. [DOI] [PubMed] [Google Scholar]
- Zipfel WR, Williams RM, Webb WW. Nonlinear magic: Multiphoton microscopy in the biosciences. Nat Biotechnol. 2003;21:1369–1377. doi: 10.1038/nbt899. [DOI] [PubMed] [Google Scholar]