

Abstract
Background & Aims
Liver biopsy analysis is the standard method used to diagnose nonalcoholic fatty liver disease (NAFLD). Advanced magnetic resonance imaging is a noninvasive procedure that can accurately diagnose and quantify steatosis, but is expensive. Conventional ultrasound is more accessible but identifies steatosis with low levels of sensitivity, specificity, and quantitative accuracy, and results vary among operators. A new quantitative ultrasound (QUS) technique can identify steatosis in animal models. We assessed the accuracy of QUS in the diagnosis and quantification hepatic steatosis, comparing findings with those from MRI proton density fat fraction (MRI-PDFF) analysis as a reference.
Methods
We performed a prospective, cross-sectional analysis of a cohort of adults (n=204) with NAFLD (MRI-PDFF≥5%) and without NAFLD (controls). Subjects underwent MRI-PDFF and QUS analyses of the liver on the same day at the University of California, San Diego, from February 2012 through March 2014. QUS parameters and backscatter coefficient (BSC) values were calculated. Patients were randomly assigned to training (n=102; mean age, 51±17 years; mean body mass index, 31±7 kg/m2) and validation (n=102; mean age, 49±17 years; body mass index, 30±6 kg/m2) groups; 69% of patients in each group had NAFLD.
Results
BSC (range 0.00005–0.25 1/cm-sr) correlated with MRI-PDFF (Spearman’s ρ=0.80; P<.0001). In the training group, the BSC analysis identified patients with NAFLD with an area under the curve value of 0.98 (95% confidence interval, 0.95–1.00; P<.0001). The optimal BSC cutoff value identified patients with NAFLD in the training and validation groups with 93% and 87% sensitivity, 97% and 91% specificity, 86% and 76% negative predictive values, and 99% and 95% positive predictive values, respectively.
Conclusions
QUS measurements of BSC can accurately diagnose and quantify hepatic steatosis, based on a cross-sectional analysis that used MRI-PDFF as the reference. With further validation, QUS could be an inexpensive, widely available method to screen the general or at-risk population for NAFLD.
Keywords: chronic liver disease, diagnostic, AUC, biomarker, nonalcoholic fatty liver disease, nonalcoholic steatohepatitis, noninvasive, biomarker, imaging, ultrasound, diagnosis, quantitative, fibrosis, fatty liver, hepatic steatosis, MRI-proton density fat fraction (PDFF), liver biopsy, backscatter coefficient, sensitivity, specificity
Introduction
Nonalcoholic fatty liver disease (NAFLD) has emerged as the leading cause of chronic liver disease in the United States1. It is defined as a spectrum of diseases, from hepatic steatosis that can progress to nonalcoholic steatohepatitis (NASH), fibrosis, cirrhosis, and even hepatocellular carcinoma2. NAFLD is strongly associated with metabolic risk factors1, such as cardiovascular disease3, obesity, diabetes mellitus4, 5, and dyslipidemia6. Currently, the estimated U.S. prevalence of NAFLD ranges from 17 to 51%1, and it is even more common in certain high risk groups, such as individuals with severely obese (90%), type 2 diabetes mellitus (69%), and older, Hispanic males7–9. Liver biopsy remains the gold standard for diagnosing NAFLD1, 10. However, this procedure is invasive with complications such as bleeding and infection, and is unreliable for quantifying steatosis due to sampling error and variability among pathologist interpretation11, 12.
Due to these disadvantages of liver biopsy, there is rising interest in developing noninvasive methods to identify hepatic steatosis, including those measured by state-of-the-art imaging modalities1, 13. While most commonly accessible to assess NAFLD, conventional ultrasonography is limited by operator dependency, low sensitivity and specificity, and lacks quantitative accuracy14–16. Computerized tomography is limited by low sensitivity for mild steatosis, radiation exposure, and inaccurate quantification of steatosis17. Advanced magnetic resonance imaging techniques that measure the proton density fat fraction (MRI-PDFF)—shown to correlate with histology-determined steatosis grade in adults with NAFLD18, 19—and MR spectroscopy have emerged as leading noninvasive modalities for steatosis quantification in NAFLD in terms of sensitivity, specificity, and reliability17, 20, 21. However, like liver biopsies, magnetic resonance imaging is expensive and not routinely accessible.
Quantitative ultrasound (QUS) is a technique that was developed to better characterize tissue microstructure by measuring fundamental acoustic parameters, including backscatter coefficient (BSC)15. BSC is analogous (but not equal) to the qualitative “echogenicity” of tissue, which is used as a component for grading liver status in conventional clinical ultrasonography. As demonstrated in several animal models but limited human, prospective studies, BSC may have potential to detect and quantify hepatic steatosis22–25. Further, several recent inter-laboratory studies demonstrated that QUS methods in reference phantoms and in vivo using clinical imaging scanners are highly reproducible and independent of operator and imaging system factors26, 27.
This study is a cross-sectional analysis of a prospective cohort aimed to assess the accuracy of BSC to diagnose and quantify hepatic steatosis using MRI-PDFF as the reference. The rationale for using MRI-PDFF as a reference standard rather than a liver biopsy is that MRI-PDFF is more accurate than qualitative liver histologic assessment for quantifying liver fat, as previously shown28, 29.
Methods
Study design and derivation of cohort
This is an IRB-approved (by the UCSD institutional review board), HIPAA compliant, crosssectional analysis of participants derived consecutively from a prospective cohort, aimed at assessing the accuracy of BSC to diagnose and quantify hepatic steatosis using MRI-PDFF as reference in participants with NAFLD (defined as MRI-PDFF of ≥5%) and non-NAFLD controls (defined as MRI-PDFF <5%). We followed STARD guidelines in this study of QUS for the diagnostic accuracy in detecting hepatic steatosis (see Supplemental text for STARD checklist).
Study participants were recruited at the UCSD NAFLD Translational Research Unit (PI:RL) between February 2012 and March 2014; 236 eligible study participants were screened and deemed eligible for the study, and 204 participants complied with the study protocol and received same-day QUS and MRI imaging of the liver (see Supplemental Figure A). A priori, half of these (102 participants) were assigned to a training group, the other half to a validation group using stratified randomization by an experienced statistician before any assessment of diagnostic test characteristics to maintain the integrity of the dataset. All participants provided written informed consent. Please see supplementary text for Inclusion and exclusion criteria, and details for Clinical evaluation.
QUS BSC protocol
QUS was performed by a research physician (HE) using a Siemens S3000 scanner with a direct Ultrasound Research Interface (URI) option30. Participants were asked to fast for four hours prior to exam. Scanning was done in the dorsal decubitus position with the right arm at maximum abduction. The 4C1 curved vector array transducer (1–4.5 MHz nominal) was placed 90o to liver capsule through the right intercostal approach.
With the participant in a complete breath hold, multiple B-mode images were acquired of the right lobe of the liver area avoiding major vasculature. The URI was enabled and 10 consecutive frames of transducer signals were recorded from the same region of the liver. Then without changing any scanner settings, 10 consecutive frames were recorded in a well-characterized, tissue-mimicking reference phantom with acoustic properties (sound speed, attenuation, backscatter coefficient) comparable to average human liver tissue (Figure 1a). Only the first frame was used for QUS analysis. URI data files, identified only by code numbers, were saved and then transferred to the server for analysis.
Figure 1. Quantitative ultrasound transducer, region of interest, and the average power spectra.


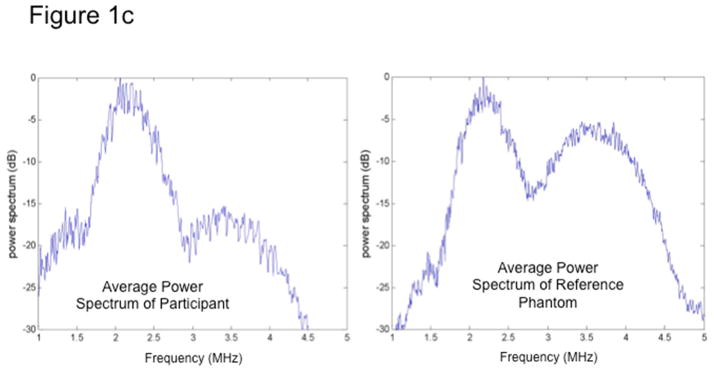
Fig 1a. The QUS transducer captures images and BSC data on both a participant’s liver (left) and on a reference phantom (right). Analyst draws field of interest (FOI) for signal processing.
Fig 1b. Transducer signals captured by the QUS comprise of raw radiofrequency data in lines of pressure waves, one of which is plotted here.
Fig 1c. The average power spectra over a sub-region of interest (sub-ROI) from a participant (left) and the reference phantom (right). Participants’ spectra vary from that of the phantom due to different acoustic properties; thus, the reference phantom can be used to calibrate participant data and correct for total attenuation of tissue signals in the overall FOI.
QUS BSC data analysis
Ultrasonic pulses are transmitted by the transducer into tissue, where the energy is absorbed and scattered along its path due to the heterogeneous nature of tissue. A portion of the energy in the pulses is scattered back to the transducer (echoes). There, it is received, processed and recorded to form one scan line at a time. A two-dimensional ultrasonogram (one frame) is formed from 128 scan lines, which is stored by the URI. Signal analysis for BSC is performed in a selected field of interest (FOI) drawn manually on the liver images (Figure 1a). One scan line for illustration is plotted as a raw RF signal as a function of depth (Figure 1b). The power spectra from the liver and phantom are computed, shown in Figure 1c. The reference phantom spectrum is used to correct the liver spectrum for machine dependent factors (focusing, gain, transducer pattern, transmit power, etc.) as well as to correct for signal loss due to attenuation with depth. BSC is then calculated from the corrected power spectrum. (See Supplemental Material for a more detailed description of this procedure.)
The GUI assembles the discrete lines of RF data to form a B-mode sonogram that the analyst uses to delineate manually a field of interest (FOI) within a relatively homogeneous portion of the liver (Figure 2a). The FOI is drawn as large as possible at least 1 cm below the liver capsule avoiding inclusion of and not below large vessels. The FOI is then sub-segmented automatically into smaller overlapping regions of interest (denoted sub-ROIs) in which many local BSCs as a function of frequency, corrected for signal attenuation, are calculated in a sequential process (Figure 2b) using the reference phantom methodology26.
Figure 2. QUS backscatter coefficient (BSC) images with corresponding MRI-PDFF liver segmentation maps.


After a B-mode sonogram is formed and an image of liver tissue is created, a field of interest (FOI) is manually selected within a relatively homogenous portion of liver free of vasculature (a). This large FOI is further subdivided into many sub-ROIs for which attenuation-compensated BSC is estimated (b), and the overall BSC in the overall FOI is calculated by averaging the BSC of sub-ROIs therein. The qualitative color maps (b) for each patient represent the spectrum of BSC within each large FOI.
The BSC spectra averaged over the entire FOI are shown in Figure 3 for two participants, one with NAFLD (Participant A, PDFF 27.9%) and one a non-NAFLD control (Participant B, PDFF 1.4%). These are the same participants whose B-mode ultrasonograms are displayed in Figure 2. Participant A shows higher BSC across the entire frequency bandwidth than Participant B (Figure 3). BSC (1/cm-sr) in the liver vary over several orders of magnitude with increasing fat content per MRI-PDFF. For the purposes of this study, a narrow bandwidth of each spectrum (2.9–3.1 MHz) was selected, within which the average BSC was computed for each participant. Overall, BSC analysis takes about 1–2 minutes of analyst time and 5–10 minutes of post-processing computer time running in the background. Analysis is done offline on a PC or Mac running established programs in Matlab with a user-friendly graphical user interface.
Figure 3. Backscatter spectra averaged over a field of interest between two participants with different degrees of MRI-PDFF determined hepatic steatosis.

Two participants, as illustrated in Figure 2, with different values of MRI-PDFF (Participant A, 27.9%; Participant B, 1.4%) are compared. The plots show QUS BSC as a function of frequency. Participant A (with NAFLD) shows significantly higher BSC than Participant B (non-NAFLD control) across the entire frequency bandwidth. The yellow shading depicts the narrow bandwidth (2.9–3.1 MHz) for the BSC parameters analyzed in this study. The numbers within the shaded areas are the mean values of BSC within that bandwidth, for each participant.
MRI protocol
Please see supplementary text for the MRI protocol.
Statistical analysis
A priori, before conducting data analysis, half of the 204 participants were randomly assigned to a training group, the other half to a validation group. Stratified randomization by four categories of MRI-PDFF was used (<4%, 4–6%, 6–8% and >8% PDFF), to ensure that a full range of PDFF is present in both the training and validation groups, and that the two groups were comparable in the MRI-PDFF strata of interest. A receiver operating characteristic (ROC) curve was computed for BSC as a separate predictor of steatosis (as defined by MRI-PDFF dichotomized at 5%) using the training dataset. Area under the receiver operator curve (AUC) and the 95% DeLong confidence intervals around them were computed. Please see supplementary text for further details.
Results
Participant characteristics
Table 1 shows baseline demographic, physical, biochemical, and imaging characteristics of the study participants. In the training and validation groups, 40% and 38% were male (P = .886); the mean ± standard deviation (SD) of age was 51 ± 17 and 49 ± 17 years (P = .344); mean BMI ± SD was 30.9 ± 6.5 and 30.2 ± 6.1 kg/m2 (P = .533), respectively. The mean BSC (1/cm-sr) and MRI-PDFF (segments 5–8, %) in the training and validation groups are as follows: 0.026 ± 0.046 versus 0.018 ± 0.030 1/cm-sr (P = .152), and 11.4% ± 9.0% versus 10.7% ± 8.2% (P = .537), respectively. In both the training and validation groups, 70 of 102 participants (69%) had NAFLD by MRI-PDFF (≥5%). There was no significant difference on any of these parameters between the training and validation groups.
Table 1.
Demographic, physical, biochemical, and imaging characteristics of the study participants
| Training Cohort (n = 102) | Validation Cohort (n = 102) | P-Values | |
|---|---|---|---|
| Demographics | |||
| Male (%)^ | 40 | 38 | 0.886 |
| Age (years)* | 51.3 ± 17.2 | 49.0 ± 16.6 | 0.344 |
| Height (cm)* | 165.5 ± 10.3 | 166.8 ± 9.5 | 0.375 |
| Weight (kg)* | 85.1 ± 21.0 | 84.4 ± 20.1 | 0.809 |
| BMI (kg/m2)* | 30.9 ± 6.4 | 30.2 ± 6.1 | 0.432 |
| Ethnic origin (%)^ | 0.671 | ||
| White | 47 | 48 | - |
| Hispanic | 31 | 26 | - |
| Asian | 14 | 16 | - |
| Black | 4 | 4 | - |
| Other | 4 | 6 | - |
| Diabetes^ | 42 | 47 | 0.573 |
| Biochemical profile* | |||
| Hemoglobin (g/dL) | 13.7 ± 1.6 | 14.0 ± 1.5 | 0.086 |
| Hematocrit (%) | 40.3 ± 4.1 | 41.5 ± 3.8 | 0.042 |
| Platelet count (×10^3/uL) | 251 ± 72 | 255 ± 66 | 0.676 |
| AST (U/L) | 34.1 ± 26.9 | 34.4 ± 36.2 | 0.945 |
| ALT (U/L) | 41.9 ± 36.7 | 43.5 ± 55.3 | 0.814 |
| Alkaline phosphatase (U/L) | 76.2 ± 28.1 | 73.9 ± 23.3 | 0.526 |
| GGT (U/L) | 44.6 ± 45.6 | 41.3 ± 44.9 | 0.596 |
| Total bilirubin (mg/dL) | 0.5 ± 0.4 | 0.5 ± 0.3 | 0.861 |
| Albumin (g/dL) 4.5 ± 0.4 | 4.9 ± 3.9 | 0.320 | |
| Glucose (mg/dL) | 105.5 ± 46.5 | 109.8 ± 48.4 | 0.523 |
| Triglycerides (mg/dL) | 145.3 ± 81.0 | 163.0 ± 275.3 | 0.538 |
| Total Cholesterol (mg/dL) | 182.9 ± 41.1 | 180.0 ± 45.5 | 0.645 |
| HDL (mg/dL) | 54.8 ± 20.8 | 53.8 ± 15.6 | 0.717 |
| LDL (mg/dL) | 101.1 ± 31.8 | 96.6 ± 30.4 | 0.308 |
| INR | 1.0 ± 0.2 | 1.0 ± 0.2 | 0.572 |
| Imaging* | |||
| MRI-PDFF 5–8 (%) | 11.4 ± 9.0 | 10.7 ± 8.2 | 0.5365 |
| BSC (1/cm-sr) | 0.026 ± 0.046 | 0.018 ± 0.030 | 0.1517 |
Abbreviations for table: AST, aspartate aminotransferase; ALT, alanine aminotransferase; BSC, backscatter coefficient; BMI, body mass index; GGT, gamma-glutamyl transpeptidase; HDL, high-density lipoprotein; INR, international normalized ratio; LDL, low-density lipoprotein; MRI, magnetic resonance imaging; PDFF, proton-density-fat-fraction (mean calculated from segments 5–8). All labs were measured while patients were fasting.
Mean value provided with standard deviations and p-values (t-test).
Chi-square test p-values are presented; note that the chi-square test for comparing ethnic proportions in the two groups were conducted for Whites versus Hispanics versus Asians/Blacks/Others.
Correlations between BSC versus MRI-PDFF and BMI in training and validation groups
Figure 4 compares graphically QUS BSC with MRI-PDFF in both training and validation groups combined. Spearman’s rank correlation coefficient between BSC and MRI-PDFF was ρ=0.82 (P < .0001) in the training group, ρ=0.79 (P < .0001) in the validation group, and ρ=0.80 (P < .0001) overall. Correlation of BSC and MRI-PDFF with various metabolic parameters has been provided in supplementary section (see supplemental Table A).
Figure 4. Figure 4a Correlation between BSC and MRI-PDFF (≥5%) in training and validation groups (n = 204), with the optimal BSC cut-off and corresponding ROC curve for the diagnosis of hepatic steatosis.


When BSC is correlated with MRI-PDFF (QUS frequency of 3 MHz), BSC exhibited a Spearman’s rho in the training and validation groups of 0.82 and 0.79, P < .0001, respectively. Overall, BSC ρ=0.80 (P < .0001). At MRI-PDFF ≥5%, the optimal BSC cut-off was 0.0038 1/cm-sr in the training set for the diagnosis of NAFLD.
Figure 4b ROC curve for the diagnosis of hepatic steatosis with BSC as defined by MRI-PDFF ≥5% at the optimal QUS BSC cut-off in the training group. Backscatter coefficient of 0.0038 1/cm-sr exhibits an AUC of 0.98.
Accuracy of QUS BSC for diagnosis of hepatic steatosis (MRI-PDFF ≥5%)
In the training group, BSC provided an AUC of 0.98 (95% CI 0.95–1.00, P < .0001) for the diagnosis of steatosis (Figure 4b). In the training group, the optimal BSC cut-off of 0.0038 1/cm-sr provided a sensitivity of 93%, specificity of 97%, positive predictive value (PPV) of 99%, negative predictive value (NPV) of 86%, and total accuracy (TA) of 94% (Table 2). In the validation group, the training group’s cut-off provided a sensitivity of 87%, specificity of 91%, PPV of 95%, NPV of 76%, and TA of 88%. We conducted sensitivity analyses to carefully examine whether the accuracy of BSC was lower in individuals with higher BMI by stratifying the cohort into two groups: < median BMI (<31 kg/m2) and ≥ median BMI (≥ 31 Kg/m2). The results remained consistent and we did not find any difference in the accuracy of BSC between the two groups (p-value = 0.37).
Table 2.
Secondary analysis of various MRI-PDFF percentage thresholds for diagnosis of steatosis in the training and validation group with optimal BSC cut-offs and corresponding AUCs, sensitivity, specificity, PPV, NPV, and total accuracy.
| Training Group (n = 102) | Validation Group (n = 102) | ||||||||||||||
|---|---|---|---|---|---|---|---|---|---|---|---|---|---|---|---|
| MRI- PDFF thres- hold |
BSC cut-off |
n | AUC* | SN | SP | PPV | NPV | TA | n | AUC* | SN | SP | PPV | NPV | TA |
| ≥4% | 0.0033 | 75 | 0.95 (0.91–0.99) | 0.91 (0.82–0.96) | 1.00 (0.87–1.00) | 1.00 (0.95–1.00) | 0.79 (0.62–0.91) | 0.93 (0.86–0.97) | 75 | 0.97 (0.94–1.00) | 0.85 (0.75–0.92) | 1.00 (0.87–1.00) | 1.00 (0.94–1.00) | 0.71 (0.54–0.85) | 0.89 (0.82–0.95) |
| ≥5% | 0.0038 | 70 | 0.98 (0.95–1.00) | 0.93 (0.84–0.98) | 0.97 (0.84–1.00) | 0.99 (0.92–1.00) | 0.86 (0.71–0.95) | 0.94 (0.88–0.98) | 70 | 0.95 (0.90–1.00) | 0.87 (0.77–0.94) | 0.91 (0.75–0.98) | 0.95 (0.87–0.99) | 0.76 (0.60–0.89) | 0.88 (0.80–0.94) |
| ≥6% | 0.0038 | 65 | 0.94 (0.90–0.99) | 0.94 (0.85–0.98) | 0.87 (0.71–0.96) | 0.92 (0.83–0.98) | 0.89 (0.74–0.97) | 0.91 (0.84–0.96) | 65 | 0.92 (0.86–0.98) | 0.88 (0.77–0.95) | 0.81 (0.65–0.92) | 0.89 (0.79–0.96) | 0.79 (0.63–0.90) | 0.85 (0.77–0.92) |
| ≥8% | 0.0056 | 56 | 0.90 (0.84–0.96) | 0.88 (0.76–0.95) | 0.80 (0.66–0.91) | 0.85 (0.73–0.93) | 0.84 (0.70–0.93) | 0.84 (0.76–0.91) | 57 | 0.90 (0.84–0.96) | 0.83 (0.70–0.91) | 0.82 (0.68–0.92) | 0.86 (0.73–0.94) | 0.79 (0.64–0.89) | 0.82 (0.74–0.89) |
95% confidence intervals presented in parenthesis.
Abbreviations for table: AUC, area under the receiver operating characteristic curve; BSC, backscatter coefficient (in 1/cm-sr); MRI, magnetic resonance imaging; n/a, not applicable; NPV, negative predictive value; PDFF, proton-density-fat-fraction; PPV, positive predictive value; SN, sensitivity; SP, specificity; TA, total accuracy.
All AUCs are reported with P <.000
Secondary analysis of QUS BSC and optimal cutoffs at different MRI-PDFF thresholds
Table 2 shows a secondary analysis of the QUS parameter, BSC, at its optimal cut-offs, and performance parameters (sensitivity, specificity, PPV, NPV) at various MRI-PDFF thresholds (≥4, 5, 6, and 8%). Overall, BSC demonstrated robust AUCs across various MRI-PDFF thresholds. The highest AUC seen (0.98) is for BSC at a threshold of MRI-PDFF ≥5%.
Discussion
In this cross-sectional analysis of a prospective cohort of adults with and without NAFLD, we demonstrate that QUS BSC is accurate in diagnosing hepatic steatosis, using MRI-PDFF as the reference. Furthermore, we found that BSC correlated strongly with the degree of hepatic steatosis (as represented by MRI-PDFF), and thus showed potential for noninvasive quantification of liver fat content. In stringent sensitivity analyses across various MRI-PDFF thresholds (≥4, 5, 6, and 8%), BSC showed robust AUCs across the entire range; moreover, the optimal BSC cut-off depended on the threshold.
These findings add to the current literature in that QUS parameter outcomes have not been studied extensively in a large, prospective human cohort thus far for the diagnosis and quantification of liver fat. While liver biopsy remains the gold standard for diagnosing NAFLD, the liver biopsy examination has notable limitations—including subjectivity, sampling variability, invasiveness, risk of severe pain and bleeding (1 in 500), and death (1 in 10000)—that deem it both impractical and unreliable in population-based screening or for monitoring treatment response31, 32. Conventional ultrasonography has been widely used for initial screening of fatty liver because it is accessible, noninvasive, and inexpensive11. However, its utility is both machine- and operator-dependent, with low accuracy in the morbidly obese and poor reliability in distinguishing between steatosis and fibrosis33. Previous studies on the use of conventional ultrasonography for detecting fatty liver show sensitivities and specificities between 60–94% and 66–95%, respectively34, 35, demonstrating that it does not provide reproducible, continuous range of quantitative information for steatosis36.
Noncontrast CT imaging is noninvasive with good diagnostic performance in the qualitative diagnosis of steatosis, with a sensitivity of 82% and specificity of 100% at a steatosis threshold of >30%12, 37. However, CT has poor sensitivity for mild steatosis, is unreliable for steatosis quantification, and involves radiation exposure17. Advanced MRI techniques can measure PDFF, which has emerged as a new standardized biomarker for assessing liver fat38. MRI-PDFF transcends the shortcomings of CT and older MRI techniques that are limited by T1 bias, T(2)* decay and multi-frequency signal-interference effects of protons within fat21, 39. MRI-PDFF correlates well with histology-determined steatosis in adults with NAFLD18, 40. In a longitudinal study, MRI was more accurate and sensitive (93% sensitivity, 85% specificity) than histology in quantifying changes in steatosis over time29. In a randomized clinical trial studying the effect of colesevelam on liver fat, MRI-PDFF was able to detect changes in liver fat longitudinally that histology could not28. Despite these advantages, advanced MRI remains costly and relatively inaccessible.
The development of QUS followed various conventional ultrasonographic techniques aimed at improving diagnostic accuracy for steatosis. Please see supplemental text for further details. This methodology overcomes previous limitations of conventional ultrasonography because QUS parameters are estimated using a reference phantom and objective computer algorithms. Thus, the phantom reference addresses machine (transducer format, gain, dynamic range, focusing, frequency, etc.) and operator dependencies, therefore helping to reduce both sources of variability.
The implementation of QUS requires training of an experienced sonographer in a short (<1 hour) training session. Due to the fact that QUS procedures and measures are platform independent, it can be performed on any conventional ultrasonography scanner from any manufacturer. This accessibility, along with the advantages of QUS as a noninvasive and relatively cost-effective imaging modality, improves the viability of QUS as a large-scale screening and monitoring tool for the general population and for research, including clinical trials and development of therapies. The strengths and limitations of the study are provided in the supplementary text in further details.
Conclusion and future studies
The primary findings of this study show that the QUS parameter BSC can accurately diagnose and quantify hepatic steatosis, using MRI-PDFF as the reference. QUS methodologies may be a promising, relatively inexpensive modality to screen the general population for fatty liver disease. The availability, cost, and accuracy of BSC outweigh the risks involved with liver biopsy. Future studies could examine the use of multiple QUS parameters on a larger cohort of participants and follow them longitudinally, include a multi-center study, or compare BSC versus liver biopsy for the diagnosis of hepatic steatosis, perhaps in a three-way comparison with MRI-PDFF.
Supplementary Material
Acknowledgments
Grants & Financial Support:
The development of the GUI at UIUC used to process the quantitative ultrasound data was supported by NIH R01 CA111289. The use of the Siemens S3000 scanner was loaned to UCSD under a research agreement with Siemens Medical Systems, Inc. The study was conducted at the Clinical and Translational Research Institute, University of California at San Diego. RL is supported in part by the American Gastroenterological Association (AGA) Foundation – Sucampo – ASP Designated Research Award in Geriatric Gastroenterology and by a T. Franklin Williams Scholarship Award. Funding provided by: Atlantic Philanthropies, Inc, the John A. Hartford Foundation, the Association of Specialty Professors, and the American Gastroenterological Association, and the National Institutes of Health grant K23-DK090303.
Role of Funding Agencies: Funding agencies did not have any role in the design and conduct of the study, collection, management, analysis or interpretation of the data; preparation, review, or approval of the manuscript.
Julio Herrera Gener, Jamie Kelly and Nick Olsen at UIUC are acknowledged for their QUS processing skills.
Abbreviations
- ALT
alanine aminotransferase
- AST
aspartate aminotransferase
- AUC
area under the receiver operator curve
- BMI
body mass index
- BSC
backscatter coefficient
- CT
computerized tomography
- FOI
field of interest
- GGT
gamma-glutamyl transpeptidase
- GUI
graphical user interface
- HDL
high-density lipoprotein
- INR
international normalized ratio
- LDL
low-density lipoprotein
- MRI
magnetic resonance imaging
- MRS
magnetic resonance spectroscopy
- NAFLD
nonalcoholic fatty liver disease
- NASH
nonalcoholic steatohepatitis
- NPV
negative predictive value
- PDFF
proton-density-fat-fraction
- PPV
positive predictive value
- QUS
quantitative ultrasound
- ROC
receiver operating characteristic
- ROI
region of interest
- SGRE
spoiled gradient-recalled-echo
- TA
total accuracy
- TGC
time-gain compensation
- UCSD
University of California San Diego
- UIUC
University of Illinois at Urbana-Champaign
- URI
Ultrasound Research Interface
Footnotes
Writing Assistance: N/A
Disclosures: None disclosed. There is no conflict of interest.
Authors Contributions and Contacts:
Steven C. Lin (stevenc.lin@gmail.com): Drafting of the manuscript, analysis and interpretation of data, critical revision of the manuscript, approved final submission
Elhamy Heba (elhamyrheba@gmail.com): Drafting of the manuscript, interpretation of data, critical revision of the manuscript, approved final submission
Tanya Wolfson (twolfson@ucsd.edu): Analysis and interpretation of data, statistical analysis, critical revision of the manuscript, approved final submission
Brandon Ang (bang@ucsd.edu): Critical revision of the manuscript, approved final submission
Anthony Gamst (acgamst@math.ucsd.edu): Analysis and interpretation of data, statistical analysis, critical revision of the manuscript, approved final submission
Aiguo Han (han51@illinois.edu): Critical revision of the manuscript, analysis of data, approved final submission
John W. Erdman Jr. (jwerdman@illinois.edu): Critical revision of the manuscript, study concept, approved final submission
William D. O’Brien Jr. (wdo@uiuc.edu): Critical revision of the manuscript, study concept, analysis and interpretation of data, approved final submission
Michael P. Andre (mandre@ucsd.edu): Critical revision of the manuscript, study concept, analysis and interpretation of data, drafting of manuscript, approved final submission
Claude B. Sirlin (csirlin@ucsd.edu): Study concept and design, analysis and interpretation of data, critical revision of the manuscript, obtained funding, study supervision, approved final submission
Rohit Loomba (roloomba@ucsd.edu): Study concept and design, analysis and interpretation of data, drafting of the manuscript, critical revision of the manuscript, obtained funding, study supervision, approved final submission
Publisher's Disclaimer: This is a PDF file of an unedited manuscript that has been accepted for publication. As a service to our customers we are providing this early version of the manuscript. The manuscript will undergo copyediting, typesetting, and review of the resulting proof before it is published in its final citable form. Please note that during the production process errors may be discovered which could affect the content, and all legal disclaimers that apply to the journal pertain.
References
- 1.Chalasani N, Younossi Z, Lavine JE, et al. The diagnosis and management of non-alcoholic fatty liver disease: practice Guideline by the American Association for the Study of Liver Diseases, American College of Gastroenterology, and the American Gastroenterological Association. Hepatology. 2012;55:2005–23. doi: 10.1002/hep.25762. [DOI] [PubMed] [Google Scholar]
- 2.Adams LA, Lymp JF, St Sauver J, et al. The natural history of nonalcoholic fatty liver disease: a population-based cohort study. Gastroenterology. 2005;129:113–21. doi: 10.1053/j.gastro.2005.04.014. [DOI] [PubMed] [Google Scholar]
- 3.Targher G, Arcaro G. Non-alcoholic fatty liver disease and increased risk of cardiovascular disease. Atherosclerosis. 2007;191:235–40. doi: 10.1016/j.atherosclerosis.2006.08.021. [DOI] [PubMed] [Google Scholar]
- 4.Zarrinpar A, Loomba R. Review article: the emerging interplay among the gastrointestinal tract, bile acids and incretins in the pathogenesis of diabetes and non-alcoholic fatty liver disease. Aliment Pharmacol Ther. 2012;36:909–21. doi: 10.1111/apt.12084. [DOI] [PMC free article] [PubMed] [Google Scholar]
- 5.Anstee QM, Targher G, Day CP. Progression of NAFLD to diabetes mellitus, cardiovascular disease or cirrhosis. Nat Rev Gastroenterol Hepatol. 2013;10:330–44. doi: 10.1038/nrgastro.2013.41. [DOI] [PubMed] [Google Scholar]
- 6.Loomba R, Abraham M, Unalp A, et al. Association between diabetes, family history of diabetes, and risk of nonalcoholic steatohepatitis and fibrosis. Hepatology. 2012;56:943–51. doi: 10.1002/hep.25772. [DOI] [PMC free article] [PubMed] [Google Scholar]
- 7.Vernon G, Baranova A, Younossi ZM. Systematic review: the epidemiology and natural history of non-alcoholic fatty liver disease and non-alcoholic steatohepatitis in adults. Aliment Pharmacol Ther. 2011;34:274–85. doi: 10.1111/j.1365-2036.2011.04724.x. [DOI] [PubMed] [Google Scholar]
- 8.Browning JD, Szczepaniak LS, Dobbins R, et al. Prevalence of hepatic steatosis in an urban population in the United States: impact of ethnicity. Hepatology. 2004;40:1387–95. doi: 10.1002/hep.20466. [DOI] [PubMed] [Google Scholar]
- 9.Williamson RM, Price JF, Glancy S, et al. Prevalence of and risk factors for hepatic steatosis and nonalcoholic Fatty liver disease in people with type 2 diabetes: the Edinburgh Type 2 Diabetes Study. Diabetes Care. 2011;34:1139–44. doi: 10.2337/dc10-2229. [DOI] [PMC free article] [PubMed] [Google Scholar]
- 10.Stinton LM, Loomba R. Recommendations for liver biopsy evaluation in non-alcoholic fatty liver disease. Minerva Gastroenterol Dietol. 2014;60:5–13. [PubMed] [Google Scholar]
- 11.Schwenzer NF, Springer F, Schraml C, et al. Non-invasive assessment and quantification of liver steatosis by ultrasound, computed tomography and magnetic resonance. J Hepatol. 2009;51:433–45. doi: 10.1016/j.jhep.2009.05.023. [DOI] [PubMed] [Google Scholar]
- 12.Festi D, Schiumerini R, Marzi L, et al. Review article: the diagnosis of non-alcoholic fatty liver disease -- availability and accuracy of non-invasive methods. Aliment Pharmacol Ther. 2013;37:392–400. doi: 10.1111/apt.12186. [DOI] [PubMed] [Google Scholar]
- 13.Musso G, Gambino R, Cassader M, et al. Meta-analysis: natural history of nonalcoholic fatty liver disease (NAFLD) and diagnostic accuracy of non-invasive tests for liver disease severity. Ann Med. 2011;43:617–49. doi: 10.3109/07853890.2010.518623. [DOI] [PubMed] [Google Scholar]
- 14.Nascimbeni F, Pais R, Bellentani S, et al. From NAFLD in clinical practice to answers from guidelines. J Hepatol. 2013;59:859–71. doi: 10.1016/j.jhep.2013.05.044. [DOI] [PubMed] [Google Scholar]
- 15.Ghoshal G, Lavarello RJ, Kemmerer JP, et al. Ex vivo study of quantitative ultrasound parameters in fatty rabbit livers. Ultrasound Med Biol. 2012;38:2238–48. doi: 10.1016/j.ultrasmedbio.2012.08.010. [DOI] [PMC free article] [PubMed] [Google Scholar]
- 16.Sasso M, Miette V, Sandrin L, et al. The controlled attenuation parameter (CAP): a novel tool for the non-invasive evaluation of steatosis using Fibroscan. Clin Res Hepatol Gastroenterol. 2012;36:13–20. doi: 10.1016/j.clinre.2011.08.001. [DOI] [PubMed] [Google Scholar]
- 17.Springer F, Machann J, Claussen CD, et al. Liver fat content determined by magnetic resonance imaging and spectroscopy. World J Gastroenterol. 2010;16:1560–6. doi: 10.3748/wjg.v16.i13.1560. [DOI] [PMC free article] [PubMed] [Google Scholar]
- 18.Permutt Z, Le TA, Peterson MR, et al. Correlation between liver histology and novel magnetic resonance imaging in adult patients with non-alcoholic fatty liver disease - MRI accurately quantifies hepatic steatosis in NAFLD. Aliment Pharmacol Ther. 2012;36:22–9. doi: 10.1111/j.1365-2036.2012.05121.x. [DOI] [PMC free article] [PubMed] [Google Scholar]
- 19.Tang A, Tan J, Sun M, et al. Nonalcoholic fatty liver disease: MR imaging of liver proton density fat fraction to assess hepatic steatosis. Radiology. 2013;267:422–31. doi: 10.1148/radiol.12120896. [DOI] [PMC free article] [PubMed] [Google Scholar]
- 20.Ratziu V, Bellentani S, Cortez-Pinto H, et al. A position statement on NAFLD/NASH based on the EASL 2009 special conference. J Hepatol. 2010;53:372–84. doi: 10.1016/j.jhep.2010.04.008. [DOI] [PubMed] [Google Scholar]
- 21.Reeder SB, Cruite I, Hamilton G, et al. Quantitative assessment of liver fat with magnetic resonance imaging and spectroscopy. J Magn Reson Imaging. 2011;34:729–49. doi: 10.1002/jmri.22580. [DOI] [PMC free article] [PubMed] [Google Scholar]
- 22.Weijers G, Starke A, Thijssen JM, et al. Transcutaneous vs. intraoperative quantitative ultrasound for staging bovine hepatic steatosis. Ultrasound Med Biol. 2012;38:1404–13. doi: 10.1016/j.ultrasmedbio.2012.04.009. [DOI] [PubMed] [Google Scholar]
- 23.Gaitini D, Baruch Y, Ghersin E, et al. Feasibility study of ultrasonic fatty liver biopsy: texture vs. attenuation and backscatter. Ultrasound Med Biol. 2004;30:1321–7. doi: 10.1016/j.ultrasmedbio.2004.08.001. [DOI] [PubMed] [Google Scholar]
- 24.O’Brien RT, Zagzebski JA, Lu ZF, et al. Measurement of acoustic backscatter and attenuation in the liver of dogs with experimentally induced steroid hepatopathy. Am J Vet Res. 1996;57:1690–4. [PubMed] [Google Scholar]
- 25.Lu ZF, Zagzebski JA, O’Brien RT, et al. Ultrasound attenuation and backscatter in the liver during prednisone administration. Ultrasound Med Biol. 1997;23:1–8. doi: 10.1016/s0301-5629(96)00181-0. [DOI] [PubMed] [Google Scholar]
- 26.Yao LX, Zagzebski JA, Madsen EL. Backscatter coefficient measurements using a reference phantom to extract depth-dependent instrumentation factors. Ultrason Imaging. 1990;12:58–70. doi: 10.1177/016173469001200105. [DOI] [PubMed] [Google Scholar]
- 27.Nam K, Rosado-Mendez IM, Wirtzfeld LA, et al. Comparison of ultrasound attenuation and backscatter estimates in layered tissue-mimicking phantoms among three clinical scanners. Ultrason Imaging. 2012;34:209–21. doi: 10.1177/0161734612464451. [DOI] [PMC free article] [PubMed] [Google Scholar]
- 28.Le TA, Chen J, Changchien C, et al. Effect of colesevelam on liver fat quantified by magnetic resonance in nonalcoholic steatohepatitis: a randomized controlled trial. Hepatology. 2012;56:922–32. doi: 10.1002/hep.25731. [DOI] [PMC free article] [PubMed] [Google Scholar]
- 29.Noureddin M, Lam J, Peterson MR, et al. Utility of magnetic resonance imaging versus histology for quantifying changes in liver fat in nonalcoholic fatty liver disease trials. Hepatology. 2013;58:1930–40. doi: 10.1002/hep.26455. [DOI] [PMC free article] [PubMed] [Google Scholar]
- 30.Brunke SS, Insana MF, Dahl JJ, et al. An ultrasound research interface for a clinical system. IEEE Trans Ultrason Ferroelectr Freq Control. 2007;54:198–210. doi: 10.1109/tuffc.2007.226. [DOI] [PubMed] [Google Scholar]
- 31.Noureddin M, Loomba R. Nonalcoholic fatty liver disease: Indications for liver biopsy and noninvasive biomarkers. Clinical Liver Disease. 2012;1:104–107. doi: 10.1002/cld.65. [DOI] [PMC free article] [PubMed] [Google Scholar]
- 32.Rockey DC, Caldwell SH, Goodman ZD, et al. Liver biopsy. Hepatology. 2009;49:1017–44. doi: 10.1002/hep.22742. [DOI] [PubMed] [Google Scholar]
- 33.Taylor KJ, Gorelick FS, Rosenfield AT, et al. Ultrasonography of alcoholic liver disease with histological correlation. Radiology. 1981;141:157–61. doi: 10.1148/radiology.141.1.6270725. [DOI] [PubMed] [Google Scholar]
- 34.Joseph AE, Saverymuttu SH, al-Sam S, et al. Comparison of liver histology with ultrasonography in assessing diffuse parenchymal liver disease. Clin Radiol. 1991;43:26–31. doi: 10.1016/s0009-9260(05)80350-2. [DOI] [PubMed] [Google Scholar]
- 35.Saverymuttu SH, Joseph AE, Maxwell JD. Ultrasound scanning in the detection of hepatic fibrosis and steatosis. Br Med J (Clin Res Ed) 1986;292:13–5. doi: 10.1136/bmj.292.6512.13. [DOI] [PMC free article] [PubMed] [Google Scholar]
- 36.Hamaguchi M, Kojima T, Itoh Y, et al. The severity of ultrasonographic findings in nonalcoholic fatty liver disease reflects the metabolic syndrome and visceral fat accumulation. Am J Gastroenterol. 2007;102:2708–15. doi: 10.1111/j.1572-0241.2007.01526.x. [DOI] [PubMed] [Google Scholar]
- 37.Wong VW, Vergniol J, Wong GL, et al. Diagnosis of fibrosis and cirrhosis using liver stiffness measurement in nonalcoholic fatty liver disease. Hepatology. 2010;51:454–62. doi: 10.1002/hep.23312. [DOI] [PubMed] [Google Scholar]
- 38.Reeder SB, Hu HH, Sirlin CB. Proton density fat-fraction: a standardized MR-based biomarker of tissue fat concentration. J Magn Reson Imaging. 2012;36:1011–4. doi: 10.1002/jmri.23741. [DOI] [PMC free article] [PubMed] [Google Scholar]
- 39.Patel NS, Peterson MR, Brenner DA, et al. Association between novel MRI-estimated pancreatic fat and liver histology-determined steatosis and fibrosis in non-alcoholic fatty liver disease. Aliment Pharmacol Ther. 2013;37:630–9. doi: 10.1111/apt.12237. [DOI] [PMC free article] [PubMed] [Google Scholar]
- 40.Idilman IS, Aniktar H, Idilman R, et al. Hepatic steatosis: quantification by proton density fat fraction with MR imaging versus liver biopsy. Radiology. 2013;267:767–75. doi: 10.1148/radiol.13121360. [DOI] [PubMed] [Google Scholar]
Associated Data
This section collects any data citations, data availability statements, or supplementary materials included in this article.