

Abstract
The classical methods for quantifying drug-target residence time (tR) use loss or regain of enzyme activity in progress curve kinetic assays. However, such methods become imprecise at very long residence times, mitigating the use of alternative strategies. Using the NAD(P)H-dependent FabI enoyl-ACP reductase as a model system, we developed a Penefsky column-based method for direct measurement of tR, where the off-rate of the drug was determined with radiolabeled [adenylate-32P] NAD(P+) cofactor. Twenty-three FabI inhibitors were analyzed and a mathematical model was used to estimate limits to the tR values of each inhibitor based on percent drug-target complex recovery following gel filtration. In general, this method showed good agreement with the classical steady state kinetic methods for compounds with tR values of 10-100 min. In addition, we were able to identify seven long tR inhibitors (100-1500 min) and to accurately determine their tR values. The method was then used to measure tR as a function of temperature, an analysis not previously possible using the standard kinetic approach due to decreased NAD(P)H stability at elevated temperatures. In general, a 4-fold difference in tR was observed when the temperature was increased from 25 °C to 37 °C .
Keywords: fatty acid biosynthesis, enoyl ACP reductase, residence time (tR), methodology, steady-state kinetics, high throughput screening, Penefsky column
INTRODUCTION
Widespread resistance to front-line and combinatorial antibiotic therapies continuously demands the development of new drugs [1-4]. In the standard drug development pipeline, the strategy for developing lead compounds has mainly focused on the optimization of drug-target thermodynamics and in vivo pharmacokinetics [5, 6], while little attention has been paid to drug-target binding kinetics due to the assumption that the dissociation rate of the drug from the complex (koff) is too rapid to play a significant role in drug pharmacodynamics [7]. However, the high attrition rate of many lead compounds from high toxicity and/or lack of efficacy [8] suggests a lack of mechanistic understanding when translating in vitro lead optimization to later-stage efficacy models and clinical trials. Recently, it has been suggested that drug-target residence time (tR = 1/koff) should be included in the traditional affinity-driven drug development strategy, since the lifetime of the drug-target complex can modulate drug efficacy, selectivity and target occupancy under non-equilibrium conditions [5, 6, 9, 10].
Drug-target residence time can be determined using a number of methods, including kinetic assays from which koff values can be extracted or approaches that measure koff directly. As slow-off ligands are commonly seen in time-dependent rather than in rapid equilibrium inhibition mechanisms (Scheme 1), progress curve analysis can be used to accurately determine koff values of greater than 0.01 min−1 by monitoring the slow onset of inhibition in a standard enzyme assay. Although this type of analysis is information-rich since other kinetic and thermodynamic constants can be determined (Scheme 1), it is also an indirect method for determining koff. In addition, it is limited by the pseudo-first-order rate constant (kobs) and steady-state velocity (vs) when characterizing low nanomolar to picomolar affinity inhibitors. For example, inhibition of polypeptide deformylase (PDF) by the natural product antibacterial agent actinonin, which has a Ki value of ≤ 0.23 nM, can result in progress curves where the steady-state velocity in the presence of inhibitor approaches zero, resulting in difficulties in estimating koff and distinguishing a potent reversible inhibitor from a true irreversible inactivator [11]. While, jump dilution assays can be used as an alternative and more direct method to obtain residence time through the recovery of enzyme activity [12], high affinity and slow koff inhibitors pose similar problems to this approach. For instance, only partial recovery of enzyme activity was reported for the inhibition of PDF by actinonin and of hepatitis C virus NS3 protease by ITMN-191 [11, 13]. Even though the koff can still be estimated through fixing the steady-state velocity to 100% of the enzyme activity, iterative data fitting is required to generate a relatively accurate estimate. In addition, data acquisition time under such conditions usually requires hours or longer, which brings into question the stability of the substrate and/or enzyme [13]. In general, the classical koff measurements using loss or regain of enzyme activity in progress curve kinetics are largely limited when inhibitors have residence times of many hours or days.
Scheme 1. time dependent inhibitor binding scheme.

In the two-step induced-fit inhibition mechanism, the initial EI complex is formed rapidly followed by a much slower enzyme isomerization to form the final EI* complex. k1 and k2 depict the association and dissociation rate constants for the binding step, respectively; k3 and k4 represent the forward and reverse rate constants for the isomerization step. In many cases k4 ≈ koff since the enzyme isomerization step occurs much more slowly than the initial binding event. Relevant thermodynamic constants for this mechanism include Ki and Ki* where and
Surface plasmon resonance (SPR) is a popular alternative method for directly analyzing drug-target binding kinetics. SPR relies on changes in the refractive index of the solvent during complex formation and dissociation to directly measure molecular interactions, which includes binding affinity and binding kinetics in real time without labeling the ligand [14, 15]. While SPR is a sensitive method, deployment of this approach can be hindered by mass transport and the ability to detect the interaction of small molecules with the target protein [15]. Due to such limitations, SPR is generally able to produce reliable data for ligands with molecular sizes ranging from ~300 Da to polypeptides or proteins [15, 16], with reported koff values normally ranging from 2 × 10⁻⁴ s−1 to 1 s−1 and a total data acquisition time of up to 1200 seconds [15, 17]. To our knowledge koff values smaller than 10−4 s−1 have not yet been accurately reported using SPR because of technical limitations with monitoring slowly dissociating ligands [18, 19]. Therefore, alternative methods to accurately measure slow koff values need to be developed for long residence time and high affinity inhibitors.
Here we report a direct method for slow koff measurement based on Penefsky spin columns [20-22]. This method has been successfully applied to the inhibition of the fatty acid biosynthesis enoyl-ACP reductase (FabI) enzyme by a series of diphenyl ether inhibitors. The diphenyl ethers are uncompetitive inhibitors, forming a ternary complex with the enzyme and NAD(P)+ (Fig. 1). Since NAD(P)+ has a millimolar dissociation constant for the enzyme [23-26], [32P]-NAD+ can be used as a reporter of inhibitor dissociation. We demonstrate that this direct dissociation method is reliable and more accurate than progress curve analysis for long residence time inhibitors. We discuss the applicability and sensitivity of this method for measuring tR values of 5 minutes to more than 10 hours. Additionally, we address how temperature affects the dissociation rate. Finally, we demonstrate how this approach can be used to screen for long residence time inhibitors in the FabI system. This new assay is suitable for the whole FabI class of enzymes, and facilitates the identification and characterization of novel FabI inhibitors.
Figure 1. The FabI inhibitor dissociation scheme.
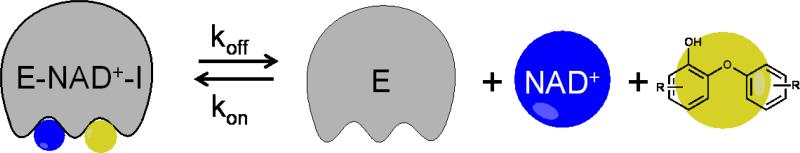
As the FabI inhibitors require NAD+ for binding, [32P]-NAD+ was chosen as the molecule to monitor inhibitor dissociation.
EXPERIMENTAL SECTION
FabI protein preparation
The FabI proteins from Mycobacterium tuberculosis, Staphylococcus aureus, Escherichia coli and Burkholderia pseudomallei were expressed following the protocols described previously [25, 27, 28]. Briefly, the FabI gene was expressed in E. coli BL21(DE3) pLysS cells. Each protein was purified by affinity and size-exclusion chromatography, using His-bind Ni2+-NTA resin (Invitrogen) and Superdex 200 resin (AKTA purifier), respectively. The purity of the protein was analyzed using 12% SDS-PAGE gels and the protein was stored at −80°C in buffer containing 30 mM PIPES pH 6.8 150 mM NaCl and 1 mM EDTA.
Substrate synthesis
Trans-2-octenoyl coenzyme A (Oct-CoA) was synthesized using the mixed anhydride method [25, 29]. Briefly, 277 mg (1.95 mmol) trans-2-octenoic acid was dissolved in 3 mL tetrahydrofuran with 140 mg (1.38 mmol) triethylamine under nitrogen. 148 mg of ethyl chloroformate (1.36 mmol) was added dropwise into the solution leading to the formation of salt crystals. The reaction was stirred at room temperature for 3 hr under nitrogen, and the mixed anhydride solution was then centrifuged at 5000 rpm for 15 min to remove the precipitate. The mixed anhydride was then added dropwise into a 2 mL solution of 20 mg (0.03 mmol) CoA in 50 mM Na2CO3 (pH 8.0) and tetrahydrofuran (1:1). The reaction was stirred at room temperature for 2 hr after which excess organic solvent was removed by rotary evaporation and the Oct-CoA purified using a CombiFlash 4.3 g C18 column. The column was equilibrated with 20 mM ammonium acetate (buffer A), and Oct-CoA eluted after 20 column volumes using a linear gradient of buffer A to 100% acetonitrile at a flow rate of 18 mL/min. Fractions containing Oct-CoA were pooled and characterized by electrospray ionization mass spectrometry (Supplementary information Figure S1). Trans-2-crotonyl CoA (Cr-CoA) was purchased from Sigma Aldrich (Cat# 28007).
Inhibitor synthesis
Triclosan was purchased from Fisher Scientific (Cat# NC 9022139). MUT056399 was a gift from Anacor. PT01, PT02, PT03, PT04, PT05, PT52, PT70, PT103, PT113, PT91 and PT92 were synthesized as previously described [30-33], as were PT447 and PT119 [34]. The synthesis of PT163, PT501, PT403, PT404, PT411, PT412 and PT417 is described in the supplementary information.
[32P]-Direct dissociation kinetics
A mixture of 15 μM FabI, 20 μM NAD+, [32P]-NAD+ (800 Ci/ml American Radiolabeled Chemicals) and 200 μM inhibitor were incubated in 30 mM PIPES reaction buffer pH 6.8 containing 150 mM NaCl and 1 mM EDTA at room temperature for 16 hr to allow full ternary complex formation. G25 resin (Sephadex) was hydrated in the reaction buffer and 2.5 mL resin was used to pack the Penefsky spin column. Five hundred microliters of the ternary complex was loaded onto the column which was then centrifuged using a swinging bucket rotor at 2500 rpm for 2 min to remove excess free ligand. The total radioactivity of the purified complex (~500 μ L) was determined (Cmax in Equation 1) and then the solution was rapidly diluted into 60 mL of reaction buffer to initiate ligand dissociation. Subsequently, 600 μL aliquots of the diluted mixture were collected as a function of time, and immediately centrifuged in a Sartorius concentrator (10 kDa) at 13,400 rpm for 90 seconds. The amount of 32P in the flow-through was quantified using a scintillation counter (LS5801). Data were fit to equation 1 where C(t) and C(0) are the radioactive counts (cpm) at time points t and 0, respectively, Cmax is the maximum radioactive counts and koff is the inhibitor dissociation rate constant. This approach assumes that NAD+ dissociates rapidly from the enzyme (millimolar Kd) once the inhibitor has dissociated from the ternary complex. All curve fitting was performed with KaleidaGraph 4.1.
| Equation 1 |
Inhibitor progress curve analysis
Progress curve analysis was performed on a Cary 100 spectrophotometer (Varian). The reaction was performed at 20 °C by adding the enzyme (75 nM) to an assay solution consisting of Oct-CoA or Cr-CoA (200 μM – 1.5 mM), NAD(P)H (250 μM – 350 μM), NAD(P)+ (200 μM), DMSO (2% v), inhibitor (0 – 4000 nM) and 8% glycerol. The substrate concentration used in the assay ensured that the progress curve in the absence of inhibitor was essentially linear for the first 10% of the reaction. NAD(P)+ (200 μM) was included in the assay since each inhibitor forms a ternary complex with the enzyme and the oxidized cofactor. Progress curve data were fit to equation 2 to obtain kobs,
| Equation 2 |
where At and A0 are the absorbance at times t and 0, respectively, vi is the initial velocity, vs is the steady state velocity, and kobs is the pseudo-first order rate constant for the approach to the steady state. Equation 3 was then used to obtain koff, which is the dissociation rate constant of the inhibitor from the enzyme. In a single step mechanism, the vi corresponds to the initial velocity when no inhibitor is present; while in the two-step induced fit mechanism, vi represents the initial velocity when the inhibitor initially binds to the enzyme.
| Equation 3 |
Correlating the ternary complex concentration as function of time
A set of curves describing the change of enzyme-drug ternary complex concentration as a function of time was constructed and plotted using KaleidaGraph 4.1. The equation used to generate these curves is derived in the supplementary information (Fig. S2).
RESULTS
The [32P]-Direct dissociation method
The [32P]-direct dissociation method was designed to directly monitor the dissociation of the inhibitors in the FabI system assuming that the limiting step was dissociation of inhibitor from the ternary complex and that release of NAD+ from the resulting binary complex was rapid (Fig. 2). FabI was incubated with excess amounts of NAD+, [32P]-NAD+ and inhibitor overnight at room temperature to generate the ternary complex. Since wild-type S. aureus FabI (saFabI) utilizes NADPH rather than NADH, the R40Q/K41N/S44L saFabI variant was used since the kinetic parameters of this mutant are similar to the wild-type enzyme except that the cofactor preference has been switched from NADP+ to NAD+ [34]. After incubation, the E-([32P])NAD+-I ternary complex was purified by size-exclusion spin column chromatography [20, 21] to remove free ligands (Fig. 2). The complex was rapidly diluted to initiate ternary complex dissociation, and the amount of unbound [32P]-NAD+ was quantified as a function of time following centricon separation (Fig. 2). Although a small amount of radioactivity was present at time point 0, the subsequent change in the amount of [32P]-NAD+ released accurately described the release of the ligand. Data collection was continued until the amount of [32P]-NAD+ in the centricon flow-through reached a maximum.
Figure 2. The [32P]-NAD+ direct dissociation method.

15 μM FabI, 20 μM NAD+, [32P]-NAD+ and 200 μM inhibitor were incubated at room temperature overnight before loading onto the G25 Sephadex spin column. The ternary complex was purified from excess ligand using a 2 min spin at 2500 rpm. The complex was rapidly diluted 100-fold to initiate dissociation. 600 μL aliquots of the diluted inhibitor complex were collected as a function of time points loaded onto a centricon concentrator to separate the dissociated ligand from the enzyme-inhibitor complex. Free ligand was subsequently quantified using a scintillation counter to detect 32P.
The challenges of this direct dissociation method arise through the development of the two separation steps (Fig. 2). The purification of the ternary complex from the reaction mixture (Fig. 2 first separation) must be performed with only limited dilution, since this will trigger ligand dissociation thus leading to inaccurate results. Therefore, we introduced a gel filtration technique using the spin column described before [20] in which size exclusion chromatography is performed using centrifugation. Several steps had to be optimized during development of this procedure to efficiently separate the protein from the ligand. This included adjustments to the bed resin volume of the size-exclusion spin column, the volume of sample that was loaded onto the column, the spin speed and the separation time. Figure 3A shows the UV absorbance of the sample containing 15 μM protein before and after loading onto the spin column. While the A280 of a 15 μM FabI sample (500 μL) decreased from 0.15 before the spin to 0.1 after the spin (Fig. 3A), the A260 of a 25 μM NAD+ solution (500 μL) decreased from 0.44 to 0.04 after the spin (Fig. 3B). Using this procedure the ratio of A280 or A260 before and after the spin was used to determine the recovery of protein or NAD+, respectively, in each experiment. In Figure 3C, it can be seen that recovery of the protein was as high as 70% - 80% for the four different FabIs, while the recovery of NAD+ was only ~5%, indicating the efficiency of the column for separating large and small molecules.
Figure 3. Method validation.


A) The absorbance of enzyme at 280 nm before and after the spin column.
B) The absorbance of NAD+ at 260 nm before and after the spin column
C) The percent recovery of the enzyme and NAD+ was quantified by calculating the ratio of the absorbance before and after loading onto the G25 Sephadex spin column at 280 nm and 260 nm, respectively.
D) The percent recovery of the E-NAD+ complex and E-NAD+-I complex was quantified by calculating the radioactive counts before and after loading onto the G25 Sephadex spin column.
The ability of the spin column to isolate the ternary E:NAD+:I complex was then evaluated (Fig. 3D). While recovery of the ternary complex was as high as 80% (Fig. 3D), omission of inhibitor from the enzyme incubation mixture resulted in only ~5% recovery of NAD+, in agreement with the expectation that NAD+ binds only weakly to the free enzyme.
In the second separation (Fig. 2 second separation), the NAD+ and [32P]-NAD+ that has dissociated from the complex needs to be separated from the remaining ternary complex. Since dissociation is still occurring during the second separation, purification of free NAD+/[32P]-NAD+ has to be performed significantly faster than the rate of inhibitor dissociation from the ternary complex. Although dialysis has previously been used to monitor radiotracer dissociation [35], we found this method to be too slow and instead adopted an approach that uses a centricon where the centrifugation time was shorter than the time interval between two different time points.
Determination of drug-target residence time using the direct dissociation method and progress curve analysis
Residence times determined using the direct dissociation method developed here were compared with those measured using progress curve analysis, which is widely used method for analyzing time-dependent enzyme inhibition [11, 13, 36-38]. The direct dissociation method was first evaluated using a series of diphenyl ether inhibitors of the M. tuberculosis FabI (InhA). In Fig. 4A it can be seen that there is excellent agreement between the tR values obtained from the direct dissociation method and progress curve analysis when tR is under 100 minutes (R2 0.99). The method was then extended to B. pseudomallei FabI (bpFabI), saFabI and E. coli FabI (ecFabI). As shown in Figs. 4B, 4C and 4D, this method was able to accurately determine tR values for bpFabI, saFabI and ecFabI inhibitor complexes (R2 0.78, 0.90 and 0.74, respectively). In Fig. 4E, all FabI datasets were compiled, which verified the accuracy of the new method and its applicability to different FabI systems.
Figure 4. Comparison of residence times generated by the progress curve analysis and the 32P-NAD+ direct dissociation method for inhibitors with residence times under 100 min.


A) Data for M. tuberculosis FabI (InhA). Linear fit of the data gave R2 = 0.99.
B) Data for B. pseudomallei FabI. Linear fit of the data gave R2 = 0.78..
C) Data for R40Q/K41N/S44L S. aureus FabI. Linear fit of the data gave R2 = 0.90.
D) Data for E. coli FabI. Linear fit of the data gave R2 = 0.74.
E) Comparison of all data obtained using the direct dissociation method and progress curve analysis for inhibitors with residence times under 100 min.
F) Comparison of all data obtained using the direct dissociation method and progress curve analysis for inhibitors with residence times up to 1000 min.
While good agreement between the methods was generally observed for drug-target complexes with tR values below 100 min, the direct dissociation method consistently gave larger tR values than progress curve analysis for longer residence time inhibitors (Fig. 4F). For example, the direct dissociation method gave a tR value of (148.4±13.4) min for PT91 bound to InhA, while progress curve analysis provided a shorter tR of (102.1±11.4) min (Supplementary information Table S1). Additionally, progress curve analysis gave tR values of 238.0 min and 68.6 min for PT404 and PT417 bound to bpFabI, while the direct dissociation method gave significantly longer tR values of 713.0 min and 198.5 min, respectively (Table S1). Similarly, in the saFabI system, progress curve analysis underestimated the tR values of PT04 and PT119 (97 min and 120.3 min, compared to 461.5 min and 833.3 min, respectively, Table S1).
Progress curve assays are robust and have been widely used to analyze time-dependent inhibition in systems such as FabI [11, 13, 36-38]. While thermodynamic and kinetic constants can be derived from progress curves yielding a detailed picture of the inhibition reaction coordinate [39], some caution should be exercised when applying this approach to highly potent compounds with very long residence times. In reality, progress curves are only accurate within a certain range of inhibitor concentrations. At high inhibitor concentration, kobs can be very fast and the low signal/noise of vs and/or solubility issues can limit the analysis. For instance, an 8-fold difference in koff is observed in the PT119 inhibition of saFabI (Table S1). As shown in Fig. 5A and Table 1, this is because no significant change in vs can be detected at high inhibitor concentrations. Conversely, at low inhibitor concentrations, kobs will be small mitigating long detection times in order for vs to be reached but leading to issues with the time window of progress curve linearity. As shown in Fig. 5B and Table 2, the time window of progress curve linearity is ~ 30 min in the absence of inhibitor; however, the kobs value at low inhibitor concentration is 0.036 min−1, meaning that the conversion from vi to vs occurs in ~ 27 min. Under such conditions, it is difficult to distinguish whether kobs represents the rate constant for the conversion of EI to EI*, or substrate consumption due to the limited linearity in the experimental window. In addition, since small kobs values usually lead to longer data acquisition times required to reach the steady state, this brings into question the stability of the substrate or the enzyme, and the accuracy of vs. Finally, obtaining koff through hyperbolic fitting of kobs and [I] can be indirect and inaccurate. For instance, a potent reversible inhibitor may not be distinguished from an irreversible inhibitor due to an extremely small koff value [11]. Hence, these limitations hinder the use of progress curve analysis in the characterization of high affinity, long residence time inhibitors.
Figure 5. Examples where progress curve analysis cannot accurately determine koff.


A) kobs and vs when inhibitor concentration is increased from 1 μM to 2 μM.
B) kobs and vs determined using low inhibitor concentration. The intersection of the red dash line represents the time corresponding to the conversion of EI to EI*.
Table 1.
Parameters obtained from progress curve analysis under different inhibitor concentrations
| Inhibitor concentration (μM) | kobs (min−1) | vs (μM−1 min−1) |
|---|---|---|
| 1 | 0.092 | 0.090 |
| 2 | 0.19 | 0.085 |
Table 2.
Parameters obtained from progress curve analysis at low inhibitor concentration
| Low inhibitor concentration | kobs (min−1) | vs (μM−1 min−1) |
| 0.036 | 0.25 | |
Measuring residence time under physiological temperature is feasible by this method
The direct dissociation method can be readily adapted to studying koff values as a function of temperature. In principal, this enables residence times to be determined under physiologically relevant conditions (37 °C) [41], and also facilitates Arrhenius type analysis for extracting enthalpic and entropic contributions to binding. Such analyses are problematic with progress curve kinetics, where long acquisition times required to capture formation of the final EI* complex are confounded by the decrease in NAD(P)H stability observed at elevated temperatures [42, 43]. Since the direct dissociation method utilizes NAD+ rather than NADH, this method can be utilized at different temperatures, and in Fig. 6 it can be seen that the residence time is ~ 4-fold shorter at 37 °C compared to 25 °C for inhibitors bound to ecFabI (Fig. 6).
Figure 6. Comparison of koff values determined at 25 °C and 37 °C for inhibitors bound to E. coli FabI.

The effect of temperature on koff values for PT447 binding to E. coli FabI
Recovery of ternary complex correlates with the inhibitor dissociation rate constant
Interestingly, we found a correlation between the amount of ternary complex recovered following centrifugation and the inhibitor off-rate (Table 3). After optimizing the procedure, we estimated that the minimum time from the start of chromatography to collection of the centricon flow-through was ~ 2 min. Ternary complexes that were isolated in less than 30% yield involved inhibitors with tR values less than 10 min. Subsequent increases in tR led to higher recovery of the ternary complex. Based on this observation, we simulated a set of curves to investigate the relationship between ternary complex recovery and inhibitor koff values (Fig. 7A). Using these simulated curves, we were able to estimate a theoretical koff range based on the yield of ternary complex. Surprisingly, we found a good agreement between the theoretical koff values and those determined experimentally by monitoring the dissociation of [32P]-NAD+ (Table 3). Compounds that gave ternary complexes in less than 30% yield corresponded to residence times of 1 – 2 min from the simulated curves, while experimental data indicated a tR value of ~1 min. For higher recoveries, the simulation yielded an estimate of tR values from 10 to 20 min, while experimental values were 20.0 min, 19.6 min and 22.7 min respectively. Thus, we were able to estimate tR by simply analyzing the ternary complex recovery after a 2 min spin time. A replot of Fig. 7A, at a 2 min operating time, reveals that the yield of ternary complex recovery is greater than 80% when tR values are longer than 10 min (Fig. 7B). Thus, the percent of complex recovery cannot easily distinguish complexes with residence times longer than 10 min. However, the dynamic range of this method can be increased by altering the time period of the gel filtration step. If the separation time is increased from 2 min to 15 min, a replot of Fig. 7A (Fig. 7C) shows that the recovery of a 10 min tR enzyme-inhibitor complex decreases from 82% to 22% (Fig. 7B vs. Fig. 7C). However, the recovery of a 60 min tR enzyme-inhibitor complex only decreases from 97% to 78% (Fig. 7B vs. Fig. 7C). Therefore, while the spin column method is optimized for rapid separation of free and bound ligands, in principle it could be adapted to generate longer separation times by changing parameters such as the operating time and bed volume (data not shown). In addition, the longer tR enzyme-inhibitor complexes could also be differentiated by performing the separation at different temperatures. Since a 4-fold increase in koff is expected as shown in Fig. 6, the inhibitor that still shows high complex recovery under higher temperature indicates long residence time.
Table 3.
Comparison of koff values obtained from experiment and simulation
| Ternary complex recovery from experiment | koff from experiment (min−1) | Residence time from experiment (min) | Residence time range from theoretical curve (min) |
|---|---|---|---|
| 18% | 1.10 | 0.91 | < 1 |
| 28% | 1.10 | 0.90 | 1 – 2 |
| 58% | 0.140 | 7.14 | 2 – 5 |
| 82% | 0.050 | 20.0 | 10 – 20 |
| 84% | 0.051 | 19.6 | 10 – 20 |
| 87% | 0.044 | 22.7 | 10 – 20 |
Figure 7. High throughput screening to identify slow off-rate inhibitors. A set of simulated curves depicts the change of drug-target complex concentration over time.


A) Using a 2 min and 15 min operating time, respectively
B) A replot of ternary complex recovery following 2 min separation as a function of tR
C) A replot of ternary complex recovery following 15 min separation as a function of tR
DISCUSSION
Since the direct dissociation method reported here avoids the use of steady-state kinetics measurements, it does not have the shortcomings found in classical progress curve or jump dilution methods. The koff is obtained by fitting the rate of formation of free [32P]NAD+ using a simple exponential decay function (equation 1) without additional calculation or derivation. In principle, this direct dissociation method can be expanded by using other methods of detecting free ligand such as fluorescence. In this regard, Goolijarsingh et al determined the residence time of BDGA for heat shock protein (Hsp) 90 by monitoring the time-dependent change in BDGA fluorescence anisotropy following dilution of a BDGA-Hsp90 complex to trigger dissociation [44]. In our system, the use of a radioactive ligand allows the method to be applied to very potent inhibitors where high levels of dilution are required to initiate complex dissociation. Using this method, we are able to measure tR values from 1 min (Table 3) to 800 min (Fig. 4F and Table S1). Recently, we have identified a diphenyl ether-based inhibitor that has a tR value of more than 2 days by this direct dissociation method (data not shown). Combined with steady-state kinetics and SPR, the current methods are able to cover a broad timescale of koff from as short as seconds to several days (Fig. 8).
Figure 8. Relative timescales of methods to determine koff.

A representation of the time range that each method can cover on the koff timescale.
Based on the correlation between the ternary complex recovery and inhibitor off-rate (Fig. 7 and Table 3), we defined “slow off” inhibitors in the FabI system as those with at least 10 min residence time, which translates the qualitative terminology “slow” to a more quantitative concept. Furthermore, it is possible to use the method to identify compounds in a library with relatively small off-rates. For example, compounds could be incubated with the enzyme and [32P]-NAD+ in a 96 well-plate format. After a fast spin, slow off inhibitors could be identified and residence times estimated by simply analyzing the complex recovery quantified scintillation counting. If necessary, one can perform the fast spin at a higher temperature, to study the effect of temperature on koff. The rate constant will be shortened at elevated temperatures thereby reducing the amount of ternary complex that is recovered. To our knowledge, this type of information is lacking in the determination of off-rates using high throughput screening [45]. Therefore this method would be very valuable and useful for pharmaceutical industry at the early stage of drug development.
There are still potential weaknesses of the method reported here (Table 4). First, our approach requires NAD+ as the cofactor when the inhibitor binds to the enzyme. If the inhibitor does not require a cofactor or is bound together with alternative cofactors, this method has to be modified. Secondly, this method is not as accurate for very short tR inhibitors. As discussed above, for inhibitors with short tR, we will lose considerable amounts of the ternary complex during the first separation. This will result in a relatively low yield of complex recovery. Also, we need to be cautious about the second separation step (Fig. 2). Since inhibitor dissociation cannot be halted during the second separation, the amount of the free NAD+ that is quantified will be less accurate for short tR inhibitors due to their fast dissociation. For these short tR inhibitors, alternative strategies can be readily used, including progress curve analysis and jump dilution assays (Fig. 8). Lastly, there could still be potential rebinding problems in this method [46]. The way the method has been designed is to remove the excess ligand before rapid dilution without adding any competing ligand after the dilution (Fig. 9B)., One way to improve this method for extremely potent inhibitors is to add a competing ligand to prevent ligand rebinding (Figure 9C and 9D). Motulsky et al has discussed in detail the determination of dissociation rates using a competitive binding assay [47].
Table 4.
Advantages and disadvantages of the direct dissociation method
| Advantages | Disadvantages | How to improve |
|---|---|---|
| Direct method | Requires NAD+ as cofactor for binding | Synthesize radiolabeled cofactor through enzymatic reaction |
| Accurate for long residence time inhibitors | Not very sensitive to short residence time measurement | N/A |
| Applicable for FabI system | Could have rebinding issue | Adding competing ligand |
| Potentially can be used as a high throughput screening method |
Figure 9. Comparison of approaches to directly measure ligand dissociation.

A) A dissociation scheme without removal of excess ligands and no competing ligand
B) A dissociation scheme with removal of excess ligands but no competing ligand
C) A dissociation scheme without removal of excess ligands but with competing ligand
D) A dissociation scheme with removal of excess ligands and in the presence of a competing ligand
CONCLUSION
A novel method for the direct measurement of residence time has been developed and applied to the enoyl-ACP reductase system. The method showed very reliable results compared to classical steady-state kinetic analyses, and was more accurate than progress curve analysis for inhibitors with very long residence times. A correlation was found between the drug-target ternary complex recovery and off-rate enabling the method to be expanded to a high throughput format. An advantage of this method is the use of radiolabeled ligand that permits accurate quantitation of low ligand concentrations thus enabling off-rates to be determined for very potent compounds. Even though this method is designed specifically for the enoyl-ACP reductase system, our approach could be adapted to other systems in order to validate kinetic approaches to determination of drug-target residence times and also as a potential strategy for the high throughput discovery of long residence time inhibitors.
Supplementary Material
Acknowledgments
Funding: supported by grant GM102864 from the NIH
REFERNENCES
- 1.Taubes G. The bacteria fight back. Science. 2008;321:356–361. doi: 10.1126/science.321.5887.356. [DOI] [PubMed] [Google Scholar]
- 2.McDevitt D, Rosenberg M. Exploiting genomics to discover new antibiotics. Trends Microbiol. 2001;9:611–617. doi: 10.1016/s0966-842x(01)02235-1. [DOI] [PubMed] [Google Scholar]
- 3.Marshall E. Trench warfare in a battle with TB. Science. 2008;321:362–364. doi: 10.1126/science.321.5887.362. [DOI] [PubMed] [Google Scholar]
- 4.Wright GD. The antibiotic resistome: the nexus of chemical and genetic diversity. Nat Rev Microbiol. 2007;5:175–186. doi: 10.1038/nrmicro1614. [DOI] [PubMed] [Google Scholar]
- 5.Copeland RA, Pompliano DL, Meek TD. Drug-target residence time and its implications for lead optimization. Nat Rev Drug Discov. 2006;5:730–739. doi: 10.1038/nrd2082. [DOI] [PubMed] [Google Scholar]
- 6.Tummino PJ, Copeland RA. Residence time of receptor-ligand complexes and its effect on biological function. Biochemistry. 2008;47:5481–5492. doi: 10.1021/bi8002023. [DOI] [PubMed] [Google Scholar]
- 7.Vauquelin G, Charlton SJ. Long-lasting target binding and rebinding as mechanisms to prolong in vivo drug action. Br J Pharmacol. 2010;161:488–508. doi: 10.1111/j.1476-5381.2010.00936.x. [DOI] [PMC free article] [PubMed] [Google Scholar]
- 8.Kola I, Landis J. Can the pharmaceutical industry reduce attrition rates? Nat Rev Drug Discov. 2004;3:711–715. doi: 10.1038/nrd1470. [DOI] [PubMed] [Google Scholar]
- 9.Lu H, England K, am Ende C, Truglio JJ, Luckner S, Reddy BG, Marlenee NL, Knudson SE, Knudson DL, Bowen RA, Kisker C, Slayden RA, Tonge PJ. Slow-onset inhibition of the FabI enoyl reductase from francisella tularensis: residence time and in vivo activity. ACS Chem Biol. 2009;4:221–231. doi: 10.1021/cb800306y. [DOI] [PMC free article] [PubMed] [Google Scholar]
- 10.Lu H, Tonge PJ. Drug-target residence time: critical information for lead optimization. Curr Opin Chem Biol. 2010;14:467–474. doi: 10.1016/j.cbpa.2010.06.176. [DOI] [PMC free article] [PubMed] [Google Scholar]
- 11.Van Aller GS, Nandigama R, Petit CM, DeWolf WE, Jr., Quinn CJ, Aubart KM, Zalacain M, Christensen SB, Copeland RA, Lai Z. Mechanism of time-dependent inhibition of polypeptide deformylase by actinonin. Biochemistry. 2005;44:253–260. doi: 10.1021/bi048632b. [DOI] [PubMed] [Google Scholar]
- 12.Copeland RA, Basavapathruni A, Moyer M, Scott MP. Impact of enzyme concentration and residence time on apparent activity recovery in jump dilution analysis. Anal Biochem. 2011;416:206–210. doi: 10.1016/j.ab.2011.05.029. [DOI] [PubMed] [Google Scholar]
- 13.Rajagopalan R, Misialek S, Stevens SK, Myszka DG, Brandhuber BJ, Ballard JA, Andrews SW, Seiwert SD, Kossen K. Inhibition and binding kinetics of the hepatitis C virus NS3 protease inhibitor ITMN-191 reveals tight binding and slow dissociative behavior. Biochemistry. 2009;48:2559–2568. doi: 10.1021/bi900038p. [DOI] [PubMed] [Google Scholar]
- 14.Cooper MA. Advances in membrane receptor screening and analysis. J Mol Recognit. 2004;17:286–315. doi: 10.1002/jmr.675. [DOI] [PubMed] [Google Scholar]
- 15.Rich RL, Myszka DG. Advances in surface plasmon resonance biosensor analysis. Curr Opin Biotechnol. 2000;11:54–61. doi: 10.1016/s0958-1669(99)00054-3. [DOI] [PubMed] [Google Scholar]
- 16.Myszka DG, Rich RL. Implementing surface plasmon resonance biosensors in drug discovery. Pharm Sci Technolo Today. 2000;3:310–317. doi: 10.1016/s1461-5347(00)00288-1. [DOI] [PubMed] [Google Scholar]
- 17.Abdiche Y, Malashock D, Pinkerton A, Pons J. Determining kinetics and affinities of protein interactions using a parallel real-time label-free biosensor, the Octet. Anal Biochem. 2008;377:209–217. doi: 10.1016/j.ab.2008.03.035. [DOI] [PubMed] [Google Scholar]
- 18.Karlsson R, Katsamba PS, Nordin H, Pol E, Myszka DG. Analyzing a kinetic titration series using affinity biosensors. Anal Biochem. 2006;349:136–147. doi: 10.1016/j.ab.2005.09.034. [DOI] [PubMed] [Google Scholar]
- 19.Zhang SBHQ, Tao NJ. High-performance differential surface plasmon resonance sensor using quadrant cell photodetector. REVIEW OF SCIENTIFIC INSTRUMENTS. 2003;74 [Google Scholar]
- 20.Penefsky HS. Reversible binding of Pi by beef heart mitochondrial adenosine triphosphatase. J Biol Chem. 1977;252:2891–2899. [PubMed] [Google Scholar]
- 21.Penefsky HS. A centrifuged-column procedure for the measurement of ligand binding by beef heart F1. Methods Enzymol. 1979;56:527–530. doi: 10.1016/0076-6879(79)56050-9. [DOI] [PubMed] [Google Scholar]
- 22.Tillotson B, Slocum K, Coco J, Whitebread N, Thomas B, West KA, MacDougall J, Ge J, Ali JA, Palombella VJ, Normant E, Adams J, Fritz CC. Hsp90 (Heat Shock Protein 90) Inhibitor Occupancy Is a Direct Determinant of Client Protein Degradation and Tumor Growth Arrest in Vivo. Journal of Biological Chemistry. 2010;285:39835–39843. doi: 10.1074/jbc.M110.141580. [DOI] [PMC free article] [PubMed] [Google Scholar]
- 23.Quemard A, Sacchettini JC, Dessen A, Vilcheze C, Bittman R, Jacobs WR, Jr., Blanchard JS. Enzymatic characterization of the target for isoniazid in Mycobacterium tuberculosis. Biochemistry. 1995;34:8235–8241. doi: 10.1021/bi00026a004. [DOI] [PubMed] [Google Scholar]
- 24.Ward WH, Holdgate GA, Rowsell S, McLean EG, Pauptit RA, Clayton E, Nichols WW, Colls JG, Minshull CA, Jude DA, Mistry A, Timms D, Camble R, Hales NJ, Britton CJ, Taylor IW. Kinetic and structural characteristics of the inhibition of enoyl (acyl carrier protein) reductase by triclosan. Biochemistry. 1999;38:12514–12525. doi: 10.1021/bi9907779. [DOI] [PubMed] [Google Scholar]
- 25.Liu N, Cummings JE, England K, Slayden RA, Tonge PJ. Mechanism and inhibition of the FabI enoyl-ACP reductase from Burkholderia pseudomallei. J Antimicrob Chemother. 2011;66:564–573. doi: 10.1093/jac/dkq509. [DOI] [PMC free article] [PubMed] [Google Scholar]
- 26.Xu H, Sullivan TJ, Sekiguchi J, Kirikae T, Ojima I, Stratton CF, Mao W, Rock FL, Alley MR, Johnson F, Walker SG, Tonge PJ. Mechanism and inhibition of saFabI, the enoyl reductase from Staphylococcus aureus. Biochemistry. 2008;47:4228–4236. doi: 10.1021/bi800023a. [DOI] [PMC free article] [PubMed] [Google Scholar]
- 27.Luckner SR, Liu N, am Ende CW, Tonge PJ, Kisker C. A slow, tight binding inhibitor of InhA, the enoyl-acyl carrier protein reductase from Mycobacterium tuberculosis. J Biol Chem. 2010;285:14330–14337. doi: 10.1074/jbc.M109.090373. [DOI] [PMC free article] [PubMed] [Google Scholar]
- 28.Schiebel J, Chang A, Lu H, Baxter MV, Tonge PJ, Kisker C. Staphylococcus aureus FabI: inhibition, substrate recognition, and potential implications for in vivo essentiality. Structure. 2012;20:802–813. doi: 10.1016/j.str.2012.03.013. [DOI] [PMC free article] [PubMed] [Google Scholar]
- 29.Parikh S, Moynihan DP, Xiao G, Tonge PJ. Roles of tyrosine 158 and lysine 165 in the catalytic mechanism of InhA, the enoyl-ACP reductase from Mycobacterium tuberculosis. Biochemistry. 1999;38:13623–13634. doi: 10.1021/bi990529c. [DOI] [PubMed] [Google Scholar]
- 30.am Ende CW, Knudson SE, Liu N, Childs J, Sullivan TJ, Boyne M, Xu H, Gegina Y, Knudson DL, Johnson F, Peloquin CA, Slayden RA, Tonge PJ. Synthesis and in vitro antimycobacterial activity of B-ring modified diaryl ether InhA inhibitors. Bioorg Med Chem Lett. 2008;18:3029–3033. doi: 10.1016/j.bmcl.2008.04.038. [DOI] [PMC free article] [PubMed] [Google Scholar]
- 31.Sivaraman S, Sullivan TJ, Johnson F, Novichenok P, Cui G, Simmerling C, Tonge PJ. Inhibition of the bacterial enoyl reductase FabI by triclosan: a structure-reactivity analysis of FabI inhibition by triclosan analogues. J Med Chem. 2004;47:509–518. doi: 10.1021/jm030182i. [DOI] [PubMed] [Google Scholar]
- 32.Sullivan TJ, Truglio JJ, Boyne ME, Novichenok P, Zhang X, Stratton CF, Li HJ, Kaur T, Amin A, Johnson F, Slayden RA, Kisker C, Tonge PJ. High affinity InhA inhibitors with activity against drug-resistant strains of Mycobacterium tuberculosis. ACS Chem Biol. 2006;1:43–53. doi: 10.1021/cb0500042. [DOI] [PubMed] [Google Scholar]
- 33.Pan P. PhD dissertation. 2012. Lead optimization and slow-onset inhibition of the enoyl-ACP reductase (InhA) from Mycobacterium tuberculosis. [DOI] [PMC free article] [PubMed] [Google Scholar]
- 34.Chang A, Schiebel J, Yu W, Bommineni GR, Pan P, Baxter MV, Khanna A, Sotriffer CA, Kisker C, Tonge PJ. Rational optimization of drug-target residence time: insights from inhibitor binding to the Staphylococcus aureus FabI enzyme-product complex. Biochemistry. 2013;52:4217–4228. doi: 10.1021/bi400413c. [DOI] [PMC free article] [PubMed] [Google Scholar]
- 35.Rawat R, Whitty A, Tonge PJ. The isoniazid-NAD adduct is a slow, tight-binding inhibitor of InhA, the Mycobacterium tuberculosis enoyl reductase: adduct affinity and drug resistance. Proc Natl Acad Sci U S A. 2003;100:13881–13886. doi: 10.1073/pnas.2235848100. [DOI] [PMC free article] [PubMed] [Google Scholar]
- 36.Wang A, Dorso C, Kopcho L, Locke G, Langish R, Harstad E, Shipkova P, Marcinkeviciene J, Hamann L, Kirby MS. Potency, selectivity and prolonged binding of saxagliptin to DPP4: maintenance of DPP4 inhibition by saxagliptin in vitro and ex vivo when compared to a rapidly-dissociating DPP4 inhibitor. BMC Pharmacol. 2012;12:2. doi: 10.1186/1471-2210-12-2. [DOI] [PMC free article] [PubMed] [Google Scholar]
- 37.Anderson K, Lai Z, McDonald OB, Stuart JD, Nartey EN, Hardwicke MA, Newlander K, Dhanak D, Adams J, Patrick D, Copeland RA, Tummino PJ, Yang J. Biochemical characterization of GSK1070916, a potent and selective inhibitor of Aurora B and Aurora C kinases with an extremely long residence time 1. Biochem J. 2009;420:259–265. doi: 10.1042/BJ20090121. [DOI] [PubMed] [Google Scholar]
- 38.Garvey EP, Schwartz B, Gartland MJ, Lang S, Halsey W, Sathe G, Carter HL, 3rd, Weaver KL. Potent inhibitors of HIV-1 integrase display a two-step, slow-binding inhibition mechanism which is absent in a drug-resistant T66I/M154I mutant. Biochemistry. 2009;48:1644–1653. doi: 10.1021/bi802141y. [DOI] [PubMed] [Google Scholar]
- 39.Copeland RA. Evaluation of enzyme inhibitors in drug discovery a guide for medicinal chemists and pharmacologists. 2rd ed. John Wiley & Sons, Inc; Hoboken: 2005. [PubMed] [Google Scholar]
- 40.Copeland RA. Evaluation of Enzyme Inhibitors in Drug Discovery: A Guide for Medicinal Chemists and Pharmacologists. Wiley-Interscience; 2005. [PubMed] [Google Scholar]
- 41.Vauquelin G, Van Liefde I. Radioligand dissociation measurements: potential interference of rebinding and allosteric mechanisms and physiological relevance of the biological model systems. Expert Opin Drug Discov. 2012;7:583–595. doi: 10.1517/17460441.2012.687720. [DOI] [PubMed] [Google Scholar]
- 42.Wu JT, Wu LH, Knight JA. Stability of NADPH: effect of various factors on the kinetics of degradation. Clin Chem. 1986;32:314–319. [PubMed] [Google Scholar]
- 43.Hofmann D, Wirtz A, Santiago-Schubel B, Disko U, Pohl M. Structure elucidation of the thermal degradation products of the nucleotide cofactors NADH and NADPH by nano-ESI-FTICR-MS and HPLC-MS. Anal Bioanal Chem. 2010;398:2803–2811. doi: 10.1007/s00216-010-4111-z. [DOI] [PubMed] [Google Scholar]
- 44.Gooljarsingh LT, Fernandes C, Yan K, Zhang H, Grooms M, Johanson K, Sinnamon RH, Kirkpatrick RB, Kerrigan J, Lewis T, Arnone M, King AJ, Lai Z, Copeland RA, Tummino PJ. A biochemical rationale for the anticancer effects of Hsp90 inhibitors: slow, tight binding inhibition by geldanamycin and its analogues. Proc Natl Acad Sci U S A. 2006;103:7625–7630. doi: 10.1073/pnas.0602650103. [DOI] [PMC free article] [PubMed] [Google Scholar]
- 45.Uitdehaag JC, Sunnen CM, van Doornmalen AM, de Rouw N, Oubrie A, Azevedo R, Ziebell M, Nickbarg E, Karstens WJ, Ruygrok S. Multidimensional profiling of CSF1R screening hits and inhibitors: assessing cellular activity, target residence time, and selectivity in a higher throughput way. J Biomol Screen. 2011;16:1007–1017. doi: 10.1177/1087057111418113. [DOI] [PubMed] [Google Scholar]
- 46.Vauquelin G. Determination of drug–receptor residence times by radioligand binding and functional assays: experimental strategies and physiological relevance. Medicinal chemistry communications. 2012:645–651. [Google Scholar]
- 47.Motulsky HJ, Mahan LC. The kinetics of competitive radioligand binding predicted by the law of mass action. Mol Pharmacol. 1984;25:1–9. [PubMed] [Google Scholar]
Associated Data
This section collects any data citations, data availability statements, or supplementary materials included in this article.