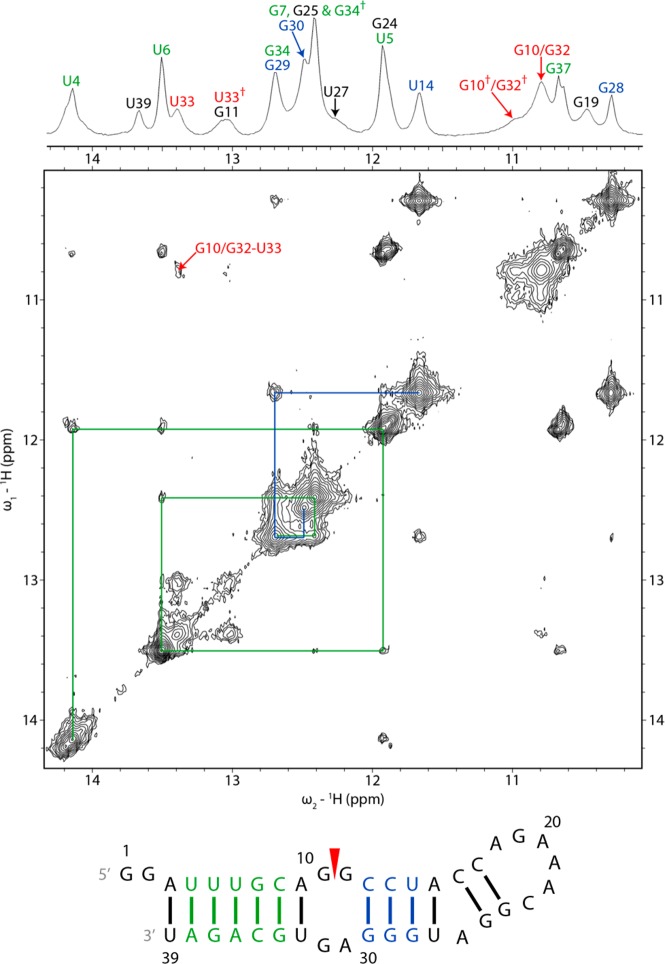
Figure 2.
Imino proton region of 1D and 2D proton NMR spectra of the 39 nt construct showing sequential proton walks with blue and green lines. The water signal was suppressed with a 1–1–echo pulse in the 1D spectrum and an S-pulse in the 2D NOESY spectrum. The daggers in the 1D spectrum mark chemical exchange peaks. The spectra were acquired at −2 °C with a mixing time of 125 ms for the 2D spectrum. Addition of 5 and 10 mM Mg2+ caused minor shifts and sharpening of the imino resonances, including U4, U5, U6, G11, G19, G24, and U33 (Figure S3 of the Supporting Information).

