Abstract
Reportedly, serum ferritin levels are much lower in Japanese hemodialysis (HD) patients than their Western counterparts. Therefore, the cutoff values of ferritin and transferrin saturation (TSAT) for iron deficiency might differ from other countries. We conducted a cross-sectional observational study using the Japanese nationwide registry data. We enrolled 142,339 maintenance HD patients and assessed the association between these markers, hemoglobin (Hb), and erythropoiesis-stimulating agent (ESA) resistance index (ERI) utilizing restricted cubic spline analyses. Median ferritin and TSAT levels were 73 (IQR: 31–158) ng/ml and 23.7 (16.8–32.0)%, respectively. These lower ferritin ranges may possibly stem from a lower inflammatory state in Japanese patients, as shown in median CRP of 1.0 mg/l. An adjusted nonlinear association between Hb and TSAT showed that Hb levels drop with the decrease in TSAT below 20%, regardless of serum ferritin levels, suggesting the absolute iron deficiency cutoff as 20% for TSAT. In patients with TSAT >20%, the association between Hb and ferritin levels is nearly flat, whereas in patients with TSAT <20%, ferritin <50 ng/ml was associated with low Hb. In long-acting ESAs-users with TSAT >20%, U-shaped relationship was observed between ERI and ferritin with the bottom of ERI around 100 ng/ml of ferritin, possibly because high ferritin levels reflected an inflamed state leading to hyporesponsiveness to ESA. The patient subgroup with TSAT <20% and ferritin >100 ng/ml had significantly higher ERIs compared with the subgroup with TSAT >20% and ferritin <100 ng/ml, implying that TSAT, rather than ferritin, should be a primary iron marker predicting ESA response.
Keywords: ESA response, ferritin, inflammation, TSAT
INTRODUCTION
Anemia guidelines in chronic kidney disease all over the world vary, especially with regard to the cutoff values of iron parameters, namely ferritin and transferrin saturation (TSAT), below which iron administration is recommended. In the original Kidney Disease Outcomes Quality Initiative guidelines published in 2001,1 the targets of ferritin and TSAT were greater than 100 ng/ml and 20%, respectively. In European Best Practice Guidelines in 2004,2 the targets of these markers were 200–500 ng/ml and 30–50%, respectively. The similar target ranges were also advocated by the Caring for Australasians with Renal Impairment guidelines.3 The revised K/DOQI guidelines in 2006 recommended a slightly higher target ranges compared with the prior ones; >200 ng/ml for ferritin and >20% for TSAT.4 In the Kidney Disease Improving Global Outcomes guidelines recently published,5 an iron trial was recommended in patients with ferritin ⩽500 ng/ml and TSAT ⩽30% if an increase in hemoglobin (Hb) concentration or a decrease in erythropoiesis-stimulating agents (ESAs) is desired. In brief, renal anemia guidelines in Western countries are becoming liberal in prescribing iron preparations while limiting ESA doses. This might be reasonable, considering the fact that many studies that tried to drive Hb levels up by excessive dosing of ESAs have resulted in worse outcomes6, 7, 8, and it also might be plausible, considering recent clinical trials showing that iron administration was beneficial in terms of objective symptoms9 and renal function10 in patients with congestive heart failure, even in the state of functional iron deficiency that often complicates congestive heart failure.
However, Japanese guidelines are still conservative in the prescription of iron, having lower target ranges of iron parameters than Western countries, despite much lower ESA doses currently used.11 Only when there is TSAT <20% and (not or) ferritin <100 ng/ml, iron administration is recommended in dialysis patients.12 The reason partly lies in the fact that intravenous administration of a certain iron preparation increases oxidative stress.13 Some Japanese nephrologists do not recommend iron administration to patients with functional iron deficiency14 characterized with high ferritin and low TSAT, because of a possibility of iron accumulation in such organs as liver, leukocytes, and cardiovascular system, leading to liver toxicity, impaired immunity, and atherosclerosis, respectively. In fact, bolus iron injection is reported to increase the risk of infection-related hospitalization.15 Therefore, Japanese guidelines have recommended iron administration exclusively to the patients with absolute iron deficiency. However, evidences of the cutoffs of iron parameters reflecting absolute iron deficiency are very scarce in Japanese hemodialysis (HD) patients. Given that serum ferritin distribution ranges of Japanese maintenance HD patients are much lower than those of Western countries,16 the data in Europe and North America cannot be extrapolated to Japanese patients.
The aims of this Japanese nationwide cross-sectional study are (1) to elucidate the cutoff of TSAT or ferritin levels under which Hb levels decrease (the cutoff of absolute iron deficiency) in Japanese maintenance HD patients and (2) to examine the ranges of iron parameters where ESA responsiveness is best. The latter might give us some insights of the cutoff values of iron markers showing relative hyporesponsiveness to ESA.
RESULTS
Characteristics of the study subjects
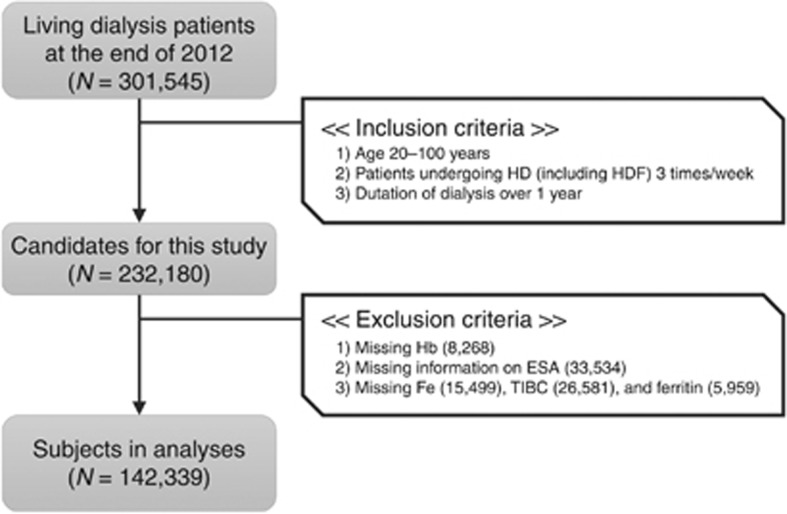
As shown in Figure 1, we excluded a total of 89,841 patients, due to missing values in the key variables for anemia in the survey: Hb, type of ESA, Fe, total iron-binding capacity, and ferritin. Eventually, 142,339 in-center maintenance HD patients were enrolled. Table 1 summarizes the characteristics of the study subjects. The median (interquartile range (IQR)) levels were 23.7 (16.8–32.0)% for TSAT, 73 (31–158) ng/ml for ferritin, 1.0 (1.0–4.0) mg/l for C-reactive protein (CRP), and 126 (68–206) pg/ml for parathyroid hormone (PTH). Compared with HD patients in Western countries, the study population had a longer duration of dialysis, lower levels of body mass index, ferritin, CRP, and PTH, probably due to different clinical practice patterns. There were 33,352 (23.4%) subjects treated with epoetin alpha or beta (Epo A/B), 61,992 (43.6%) with darbepoetin (Darb), 17,338 (12.2%) with epoetin beta pegol (Pegol), and less than 10% with other ESAs, including epoetin kappa. The remaining subjects (11.9%) did not receive any ESA. There were no clinically meaningful differences between the subjects we analyzed and the population that met the inclusion criteria but was not included in the analyses due to missing data.
Figure 1.
Flowchart of the subject selection process in this study. Briefly, 142,339 in-center maintenance hemodialysis patients, undergoing 3 sessions per week, aged 20–100 years, with duration of dialysis of 12 months or more, and without missing data in the key variables for anemia, were selected from the original data set that comprised of 301,545 living dialysis patient records. ESA, erythropoiesis-stimulating agent; Fe, serum iron; Hb, hemoglobin; HD, hemodialysis; HDF, hemodiafiltration; TIBC, total iron-binding capacity.
Table 1. Characteristics of the study subjects.
| Study subjects | Patients who met with inclusion criteria | |
|---|---|---|
| Number | 142,339 | 232,180 |
| Female (%) | 37.4 | 37.4 |
| Age (years) | 66.8±12.3 | 66.8±12.3 |
| Duration of dialysis (years) | 6.5 (3.3–11.8) | 6.6 (3.3–11.9) |
| Diabetes (%) | 36.5 | 36.4 |
| BMI (kg/m2) | 21.5±3.8 | 21.4±3.8 |
| Serum albumin (g/dl) | 3.7±0.4 | 3.7±0.4 |
| Hemoglobin (g/dl) | 10.7±1.2 | 10.6±1.2 |
| TSAT (%) | 23.7 (16.8–32.0) | 23.6 (16.8–32.0) |
| Ferritin (ng/ml) | 73 (31–158) | 75 (31–162) |
| CRP (mg/l) | 1.0 (1.0–4.0) | 1.0 (1.0–4.0) |
| Intact PTH (pg/ml) | 126 (68–206) | 126 (66–207) |
| Kt/V | 1.44 (1.27–1.64) | 1.44 (1.26–1.64) |
| Past history of CVDs (%) | ||
| Myocardial infarction | 9.7 | 9.8 |
| Cerebral infarction | 18.2 | 18.5 |
| Cerebral hemorrhage | 6.0 | 6.1 |
| Amputation of the extremities | 3.5 | 2.0 |
| Blood pressure (mm Hg) | ||
| Systolic | 152±24 | 152±24 |
| Diastolic | 78±15 | 78±15 |
| Antihypertensive drug use (%) | 66.9 | 66.3 |
| Current smoking (%) | 13.4 | 13.3 |
| ESAs (%) | ||
| No ESA | 11.9 | 12.2 |
| Epoetin alpha/beta | 23.4 | 23.2 |
| Darbepoetin | 43.6 | 42.9 |
| Epoetin beta pegol | 12.2 | 12.2 |
| Others | 8.9 | 9.5 |
Abbreviations: BMI, body mass index; CRP, C-reactive protein; CVD, cardiovascular disease; ESA, erythropoiesis-stimulating agent; HD, hemodialysis; IQR, interquartile range; PTH, parathyroid hormone; TSAT, transferrin saturation.
The values are expressed as mean±s.d. or median (IQR).
Distributions of TSAT and ferritin
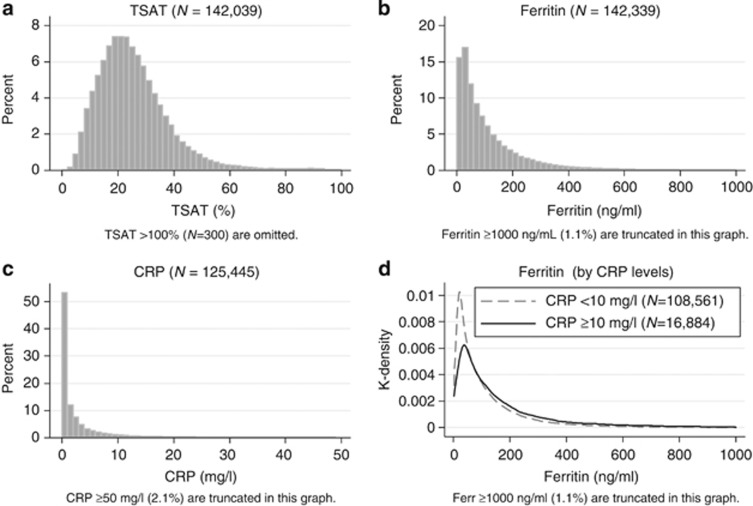
The distributions of TSAT, ferritin, and CRP were right-skewed (Figure 2a–c). The proportions of the subjects who met the criteria of TSAT <20%, ferritin <100 ng/ml, and both were 36.3, 60.2, and 28.0%, respectively. When divided by the CRP level at 10 mg/l, which was in the 87th percentile of CRP, the medians (IQR) of ferritin were 62 (29–149) and 102 (46–216) among the patients with CRP <10 mg/l and CRP ⩾10 mg/l, respectively (Figure 2d). The stratified distributions of ferritin showed a significant—(P<0.05)—but clinically subtle difference; both median values were obviously low compared with the median values of ferritin among dialysis patients in Western countries.16
Figure 2.
Distributions of iron markers. Distributions of TSAT, ferritin, and CRP (a–c), and stratified distributions of ferritin by CRP levels (d).The distributions of TSAT, ferritin, and CRP were right-skewed. In d, the subjects were stratified by CRP level at 10 mg/l, which denoted the 87th percentile of CRP. The median and IQR of CRP were 62 (IQR: 29–149) and 102 (46–216) among the patients with CRP <10 mg/l and CRP ⩾10 mg/l, respectively. CRP, C-reactive protein; IQR, interquartile range; TSAT, transferrin saturation.
Associations between Hb and iron markers
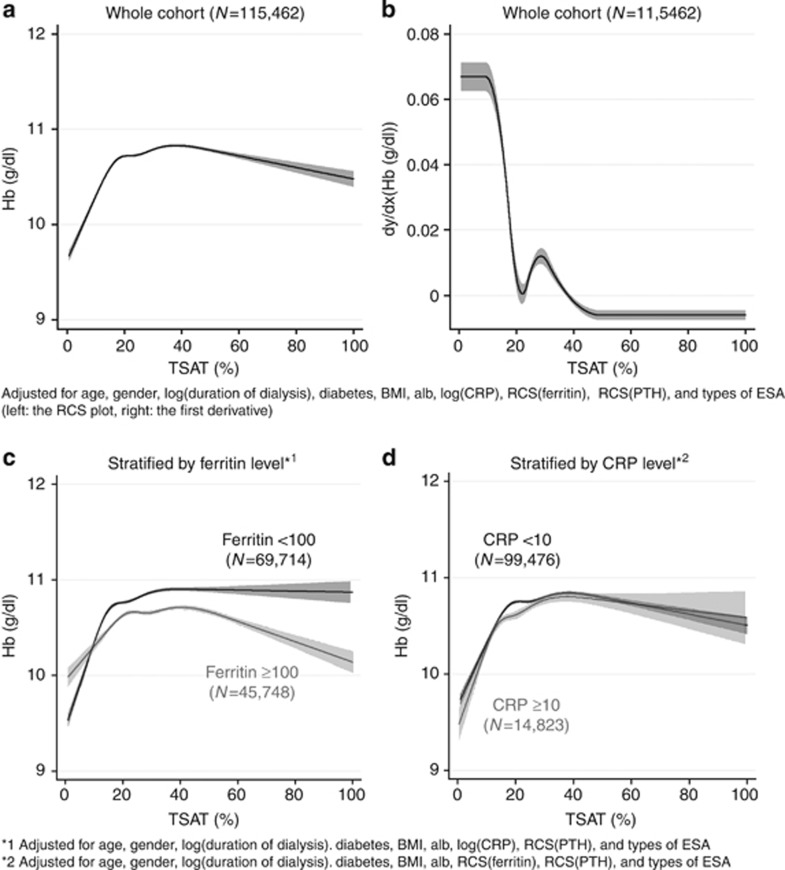
The nonlinear association between Hb and TSAT showed a remarkable elevation of Hb, with the increase in the TSAT level up to 20% then the slope became gradual, followed by a plateau where the TSAT level was around 40% (Figure 3a). Hb levels were adjusted for many important factors depicted in the figure legend. The further adjustment for Kt/V, blood pressure, antihypertensive drug use, prior history of cardiovascular diseases, and smoking status did not affect their association (data not shown). The first derivative curve clearly showed the significance of an inflexion point at TSAT 20% (Figure 3b). The slope existed consistently in stratified analyses by ferritin at 100 ng/ml, with a steeper slope in the ranges of TSAT <20% in the subjects with ferritin <100 ng/ml (Figure 3c), whereas the restricted cubic spline (RCS) curves of Hb showed a similar pattern when stratified by CRP at 10 mg/l (Figure 3d).
Figure 3.
The association between TSAT and hemoglobin. RCS plot of Hb by level of TSAT (a) and its first derivative curve (b), and RCS plots stratified by ferritin level at 100 ng/ml (c) and by CRP level at 10 mg/l (d). The RCS plot of Hb (a) and the first derivative curve (b) were adjusted for age, gender, duration of dialysis, diabetes, BMI, Alb, CRP, PTH, ferritin, and types of ESA. The RCS curves in the stratified analyses did not include either ferritin (c) or CRP (d) in the predictive model. All the RCS curves showed a significant positive correlation between TSAT and Hb in the range of TSAT less than 20%, and a plateau at the level of TSAT around 40%. There was a significant difference in the pattern of the stratified RCS curves between the patients with ferritin <100 ng/ml and those with ⩾100 ng/ml (c). Alb, albumin; BMI, body mass index; CRP, C-reactive protein; ESA, erythropoiesis-stimulating agent; Hb, hemoglobin; PTH, parathyroid hormone; RCS, restricted cubic spline; TSAT, transferrin saturation.
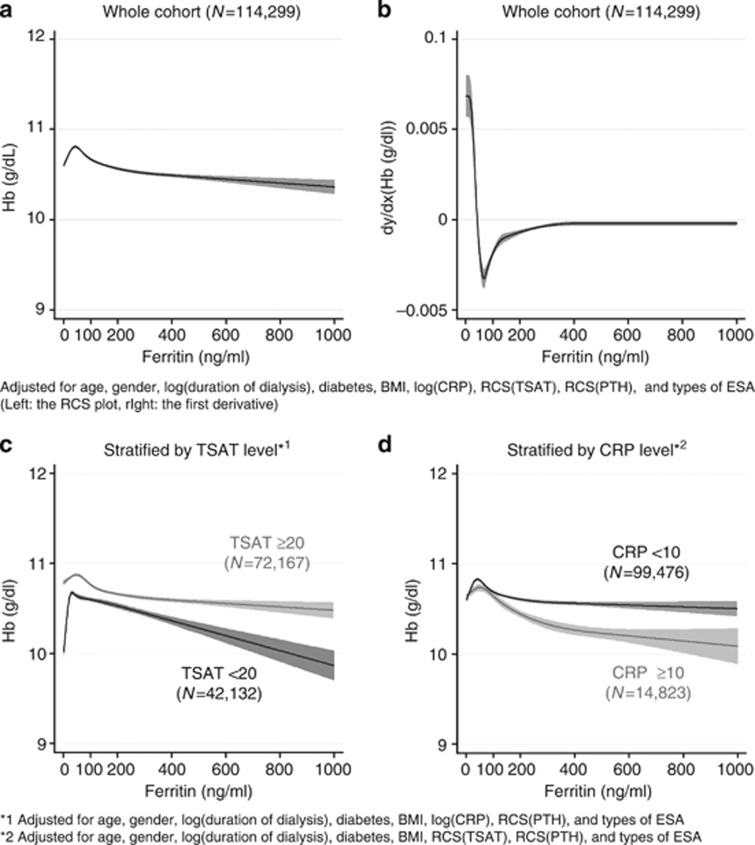
Figure 4a and b demonstrates a nonlinear association and its first derivative curve between Hb and ferritin. The inverted U-shaped curve of Hb had a small peak around 50 ng/ml of ferritin. Thereafter, it showed a slight decline in Hb as ferritin increased. The stratified analyses by TSAT at 20% showed remarkable differences in the pattern of the curves; a low ferritin level (ferritin<50 ng/ml) was associated with lower Hb only when the TSAT levels were less than 20%, and there was a steeper decline in Hb as ferritin increased beyond 100 ng/ml among the patients with TSAT <20% than those with TSAT ⩾20% (Figure 4c). In those patients with TSAT ⩾20%, the association between ferritin and Hb was nearly flat. In the stratified analysis by CRP at 10 mg/l, we observed a mild decline in Hb in the patients with CRP ⩾10 mg/l, whereas there was little contribution of ferritin to Hb levels among those with CRP <10 mg/l (Figure 4d).
Figure 4.
The association between ferritin and hemoglobin. RCS plots of Hb by level of TSAT (a) and its first derivative curves (b), and RCS plots stratified by ferritin level at 100 ng/ml; serum ferritin <100 ng/ml (c) and ⩾100 ng/ml (d).The RCS plot of Hb (a) and the first derivative curve (b) were adjusted for age, gender, duration of dialysis, diabetes, BMI, Alb, CRP, PTH, TSAT, and types of ESA. The RCS curve demonstrated an inverted U-shaped relationship with the peak of Hb at 50 ng/ml of ferritin. The stratified analyses did not include either ferritin (c) or CRP (d) in the predictive model. A rapid drop in Hb at ferritin <50 ng/ml was only seen in the patients with TSAT <20%. The patients with TSAT ⩾20% had higher Hb levels than those with TSAT <20% across a full range of ferritin (c). Higher CRP was associated with lower Hb (d). Alb, albumin; BMI, body mass index; CRP, C-reactive protein; ESA, erythropoiesis-stimulating agent; Hb, hemoglobin; PTH, parathyroid hormone; RCS, restricted cubic spline; TSAT, transferrin saturation.
Analyses of the association of TSAT and ferritin with Hb stratified by the type of ESA
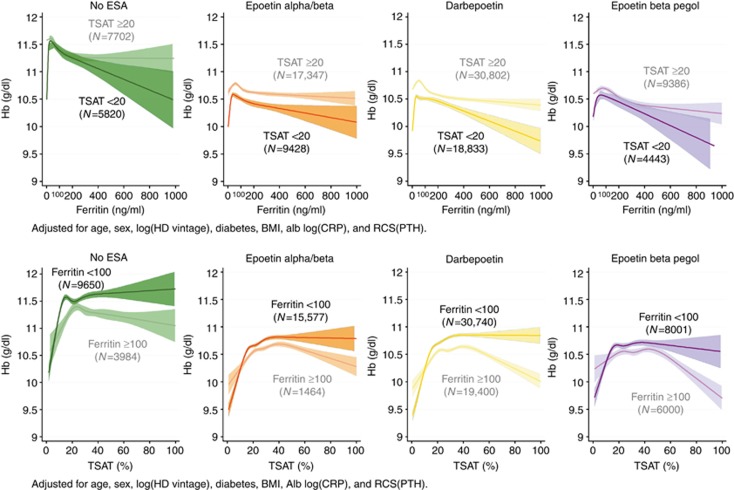
Generally, the Hb levels in the no-ESA group were significantly higher than those of the other ESA groups. There was a consistent, inverted U-shaped association between Hb and ferritin levels in the patients with TSAT <20% across all ESA groups (Figure 5 upper panels). The ferritin level at the peak Hb ranged from 50 to 100 ng/ml. The Hb levels in the subgroup of TSAT <20% in any ESA group were consistently lower than those of TSAT ⩾20% irrespective of ferritin level. Higher ferritin levels were negatively associated with Hb, especially when TSAT was less than 20%, suggesting less efficient iron utilization in this population. On the other hand, the Hb levels in the subgroup of ferritin <100 ng/ml were actually higher than those of ferritin ⩾100 ng/ml, except when TSAT was less than 10–20% (Figure 5 lower panels).
Figure 5.
RCS plots of Hb by levels of ferritin (upper panels) and TSAT (lower panels) across different ESA groups (no ESA, epoetin alpha/beta, darbepoetin, and epoetin beta pegol), stratified by TSAT and ferritin levels, respectively. There was a positive correlation between ferritin and Hb in the range of ferritin less than 50 ng/ml and a negative correlation in the range above 100 ng/ml of ferritin across all types of ESAs in the patients with TSAT <20%. However, there was no obvious decline in Hb in the patients with ferritin <50 ng/ml, if TSAT is 20% or more (upper panels). TSAT was positively correlated with Hb level when TSAT is less than 20%, irrespective of both ferritin level and the type of ESA (lower panels). Alb, albumin; BMI, body mass index; CRP, C-reactive protein; ESA, erythropoiesis-stimulating agent; Hb, hemoglobin; HD, hemodialysis; PTH, parathyroid hormone; RCS, restricted cubic spline; TSAT, transferrin saturation.
Adjusted ESA resistance index across the subgroups of TSAT and ferritin
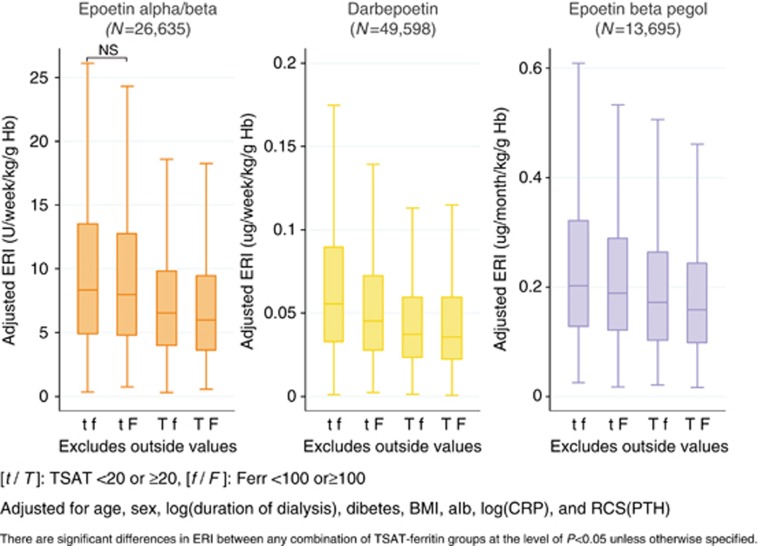
Figure 6 demonstrates the adjusted ESA resistance indexes (ERIs) across different subgroups of TSAT and ferritin. In every ESA group, there was a consistent stepwise decrease in adjusted ERI in the order of subgroups tf, tF, Tf, and TF, which denotes TSAT <20% and ferritin <100 ng/ml, TSAT <20% and ferritin ⩾100 ng/ml, TSAT ⩾20% and ferritin <100 ng/ml, and TSAT ⩾20% and ferrritin ⩾100 ng/ml, respectively. It is noteworthy that adjusted ERIs of subgroups Tf were significantly lower than those of subgroups tF, as well as subgroups tf, suggesting that the lower TSAT level had a larger impact on the elevation of ERI than the lower ferritin level. The further adjustment for blood pressure, antihypertensive drug use, prior history of cardiovascular diseases, and current smoking status did not affect the results (data not shown).
Figure 6.
Adjusted ERI according to the subgroups of TSAT and ferritin. After being stratified by ESAs, the patients were further divided into four subgroups according to TSAT and ferritin levels. The groups tf, tF, Tf, and TF denote the patients with TSAT <20 and ferritin <100, TSAT <20 and ferritin ⩾100, TSAT ⩾20 and ferritin <100, and TSAT ⩾20 and ferrritin ⩾100, respectively. The ERI levels were adjusted for age, gender, duration of dialysis, diabetes, BMI, Alb, CRP, and PTH within each type of ESA. Alb, albumin; BMI, body mass index; CRP, C-reactive protein; ERI, erythropoiesis resistance index; ESA, erythropoiesis-stimulating agent; Hb, hemoglobin; NS, not significant; PTH, parathyroid hormone; RCS, restricted cubic spline; TSAT, transferrin saturation.
Analyses of the association of TSAT and ferritin with ERI stratified by the type of ESA
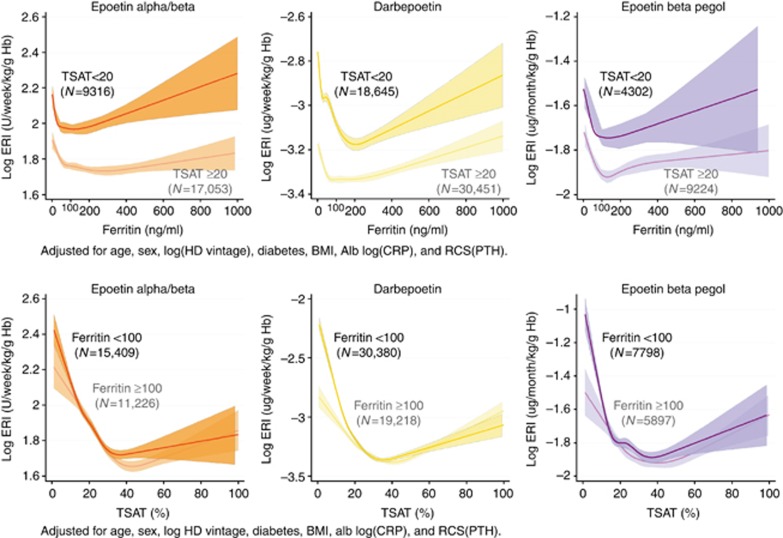
The RCS plots clearly showed an acute elevation of ERI as ferritin decreased beyond the apparent threshold of 100 ng/ml irrespective of the TSAT level. On the other hand, the patients with TSAT <20% had higher ERI than those with TSAT ⩾20% across a full range of ferritin levels (Figure 7 upper panels). Among the ESA users with TSAT ⩾20%, U-shaped relationships between ERI and ferritin were observed with the bottom of the ERI curve around 100 ng/ml of ferritin, possibly because high ferritin levels reflected an inflamed state leading to hyporesponsiveness to ESA. The association between ERI and TSAT also showed a U-shaped relationship with the bottom of the ERI curve around 30–40% of TSAT, implying that TSAT from 20 to 40% might be the marginal zone for its target range. The slope of ERI at TSAT <20% was much steeper among the patients with ferritin below 100 ng/ml than those above 100 ng/ml, suggesting the synergistic effect of low TSAT and low ferritin levels on ERIs. Intriguingly, this effect was relatively larger in long-acting ESA groups (Darb and Pegol) than the conventional short-acting ESA (Epo A/B) (Figure 7 lower panels).
Figure 7.
RCS plots of Hb by level of ferritin (upper panels) and TSAT (lower panels) across different ESA groups (no ESA, epoetin alpha/beta, darbepoetin, and epoetin beta pegol), stratified by TSAT and ferritin levels, respectively. The RCS plots showed a remarkable elevation of ERI as ferritin decreased beyond the threshold of 100 ng/ml irrespective of the TSAT level. ERI was positively correlated with the ferritin level in the range of ferritin ⩾100 ng/ml (upper panels). The association between ERI and TSAT also showed a U-shaped relationship with the bottom of the ERI curve around 30–40% of TSAT (lower panels). Alb, albumin; BMI, body mass index; CRP, C-reactive protein; ERI, erythropoiesis resistance index; Hb, hemoglobin; HD, hemodialysis; PTH, parathyroid hormone; RCS, restricted cubic spline; TSAT, transferrin saturation.
DISCUSSION
In this study, we investigated associations between iron markers and parameters of erythropoiesis in Japanese maintenance HD patients by using one of the largest HD registries in the world. The results clearly showed that the conventional cutoff of TSAT less than 20% was valid and clinically plausible for iron deficiency anemia, even in Japanese HD patients who were less prone to an inflamed state than their Western counterparts. On the other hand, serum ferritin levels of less than 50 ng/ml, or the conventional cutoff at 100 ng/ml, were significantly associated with anemia; however, it was true only when accompanied by TSAT <20%.
TSAT
We found that Hb levels markedly elevated with the increase in TSAT until 20%, then gradually reached a plateau at levels around 40%, followed by a mild decrease thereafter (Figure 3a). The RCS curve of ERI with TSAT levels (Figure 7 lower panels) showed a mirror image with that of Hb with TSAT (Figure 5 lower panels), where the inflexion point of ERI was also at 20–40% of TSAT across all types of ESAs. These findings were in line with previous observations; some reported a positive linear association between Hb and TSAT in chronic kidney disease patients at TSAT levels below 40%,4 and others demonstrated that a low TSAT level was associated not only with worse hyporesponsiveness to ESA,17 but also with higher mortality18, 19 in maintenance HD patients. A recent publication by Gaweda et al.20 clearly showed a nonlinear association between relative Hb response and TSAT levels in a longitudinal observational study. The gradual decrease in Hb at TSAT levels above 40% may be attributed to a decrease in total iron-binding capacity, which is often associated with malnutrition.21 Given no obvious difference between the RCS curves of subgroups of patients with CRP <10 mg/l and CRP ⩾10 mg/l, an inflamed state is unlikely to affect the association between TSAT and Hb.
Ferritin
It has been known that a very low ferritin level (<30 ng/ml) is indicative of absolute iron deficiency22 and that chronic kidney disease patients, including those undergoing HD, would have sufficient or increased bone marrow iron stores at the ferritin levels above 120–300 ng/ml.23, 24, 25 Thus, the serum ferritin level has been one of the gauges of iron adequacy in HD patients. In the present study, however, the association between Hb and ferritin was less apparent than that of Hb and TSAT (Figures 3a and 4a). The peculiar shape of their association curve with a small peak of Hb at 50 ng/ml of ferritin might explain two different aspects of ferritin; it positively correlated with iron stores in the body when the serum ferritin level was below 50 ng/ml, and at the same time it negatively reflected the efficiency of iron utilization in erythropoiesis when ferritin was above that level. A greater disease burden, such as inflammation, under-dialysis, malnutrition, infection, and secondary hyperparathyroidism may affect the latter characteristic of ferritin.17, 26 Indeed, there was a significant interaction between CRP and ferritin in the association with Hb (Figure 4d). The RCS curve of ERI with ferritin in the present study (Figure 7 upper panels) resembled the mirror image of the plot of the mean erythropoietic response by ferritin reported by Gaweda et al.27 However, our result was a little different from the study recently reported by the same authors, using longitudinal analysis, in which the erythropoietic response improved monotonously with a plateau in Hb response at higher ferritin levels.20 The reasons mainly lie in the facts that the data were collected cross-sectionally in our study, but more importantly, lie in the finding that there was a significant interaction between TSAT and ferritin.
Interaction between TSAT and Ferritin
TSAT is the most commonly used measure of the availability of iron to support erythropoiesis, and ferritin is the most commonly used test for evaluation of iron storage, for which the ‘gold standard' is the examination of a bone marrow aspiration stained for iron.28 The effect modification between TSAT and ferritin had not been explored. In the present study, we clearly demonstrated their clinically important interactions; the RCS curve of Hb in the patients with ferritin <100 ng/ml showed a steeper decline toward lower TSAT levels below 20% than those with ferritin ⩾100 ng/ml, implying a more severe iron deficiency in these patients, and we observed a gradual decrease in Hb at TSAT levels above 40% only in the patients with ferritin ⩾100 ng/ml, implying a relatively lower efficiency in iron utilization (Figure 3c). On the other hand, the association between ferritin and Hb was also affected by the TSAT level; we observed a rapid drop in Hb at ferritin levels below 50 ng/ml only in the patients with TSAT <20% (Figure 4c). In other words, if we could keep TSAT levels above 20%, a low level of ferritin might not be associated with anemia. Taking into account the findings that the patients with TSAT below 20% showed constantly lower Hb levels and higher ERIs (Figure 7) than those above 20% at any given level of ferritin, it would be reasonable to think that those patients were suffering at least from functional iron deficiency, and to consider an iron trial to improve Hb levels, possibly leading to a decrease in ESA doses. In this sense, TSAT, rather than ferritin, should be prioritized as an iron marker predicting ESA response. The finding in Figure 6 may also support this idea. Downplaying the importance of the ferritin criterion will enable the Japanese guidelines to focus on the more important TSAT gauge of iron deficiency erythropoiesis. Thus, it is not a question of TSAT <20% and ferritin <100 ng/ml as the criteria, but TSAT <20% or ferritin <50–100 ng/ml when we consider an iron trial.
About ESA subclasses
We further investigated subgroup analyses across different types of ESAs. The characteristics of the curves were substantially consistent across the groups. The long-acting ESAs demonstrated larger differences in ERIs between the patients with ferritin below 100 ng/ml and above 100 ng/ml at TSAT <20% (Figure 7 lower panels). These differences may imply that long-acting ESAs that can induce gradual and long-term erythropoiesis are more sensitive to iron stores in the body, or ferritin levels, than the conventional ESA.
Limitations
Our study has several limitations. First, because of its cross-sectional and observational nature, the present study may not provide definite information about the causal relationship. Therefore, interpretation of the results requires modesty and discretion. Second, our analysis models did not include several key variables, such as information about intravenous or oral iron supplementation, transfusion, and serum hepcidin levels. However, iron supplementation and transfusion are less common in Japan compared with Western countries16. The left-shifted distribution of serum ferritin levels of our subjects compared with that of Western countries16, 18, 20 may support this view. Therefore, the effect of further adjustment for these variables should be relatively small. As for serum hepcidin levels, despite their biological importance in iron regulation, a number of clinical studies have shown their uselessness in predicting erythropoietic response.29, 30 Hence, there would have been little, if any, effect on our results. Third, as this study only included Japanese patients, the extrapolation of our results to end-stage renal disease patients with different backgrounds requires a careful consideration. Fourth, the present study only shed light on the lower target ranges of TSAT and ferritin levels from the standpoint of iron deficiency erythropoiesis, and did not provide any information about the upper thresholds. Despite many controversial opinions, the upper thresholds should also be defined by clinical evidences, such as organ dysfunction like liver toxicity and mortality. Such evidences are very scarce in Japanese HD patients, who have a remarkably lower inflammatory status.31 Hence, we can neither be too liberal to import US upper thresholds of ferritin directly to the Japanese guidelines, nor be too conservative to adopt theoretical negative consequences in decision making.
Given these limitations, the present study clearly showed that the thresholds of iron markers for iron-deficiency erythropoiesis in Japanese HD patients could be more liberal to put a primary importance on TSAT levels, leaving ferritin levels as secondary. Moreover, as far as we know, this is the first study to report clinically significant interactions in iron-deficiency erythropoiesis between TSAT and ferritin, and a significant difference in the associations between ERI and TSAT across the types of ESAs with the RCS models using a large-scaled nationwide registry.
In conclusion, we investigated the association of iron markers and Hb or ERI in Japanese HD patients, searching for the lower thresholds regarding iron-deficiency erythropoiesis. The threshold of TSAT (<20%) has a greater clinical impact than that of ferritin (<50–100 ng/ml), and thus TSAT should be prioritized as an iron marker. Further studies are needed to confirm our findings in a longitudinal model and, finally, in a clinical trial.
MATERIALS AND METHODS
Data source
We conducted a cross-sectional study using the registry data of the Japanese Society for Dialysis Therapy (JSDT). The JSDT has been conducting annual surveys of all accessible dialysis facilities throughout Japan since 1968, and the response rate of their questionnaire about facility-based information has been around 99% every year.32 The data collection process is described in detail elsewhere.32 In 2012, we collected information about anemia treatment (e.g., type of ESA, ESA doses per week or month, serum iron (Fe), total iron-binding capacity, and serum ferritin) at individual levels.
Study subjects
A standard analysis file (JRDR-14101) that was prepared for this study originally contained 301,545 records of living Japanese dialysis patients as of 31 December 2012, of which 232,180 met our inclusion criteria: undergoing HD three times per week, at least for the past 12 months, and being 20 years of age or older. Therefore, almost all subjects were Asian.
Measurements
TSAT was calculated by the ratio of Fe and total iron-binding capacity, multiplied by 100. The values scored above 100 were omitted and dealt with as missing values. In the present study, we calculated the ERI, defined as weight-adjusted ESA dose per week (U/week/kg for Epo A/B and μg/week/kg for Darb) or month (μg/month/kg for Pegol) divided by Hb level (g/dl). As for PTH levels, the reported values in facilities measuring whole PTH, the third-generation PTH assay, were converted to intact PTH levels by the formula: intact PTH=whole PTH × 1.7.33 The laboratory parameters, except for post-dialysis serum urea nitrogen and body weight, which were used to calculate Kt/V34 and body mass index, respectively, were measured before the start of the first dialysis session of a given week.
Statistical analyses
Continuous variables were expressed as mean±s.d. and median with IQR for normal and non-normal distribution, respectively, and categorical variables as percentages. Data were excluded if they were judged to be probable data-entry errors. We investigated the association between ERI or Hb and iron indicators, with adjustment for demographics (age, gender, duration of dialysis, diabetes mellitus, body mass index,35 and Alb36) and known confounders (CRP37 and intact PTH38, 39). We further adjusted for other clinical variables previously reported in literature,17, 40 such as adequacy of dialysis, blood pressures, antihypertensive drug use, prior history of cardiovascular diseases, and current smoking status, as a sensitivity analysis. Patients were defined as diabetic when diabetes mellitus was the primary cause of end-stage renal disease. All continuous variables with right-skewed distribution (e.g., ERI, duration of dialysis, CRP, and PTH) were logarithmically transformed before analyses. Because of possible nonlinear relationships of TSAT, ferritin levels, and PTH with ERI or Hb, we fitted RCS models with three knots and performed multivariable regression analyses. First, we investigated the associations of Hb with TSAT and ferritin, respectively, in all the subjects to ascertain the plausible stratification by TSAT at 20% and ferritin at 100 ng/ml, which are the cutoff points in the conventional Japanese guidelines for renal anemia in HD patients.12 In order to further evaluate the inflexion points of the RCS curves of TSAT and ferritin, we depicted their first derivative curves. Subgroup analyses divided by clinically plausible cutoff values of either ferritin, TSAT, or CRP were performed. Second, because the pharmacokinetic properties were different according to the types of ESA, as well as the units of ERI, we additionally performed stratified RCS regression analyses by ESAs. Third, we calculated individual adjusted ERIs by using a regression model that contained age, gender, duration of dialysis, diabetes, Alb, CRP, and PTH in each ESA group. We categorized the subjects into four groups by the cutoff points of TSAT at 20% and ferritin at 100 ng/ml to examine their combined effects on ERI with adjustment for the other variables. Between-group comparisons of adjusted ERIs within each ESA stratus were performed using the Tukey–Kramer method. Finally, we investigated the association of ERI with TSAT and ferritin, respectively, using the RCS model in each ESA group. All statistical tests were two-tailed and a P-value <0.05 was considered significant. Statistical analyses were performed using Stata/SE 13.1 software for Windows (Stata, College Station, TX, USA).
Acknowledgments
Data were obtained with the permission of the Committee of Renal Data Registry of the JSDT. The opinions reflected in this manuscript are those of the authors alone and do not reflect an official position of the JSDT. This supplement was supported by a grant from the 59th Annual Meeting of the JSDT.
Takayuki Hamano has received consulting fees from GlaxoSmithKline, Kyowa Medex Company, lecture fees from Chugai Pharm Co., Kyowa-Hakko Kirin Co., Torii Pharma Co., Bayer, Eisai, Otsuka Pharm Co., and grant support from Chugai, Baxter, Bayer, Asahi-Kasei, Otsuka, and Eisai. NF has received lecture fees from Bayer and grant support from The Kidney Foundation and Kyowa Hakko Kirin. Terumasa Hayashi declared no competing interests. HY received lecture fees from Kyowa-Hakko Co. Ltd and Chugai Pharmaceutical Co. Ltd KI received consulting fee from Kyowa Hakko Kirin Co. Ltd; lecture fees from Bayer Yakuhin Ltd, Chugai Pharmaceutical Co. Ltd, Kyowa Hakko Kirin Co. Ltd, Merck Sharp & Dohme Corp, Teijin Pharma Limited, Astellas, Daiichi-Sankyo, Mochida, and Torii Pharmaceutical Co., Ltd. YT received consulting fees from Chugai Pharmaceutical Co. Ltd, GlaxoSmithKline K.K. Kyowa Hakko Kirin Co. Ltd, and Taisho Pharmaceutical Co. Ltd; lecture fees from Bayer Yakuhin Ltd, Chugai Pharmaceutical Co. Ltd, Kissei Pharmaceutical Co. Ltd, Kyowa Hakko Kirin Co. Ltd, Otsuka Pharmaceutical Co. Ltd, and Torii Pharmaceutical Co. Ltd; grant support from Asahi Kasei Corporation., Baxter Limited, Bayer Yakuhin Ltd, Chugai Pharmaceutical Co. Ltd, Eisai Co. Ltd. and Otsuka Pharmaceutical Co. Ltd.
References
- IV. NKF-K/DOQI Clinical Practice Guidelines for Anemia of Chronic Kidney Disease: update 2000. Am J Kidney Dis. 2001;37:S182–S238. doi: 10.1016/s0272-6386(01)70008-x. [DOI] [PubMed] [Google Scholar]
- Locatelli F, Aljama P, Barany P, et al. Revised European best practice guidelines for the management of anaemia in patients with chronic renal failure. Nephrol Dial Transplant. 2004;19 (Suppl 2):ii1–47. doi: 10.1093/ndt/gfh1032. [DOI] [PubMed] [Google Scholar]
- Roger S. The CARI guidelines. Haematological targets. Iron. Nephrology (Carlton) 2006;11 (Suppl 1):S217–S229. doi: 10.1111/j.1440-1797.2006.00647.x. [DOI] [PubMed] [Google Scholar]
- KDOQI; National Kidney Foundation KDOQI Clinical Practice Guidelines and Clinical Practice Recommendations for Anemia in Chronic Kidney Disease. Am J Kidney Dis. 2006;47:S11–S145. doi: 10.1053/j.ajkd.2006.03.010. [DOI] [PubMed] [Google Scholar]
- Kidney Disease: Improving Global Outcomes (KDIGO) Anemia Work Group KDIGO Clinical Practice Guideline for Anemia in Chronic Kidney Disease. Kidney Int Suppl. 2012;2:279–335. [Google Scholar]
- Drueke TB, Locatelli F, Clyne N, et al. Normalization of hemoglobin level in patients with chronic kidney disease and anemia. N Engl J Med. 2006;355:2071–2084. doi: 10.1056/NEJMoa062276. [DOI] [PubMed] [Google Scholar]
- Singh AK, Szczech L, Tang KL, et al. Correction of anemia with epoetin alfa in chronic kidney disease. N Engl J Med. 2006;355:2085–2098. doi: 10.1056/NEJMoa065485. [DOI] [PubMed] [Google Scholar]
- Pfeffer MA, Burdmann EA, Chen CY, et al. A trial of darbepoetin alfa in type 2 diabetes and chronic kidney disease. N Engl J Med. 2009;361:2019–2032. doi: 10.1056/NEJMoa0907845. [DOI] [PubMed] [Google Scholar]
- Anker SD, Comin Colet J, Filippatos G, et al. Ferric carboxymaltose in patients with heart failure and iron deficiency. N Engl J Med. 2009;361:2436–2448. doi: 10.1056/NEJMoa0908355. [DOI] [PubMed] [Google Scholar]
- Toblli JE, Lombrana A, Duarte P, et al. Intravenous iron reduces NT-pro-brain natriuretic peptide in anemic patients with chronic heart failure and renal insufficiency. J Am Coll Cardiol. 2007;50:1657–1665. doi: 10.1016/j.jacc.2007.07.029. [DOI] [PubMed] [Google Scholar]
- McFarlane PA, Pisoni RL, Eichleay MA, et al. International trends in erythropoietin use and hemoglobin levels in hemodialysis patients. Kidney Int. 2010;78:215–223. doi: 10.1038/ki.2010.108. [DOI] [PubMed] [Google Scholar]
- Tsubakihara Y, Nishi S, Akiba T, et al. 2008 Japanese Society for Dialysis Therapy: guidelines for renal anemia in chronic kidney disease. Ther Apher Dial. 2010;14:240–275. doi: 10.1111/j.1744-9987.2010.00836.x. [DOI] [PubMed] [Google Scholar]
- Maruyama Y, Nakayama M, Yoshimura K, et al. Effect of repeated intravenous iron administration in haemodialysis patients on serum 8-hydroxy-2'-deoxyguanosine levels. Nephrol Dial Transplant. 2007;22:1407–1412. doi: 10.1093/ndt/gfl789. [DOI] [PubMed] [Google Scholar]
- Nakanishi T, Kuragano T, Kaibe S, et al. Should we reconsider iron administration based on prevailing ferritin and hepcidin concentrations? Clin Exp Nephrol. 2012;16:819–826. doi: 10.1007/s10157-012-0694-3. [DOI] [PMC free article] [PubMed] [Google Scholar]
- Brookhart MA, Freburger JK, Ellis AR, et al. Infection risk with bolus versus maintenance iron supplementation in hemodialysis patients. J Am Soc Nephrol. 2013;24:1151–1158. doi: 10.1681/ASN.2012121164. [DOI] [PMC free article] [PubMed] [Google Scholar]
- Bailie GR, Larkina M, Goodkin DA, et al. Variation in intravenous iron use internationally and over time: the Dialysis Outcomes and Practice Patterns Study (DOPPS) Nephrol Dial Transplant. 2013;28:2570–2579. doi: 10.1093/ndt/gft062. [DOI] [PubMed] [Google Scholar]
- Kalantar-Zadeh K, Lee GH, Miller JE, et al. Predictors of hyporesponsiveness to erythropoiesis-stimulating agents in hemodialysis patients. Am J Kidney Dis. 2009;53:823–834. doi: 10.1053/j.ajkd.2008.12.040. [DOI] [PMC free article] [PubMed] [Google Scholar]
- Kalantar-Zadeh K, Regidor DL, McAllister CJ, et al. Time-dependent associations between iron and mortality in hemodialysis patients. J Am Soc Nephrol. 2005;16:3070–3080. doi: 10.1681/ASN.2005040423. [DOI] [PubMed] [Google Scholar]
- Pollak VE, Lorch JA, Shukla R, et al. The importance of iron in long-term survival of maintenance hemodialysis patients treated with epoetin-alfa and intravenous iron: analysis of 9.5 years of prospectively collected data. BMC Nephrol. 2009;10:6. doi: 10.1186/1471-2369-10-6. [DOI] [PMC free article] [PubMed] [Google Scholar]
- Gaweda AE, Bhat P, Maglinte GA, et al. TSAT is a better predictor than ferritin of hemoglobin response to Epoetin alfa in US dialysis patients. Hemodial Int. 2014;18:38–46. doi: 10.1111/hdi.12078. [DOI] [PMC free article] [PubMed] [Google Scholar]
- Bross R, Zitterkoph J, Pithia J, et al. Association of serum total iron-binding capacity and its changes over time with nutritional and clinical outcomes in hemodialysis patients. Am J Nephrol. 2009;29:571–581. doi: 10.1159/000191470. [DOI] [PMC free article] [PubMed] [Google Scholar]
- Kalantar-Zadeh K, Hoffken B, Wunsch H, et al. Diagnosis of iron deficiency anemia in renal failure patients during the post-erythropoietin era. Am J Kidney Dis. 1995;26:292–299. doi: 10.1016/0272-6386(95)90649-5. [DOI] [PubMed] [Google Scholar]
- Hussein S, Prieto J, O'Shea M, et al. Serum ferritin assay and iron status in chronic renal failure and haemodialysis. Br Med J. 1975;1:546–548. doi: 10.1136/bmj.1.5957.546. [DOI] [PMC free article] [PubMed] [Google Scholar]
- Mirahmadi KS, Paul WL, Winer RL, et al. Serum ferritin level. Determinant of iron requirement in hemodialysis patients. JAMA. 1977;238:601–603. doi: 10.1001/jama.238.7.601. [DOI] [PubMed] [Google Scholar]
- Aljama P, Ward MK, Pierides AM, et al. Serum ferritin concentration: a reliable guide to iron overload in uremic and hemodialyzed patients. Clin Nephrol. 1978;10:101–104. [PubMed] [Google Scholar]
- Kalantar-Zadeh K, McAllister CJ, Lehn RS, et al. Effect of malnutrition-inflammation complex syndrome on EPO hyporesponsiveness in maintenance hemodialysis patients. Am J Kidney Dis. 2003;42:761–773. doi: 10.1016/s0272-6386(03)00915-6. [DOI] [PubMed] [Google Scholar]
- Gaweda AE, Goldsmith LJ, Brier ME, et al. Iron, inflammation, dialysis adequacy, nutritional status, and hyperparathyroidism modify erythropoietic response. Clin J Am Soc Nephrol. 2010;5:576–581. doi: 10.2215/CJN.04710709. [DOI] [PMC free article] [PubMed] [Google Scholar]
- Lipschitz DA, Cook JD, Finch CA. A clinical evaluation of serum ferritin as an index of iron stores. N Engl J Med. 1974;290:1213–1216. doi: 10.1056/NEJM197405302902201. [DOI] [PubMed] [Google Scholar]
- Kato A, Tsuji T, Luo J, et al. Association of prohepcidin and hepcidin-25 with erythropoietin response and ferritin in hemodialysis patients. Am J Nephrol. 2008;28:115–121. doi: 10.1159/000109968. [DOI] [PubMed] [Google Scholar]
- Tessitore N, Girelli D, Campostrini N, et al. Hepcidin is not useful as a biomarker for iron needs in haemodialysis patients on maintenance erythropoiesis-stimulating agents. Nephrol Dial Transplant. 2010;25:3996–4002. doi: 10.1093/ndt/gfq321. [DOI] [PubMed] [Google Scholar]
- Bazeley J, Bieber B, Li Y, et al. C-reactive protein and prediction of 1-year mortality in prevalent hemodialysis patients. Clin J Am Soc Nephrol. 2011;6:2452–2461. doi: 10.2215/CJN.00710111. [DOI] [PMC free article] [PubMed] [Google Scholar]
- Nakai S, Watanabe Y, Masakane I, et al. Overview of regular dialysis treatment in Japan (as of 31 December 2011) Ther Apher Dial. 2013;17:567–611. doi: 10.1111/1744-9987.12147. [DOI] [PubMed] [Google Scholar]
- Fukagawa M, Yokoyama K, Koiwa F, et al. Clinical practice guideline for the management of chronic kidney disease-mineral and bone disorder. Ther Apher Dial. 2013;17:247–288. doi: 10.1111/1744-9987.12058. [DOI] [PubMed] [Google Scholar]
- Shinzato T, Nakai S, Fujita Y, et al. Determination of Kt/V and protein catabolic rate using pre- and postdialysis blood urea nitrogen concentrations. Nephron. 1994;67:280–290. doi: 10.1159/000187980. [DOI] [PubMed] [Google Scholar]
- Locatelli F, Andrulli S, Memoli B, et al. Nutritional-inflammation status and resistance to erythropoietin therapy in haemodialysis patients. Nephrol Dial Transplant. 2006;21:991–998. doi: 10.1093/ndt/gfk011. [DOI] [PubMed] [Google Scholar]
- Agarwal R, Davis JL, Smith L. Serum albumin is strongly associated with erythropoietin sensitivity in hemodialysis patients. Clin J Am Soc Nephrol. 2008;3:98–104. doi: 10.2215/CJN.03330807. [DOI] [PMC free article] [PubMed] [Google Scholar]
- Locatelli F, Altieri P, Andrulli S, et al. Predictors of haemoglobin levels and resistance to erythropoiesis-stimulating agents in patients treated with low-flux haemodialysis, haemofiltration and haemodiafiltration: results of a multicentre randomized and controlled trial. Nephrol Dial Transplant. 2012;27:3594–3600. doi: 10.1093/ndt/gfs117. [DOI] [PMC free article] [PubMed] [Google Scholar]
- Rao DS, Shih MS, Mohini R. Effect of serum parathyroid hormone and bone marrow fibrosis on the response to erythropoietin in uremia. N Engl J Med. 1993;328:171–175. doi: 10.1056/NEJM199301213280304. [DOI] [PubMed] [Google Scholar]
- Drueke TB, Eckardt KU. Role of secondary hyperparathyroidism in erythropoietin resistance of chronic renal failure patients. Nephrol Dial Transplant. 2002;17 (Suppl 5):28–31. doi: 10.1093/ndt/17.suppl_5.28. [DOI] [PubMed] [Google Scholar]
- Movilli E, Cancarini GC, Zani R, et al. Adequacy of dialysis reduces the doses of recombinant erythropoietin independently from the use of biocompatible membranes in haemodialysis patients. Nephrol Dial Transplant. 2001;16:111–114. doi: 10.1093/ndt/16.1.111. [DOI] [PubMed] [Google Scholar]


