

Abstract
The motivation for this study was to determine if a statistically significant correlation exists between blood glucose (BG) and transdermal glucose (TG) collected by passive diffusion. A positive outcome will indicate that noninvasive passive TG diffusion is a painless alternative to collecting blood through a break on the skin. Sampling involves placing a small volume of buffer solution on the surface of membrane or skin for 5 minutes. The sample is then assayed with fluorescent GBP. In vitro testing was done on regenerated cellulose and a porcine skin model to determine diffusion of standard glucose solutions. In vivo testing was done on a healthy subject and a subject with type 2 diabetes. Glucose diffused readily through the regenerated cellulose membrane with good correlation between surface and internal glucose concentrations (R 2 = .997). But the porcine skin model required a surface prewash to achieve the same good correlation R 2 = .943). Based on this, an optimum prewash step was determined for the in vivo studies. The resulting correlation coefficients between TG and BG after a 15-minute prewash in a healthy subject and type 2 subject were .87 and .93, respectively. Removal of the extraneous glucose in the skin by prewashing was an important step in achieving good correlation between TG and BG. The results suggest that passive collection of TG is a noninvasive alternative to current practice of breaking the skin. Further studies are under way to determine the lag time between TG and BG and for the sampling protocol to be more amenable to point-of-care application.
Keywords: noninvasive glucose sensing, fluorescent glucose binding protein
The primary motivation for noninvasive glucose sensing is that current blood glucose monitors require intermittent blood collection through a prick on the finger. This procedure is not conducive to good patient compliance as it causes discomfort and pain. In a recent review of noninvasive methods of glucose sensing,1 it was noted that work on various technologies in the last 30 or more years has yielded no commercially available noninvasive glucose measuring device. Here, we report a noninvasive glucose monitoring system that directly measures glucose diffusing through the skin (transdermal glucose) without aggressive application of physical or chemical enhancements. This is a very significant development in noninvasive glucose sensing that to our knowledge has not been explored. A small volume of buffer solution is simply allowed to sit on the skin surface for a few minutes (5 minutes in this article). This passive collection of transdermal glucose (TG), unlike current glucose meters and CGM (continuous glucose monitoring) systems, does not require breaking the skin and therefore does not cause pain, exposure to potential infection, or a foreign body response. There is no use of abrasion,2,3 tape stripping,4 iontophoresis,5-8 laser poration,9-10 ultrasound,3,11 vacuum,10,12 heat,13 or chemical application on the skin.14 The glucose collected is directly sensed by a biosensor (glucose binding protein, GBP) and not indirectly through surrogates (eg, gases permeating through breath and skin). Unlike optical noninvasive methods such as near-15-16 and mid-infrared,17 Raman,18-20 photoacoustic,17,21 or impedance spectroscopy,22-23 the glucose is not detected through a large background of skin and tissue. In fact, there is practically no background contribution as the skin acts as a semipermeable membrane allowing mainly glucose, small molecules, and ions to pass through. This is also an advantage over other biofluids such as tears24 and saliva,25 which can contain about 10 times more glucose but are more complex mixtures. The TG concentration is 103 to 104 times less than blood and interstitial glucose levels,26 but the sensitivity of the GBP biosensor (Kd ~ 0.25 µM) falls exactly within this range and is ideal for detecting these trace glucose amounts.
The phenomenon of glucose diffusing passively through skin and dissolving in a small volume of water sitting on the surface is (in retrospect) intuitive. But the complexity of the skin structure and the function of skin as a barrier may have contributed to opinion in current literature that physical or chemical preparation of the skin is required to extract measurable amounts of glucose through skin.14,27-30 There is a possibility that others have tried this method, but never progressed because in the past there were no ways of measuring the almost trace amounts of glucose with a sensor that is comparable to the practicality of the current glucometers. The Yellow Stone Instruments, which is generally utilized as a comparative method to determine the accuracy of experimental glucose sensors, is appropriate for serum and blood glucose concentrations but does not have the sensitivity for these micromolar glucose levels. The same can be said for the hexokinase standard method.31 We have successfully used the more sensitive high performance anion exchange chromatography with pulsed electrochemical detection (HPAEC-PED) as the standard method for validating the GBP data.32 However, HPAEC-PED is difficult to reduce to a low-cost device that can compete with current glucose meters in the clinical setting. On the other hand, the GBP biosensor is fluorescence based and can be easily integrated into a low-cost, handheld fluorometer for ambulatory or bedside applications. Thus, the feasibility of this noninvasive TG sensing method relies heavily on the highly sensitive nature of the GBP.
In a previous article,26 we showed passively collected TG tracking changes in blood glucose (BG). However, the correlation between TG and BG was very poor. In this article, we show that the presence of a depot of glucose in the stratum corneum is a confounding factor leading to poor correlation. This glucose likely originates from the hydrolysis of glucosylceramide as membrane bilayers critical for the epidermal permeability barrier transition from the inner to the outer stratum corneum.33 We hypothesized that extensive washing followed by drying will improve TG and BG correlation. We proceeded to test this hypothesis in vitro on a porcine skin model, and in vivo on the skin of a normal subject and a type 2 diabetes subject.
Methods
Materials
Glucose, DEAE Sephadex A-50, Sephadex G-25, N,N-dimethylformamide, NaCl, KH2PO4, Na2HPO4, NaH2PO4, and MgCl2 were purchased from Sigma-Aldrich (St. Louis, MO). Tryptone and yeast extract were obtained from Thermo Scientific (Fairlawn, NJ). Slide-A-lyzer dialysis cassettes were purchased from Thermo Scientific (Rockford, IL). 6-Acryloyl-2-dimethylaminonaphthalene (acrylodan) was purchased from Molecular Probes (Eugene, OR).
Biosensor
The fluorescent GBP biosensor was prepared as described in Ge et al.32 Briefly, modifications to the GBP structure to convert it into a fluorescence-based biosensor involved introducing a cysteine mutation at an allosteric site at the 255 position. The protein was expressed in E. coli NM303 at the periplasmic space. The protein is then extracted by osmotic shock and purified by anion exchange chromatography. The GBP was labeled with the polarity sensitive dye, acrylodan in the L255C position. Unreacted dye is removed by size-exclusion chromatography. The labeled GBP responds to increasing glucose concentrations by a decrease in fluorescence intensity.34
Steady State Fluorescence Measurements
Steady state fluorescence intensities of GBP labeled with acrylodan in the absence and in the presence of D-glucose were measured with a Varian Cary Eclipse fluorescence spectrophotometer. The acrylodan label was excited at 390 nm with a slit width of 5 nm. The emission spectra were then obtained in the range 400 to 650 nm with maximum florescence emission (Emmax) occurring at approximately 510 nm. Similarly, the fluorescence intensities of a sample were recorded multiple times (466 readings) using the following conditions: a constant emission wavelength (510 nm) with an excitation wavelength (390 nm), emission and excitation slit width 5 nm, PMT detector voltage 900 V, average read time 0.25 seconds, and total duration time 2 minutes. The fluorescence intensities of each sample were averaged to reduce the noise. Subsequently, a signal change was obtained from (F0-F)/F0, where F0, and F were the fluorescence intensity of GBP in the absence and presence of glucose, respectively.
Calibration Curve Construction
A 2 mM glucose solution was prepared by dissolving D-glucose in phosphate buffer saline (PBS), pH 7.5, for use as a stock solution. The stock solution was further diluted to the following concentrations: 4, 8, 10, 20, 50, 100 μM. A total of 5 μl of these standards were added to 250 μL of GBP in a 1.5 mL quartz cuvette and gently mixed well. Thus, final total glucose concentrations in the assay, including bound and free glucose, were 0.08, 0.23, 0.41, 0.78, 1.67, and 3.43 μM. The (F0-F)/F0 values were plotted against glucose concentration to obtain the calibration curve.
In Vitro Studies
For the in vitro studies we constructed the test chamber shown in Figure 1. Glucose solutions of known concentration and comparable to BG levels (30 mL standard glucose solutions 2.0, 4.0, 5.5, 8.0, 10, 20, and 33mM) were contained in the chamber. The membrane, regenerated cellulose or porcine skin, was placed on top of the chamber and then clamped in place as shown. After assembling the apparatus, the regenerated cellulose membrane surface was rinsed with PBS and dried with air before extracting glucose on the surface. To wash the porcine skin, the assembled chamber was inverted on to a beaker of continuously stirred PBS. The wash step is to remove any extraneous glucose on the surface as well as any glucose residing in the skin tissue.
Figure 1.

Set-up for in vitro testing of glucose passive diffusion through regenerated cellulose membrane or porcine skin.
A syringe containing 150 μL of PBS was used to extract glucose by repeated aspiration on a 1 cm2 surface area at 10 seconds for the regenerated cellulose and 30 seconds for the porcine skin. The steady state glucose concentration on the membranes was determined by taking samples immediately upon assembly and after 60 minute for the regenerated cellulose membrane and 30 and 60 minutes for the porcine skin.
In Vivo Studies
We determined the required time of washing the skin to remove surface glucose, as well as glucose residing in the stratum corneum. This is to make sure that the glucose collected reflects the level of glucose in the blood. The subject, who has been fasting overnight, was made to wash her hands in soap, water and DI water and then air dried them. The finger is dipped in water agitated with a magnetic stirrer for 2 minutes. The finger is dried by blowing filtered air for 2 minutes. The sampling cycle is as follows: The finger was placed on the opening of a 1.5-mL Eppendorf tube containing an aliquot of 250 µL PBS. The tube is inverted so that the PBS is in contact with approximately 1 cm2 area of the finger and let stand for 2 minutes. The tube is inverted back to the upright position and the prewash is discarded. The finger is dried by blowing filtered air for 2 minutes. A clean tube containing 250 µL PBS was again inverted onto the finger and allowed to stand for 5 minutes. This is the sampling step. The tube is inverted back to the upright position and the sample is stored for analysis. The sampling cycle is repeated 5 times. The wash time in agitated water was changed to 10 and 15 minutes followed by 5 sampling cycles each time. Note that each of these wash experiments was done on separate days to ensure that the subject has been fasting overnight. The 15-minute wash was found to achieve the desired steady state and was used in consequent oral glucose challenge tests.
For the glucose challenge tests, a normal subject and a subject with type 2 diabetes were tested. The protocol followed was as described above with a 15-minute wash in agitated water. Three TG samples were taken during the fasting stage at intervals of about 1 h. Corresponding capillary BG was determined by finger stick method (ReliOn Confirm glucose meter). A total of 75 grams of glucose was then given to the subject, and the TG and BG were determined every hour for 3 hours. Of the TG samples, 15 µL aliquots were added to 250 µL of the GBP solution. The fluorescence intensities were measured as previously described for the glucose standard solutions and the change in intensities were calculated against GBP without sample. The glucose concentrations in the samples were quantified from the previously determined calibration curve. Correlation coefficients were calculated by plotting TG versus BG.
Results
GBP Calibration Curve
The emission spectra of GBP labeled with acrylodan are shown in Figure 2 left. The fluorescence intensity decreases with increasing glucose concentration. The standard curve is typically fitted to a single-site binding isotherm. However, only the linear range of the assay was used to determine unknown glucose concentrations in the samples as it is the most sensitive part of the curve and the most convenient to use for analytical purposes. The linear range of GBP is 0.080 to 0.41 µM (Figure 2 right). Note that these are the calculated glucose concentrations in the cuvette after 5 µL of the standard solutions are added to 250 µL of the GBP.
Figure 2.

(Left) Emission spectra of GBP with increasing concentrations of glucose. A 5 µL aliquot of each standard glucose solution (4, 8, 10, 20, 50, 100 µM) was added to a 250 µL sample of fluorescent GBP to generate a calibration curve (Right). The linear range between 0.08 and 0.41 µM total glucose was used for analysis.
In Vitro Studies
We hypothesized that for the surface glucose concentration to be well correlated to the glucose concentration on the surface, sampling of the surface should take place when the surface has achieved a steady state glucose concentration. For the single layer of regenerated cellulose, this occurs almost instantly because the membrane is very thin and hydrophilic. Figure 3 shows the concentration of the glucose in the chamber plotted against the glucose collected on the surface when the surface sampling time was 10 seconds. It can be seen that the correlation is very good (R 2 = .997). The nonzero intercept may be caused by a dry or not fully hydrated membrane causing a small fraction of the sample buffer to diffuse through the membrane before the glucose within diffuses to the surface. Nevertheless, a good correlation was still obtained despite the nonzero intercept. A similar experiment in a previous article on the same membrane but slightly different sampling method gave a zero intercept.26
Figure 3.

Correlation between glucose collected on the surface of regenerated cellulose (10-second sampling time) and the glucose inside the chamber.
For the pig skin, a longer sampling time was used at 30 seconds but a similar glucose concentration in the chamber at 4.0 mM. We expected a low (perhaps zero) glucose concentration just prior to the porcine skin coming in contact with the glucose solution in the chamber (t = 0). The initial surface glucose collected was 26.01 µM (Figure 4). This is higher than expected considering the thicker and more hydrophobic pig skin than the regenerated cellulose. We surmised that this collected glucose is due to glucose residing on the surface, as well as within the skin tissue. To obtain a good correlation between the surface glucose and the glucose in the chamber, the porcine skin has to undergo a prewash to remove the extraneous glucose. This is accomplished by inverting the assembled chamber into a beaker of water equipped with a magnetic stirrer. The surface was washed for 30 minutes, dried, and then sampled for 30 seconds. The procedure was repeated for 60 min, dried and sampled as before. The results show that the 30- and 60-minute washings gave surface glucose of about 30 µM, which we took to be the steady state glucose concentration on the pig skin surface. To determine correlation between surface glucose and glucose in the chamber the skin surface was given a 60-minute prewash. When the glucose concentration in the chamber was plotted against surface glucose, the correlation coefficient, R 2 = .943 (Figure 5). The large difference in slopes between regenerated cellulose and porcine skin correlation plots (13.97 × 10⁻³ and 0.391 × 10⁻³, respectively) reflect the differences in diffusivity of these 2 membranes to glucose.
Figure 4.

Concentrations of glucose collected on the surface of porcine skin (30-second sampling time) immediately after and 30 and 60 minutes after contact with the glucose solution in the chamber.
Figure 5.

Correlation between glucose collected on the surface of porcine skin (60-minute prewash and 30-second sampling time) and glucose inside the chamber.
In Vivo Studies
It is clear from the in vitro studies on pig skin that for in vivo testing, the extraneous glucose on skin has to be removed with a prewash to achieve a good correlation between BG and TG. Testing different subjects, we observed the depletion of this extraneous glucose in every experiment. An example of such data is shown in Figure 6 of a 21-year-old healthy subject. This subject has very good control of glucose homeostasis as evidenced by the steady level of BG even with a carbohydrate-heavy meal on the second hour. However, a corresponding large initial drop in TG was observed in the first hour. After the first drop, succeeding samples began to follow BG levels. We attribute this to the depot of glucose already present in the stratum corneum which is not correlated to BG. As mentioned, this glucose is the product of the hydrolysis of glucosylceramide that occurs when the inner stratum transitions to the outer stratum corneum forming the epidermal permeability barrier.33 Thus, it was necessary to eliminate this extraneous glucose by washing the surface as in the in vitro studies. Following the procedure described in methods, we tested 2, 10, and 15 minutes of prewashing the finger in room temperature agitated water. These tests were made on 1 subject, but on different days. This necessitated normalizing the data by the value of the first wash to account for small differences in fasting glucose levels at the start of each day. The results in Figure 7 show that at 2-minute wash time the TG levels continued to decrease up to 5 sample cycles, while at the 10-minute wash time, 2 sample cycles were required before steady state was achieved. Extending the wash time to 15 minutes achieved the steady state on the first sample cycle. Thus, for the succeeding oral glucose challenge, the finger to be sampled was subjected to a 15-minute wash in agitated water. In a recent study by Moyer et al, where glucose in sweat was collected from the fingertips of human subjects, the first sample needed to be discarded due to surface glucose contamination, similar toresults shown here for passive collection.35 Sweating in this case was induced by application of the drug pilocarpine.
Figure 6.

Blood glucose (blue) and transdermal glucose (red) of a 21-year-old healthy subject. The initial drop in TG is due to glucose present in the stratum corneum that is not correlated to BG.
Figure 7.

Effect of the prewash time on achieving the steady state TG of a fasting subject. Data are normalized by the first wash cycle.
It is noted that several healthy adult subjects were given the oral glucose challenge test or a modified one where overnight fasting was followed by a high carbohydrate meal. The results from these healthy subjects are similar to that in Figure 6 where the glucose excursions were small and deemed insufficient to show the performance of the glucose monitoring method. Instead of reporting the results for all the healthy subjects, we chose to report here 1 representative set of data for normal and another set for the lone subject with type 2 diabetes. The results of the glucose challenge are shown in Figures 8 and 9, respectively. The excursions in glucose levels in the normal individual are more modest (5-7 mM BG; 1.5-3.5 µM TG) than those of the subject with type 2 diabetes (7-27 mM BG; 3.5-6 µM TG). The most significant result from these plots is that the BG levels follow the TG levels in both normal and type 2. Larger changes in TG were also observed in type 2. In addition, the correlation coefficients, R 2, of BG to TG are .87 and .933, respectively (Figures 10 and 11). These values are statistically significant (P = .007 for Figure 10 and P = .002 for Figure 11).
Figure 8.

Oral glucose challenge of a healthy subject showing both BG and TG (15-minute prewash and 5-minute sampling time).
Figure 9.

Oral glucose challenge of a subject with type 2 diabetes showing BG and TG (15-minute prewash and 5-minute sampling time).
Figure 10.

Correlation between TG and BG in a healthy subject (15-minute prewash and 5-minute sampling time).
Figure 11.
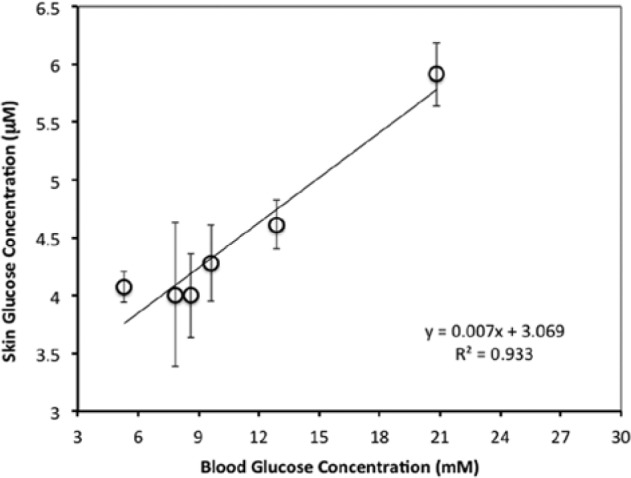
Correlation between TG and BG in a patient with type 2 diabetes (15-minute prewash and 5-minute sampling time).
While statistically significant, a lag between TG and BG becomes evident toward the latter part of the glucose challenge tests when there is faster glucose dynamics. The same is not apparent during the fasting period when there is little to no BG changes. We believe that because the measurement requires a 15-minute prewash and the sampling takes 5 minutes, the surface glucose concentration may lag behind the BG by approximately 20 minutes. A lag of about 17 minutes has been reported before in Kulcu et al,36 where TG was collected noninvasively by iontophoresis. Further investigation will be conducted to measure this delay and perhaps shorten it by, for example, increasing the temperature of the prewash and sampling buffers to 37°C.
Conclusions
TG has been investigated in the past as a potential noninvasive or minimally invasive sample for glucose monitoring. However, collection of TG requires application of either physical or chemical steps to induce sufficient glucose concentration for measurement with currently available enzymatic glucose sensors. In contrast, the submicromolar sensitivity of the GBP sensor used here allows for the determination of the low glucose concentrations collected through passive diffusion of glucose through the skin. A previous article26 showed that the levels collected on the skin are indeed measurable using the GBP. However, to advance this method to the clinic, it is necessary to investigate the feasibility of correlating passively collected TG levels with BG levels. In this article, we investigated the diffusivity of glucose through membranes of varying complexities ranging from the simple regenerated cellulose, porcine skin in vitro, and human skin in vivo. For the regenerated cellulose membrane, glucose diffusing to the surface almost immediately reached steady state. Surface glucose and glucose in the chamber are very well correlated. The porcine skin required removal of extraneous glucose on the surface and in the tissue by washing in agitated water for 30 and 60 minutes. Removing this glucose greatly improved the correlation between the glucose that has diffused to the surface and the glucose in the chamber. Based on these findings and initial in vivo experiments on healthy subjects, a wash step was added to the sampling protocol for the TG versus BG experiments. The optimum prewash time was determined to be 15 minutes in agitated room temperature water. Note that we are continuing to find a prewash time shorter than 15 minutes that will be more amenable at the point of care. Nevertheless, a good correlation between TG and BG was shown in both a healthy subject and a subject with type 2 diabetes. This implies that glucose that passively diffuses through the skin is a viable surrogate for BG without the need for breaking the skin and causing pain. A lag between TG and BG is observed similar to that reported in interstitial fluid and TG collected by iontophoresis.36 Future and current work involves automating the sampling protocol, testing it on our target population (neonates), and determining correction factors for skin diffusivity and lag time.
Acknowledgments
We thank Michael Tolosa for fabrication of the experimental chamber and Steve Falk of GE Maternal and Infant Care for useful insights during this project.
Footnotes
Abbreviations: BG, blood glucose; CGM, continuous glucose monitoring; GBP, glucose binding protein; HPAEC-PED, high performance anion exchange chromatography with pulsed electrochemical detection; PBS, phosphate buffered saline; PMT, photomultiplier tube; TG, transdermal glucose; YSI, Yellow Stone Instruments.
Declaration of Conflicting Interests: The author(s) declared no potential conflicts of interest with respect to the research, authorship, and/or publication of this article.
Funding: The author(s) disclosed receipt of the following financial support for the research, authorship, and/or publication of this article: NIH 1R41HD06920701 and partial salary support from General Electric.
References
- 1. Ciudin A, Hernandez C, Simo R. Noninvasive methods of glucose measurement: current status and future perspectives. Current Diabetes. 2012;8:48-54. [DOI] [PubMed] [Google Scholar]
- 2. Menzie M. Transdermal continuous glucose monitoring: a needle-free alternative to invasive sensors. Paper presented at: 12th Annual Diabetes Technology Meeting; 2012. [Google Scholar]
- 3. Chuang H, Trieu MQ, Hurley J, Taylor EJ, England MR, Nasraway SA. Pilot studies of transdermal continuous glucose measurement in outpatient diabetic patients and in patients during and after cardiac surgery. J Diabetes Sci Technol. 2008;2:595-602. [DOI] [PMC free article] [PubMed] [Google Scholar]
- 4. Cunningham DD, Young DF. Measurements of glucose on the skin surface, in stratum corneum and in transcutaneous extracts: implications for physiological sampling. Clin Chem Lab Med. 2003;41:1224-1228. [DOI] [PubMed] [Google Scholar]
- 5. Sieg A, Guy RH, Delgado-Charro MB. Electroosmosis in transdermal iontophoresis: implications for noninvasive and calibration-free glucose monitoring. Biophys J. 2004;87:3344-3350. [DOI] [PMC free article] [PubMed] [Google Scholar]
- 6. Sieg A, Guy RH, Delgado-Charro MB. Noninvasive glucose monitoring by reverse iontophoresis in vivo: application of the internal standard concept. Clin Chem. 2004;50:1383-1390. [DOI] [PubMed] [Google Scholar]
- 7. Rao G, Guy RH, Glikfeld P, et al. Reverse iontophoresis: noninvasive glucose monitoring in vivo in humans. Pharm Res. 1995;12:1869-1873. [DOI] [PubMed] [Google Scholar]
- 8. Connolly P, Cotton C, Morin F. Opportunities at the skin interface for continuous patient monitoring: a reverse iontophoresis model tested on lactate and glucose. IEEE Trans Nanobioscience. 2002;1:37-41. [DOI] [PubMed] [Google Scholar]
- 9. Jacques SL, McAuliffe DJ, Blank IH, Parrish JA. Controlled removal of human stratum corneum by pulsed laser. J Invest Dermatol. 1987;88:88-93. [DOI] [PubMed] [Google Scholar]
- 10. Burdick J, Chase P, Faupel M, Schultz B, Gebhart S. Real-time glucose sensing using transdermal fluid under continuous vacuum pressure in children with type 1 diabetes. Diabetes Technol Ther. 2005;7:448-455. [DOI] [PubMed] [Google Scholar]
- 11. Lee S, Nayak V, Dodds J, Pishko M, Smith NB. Glucose measurements with sensors and ultrasound. Ultrasound Med Biol. 2005;31:971-977. [DOI] [PubMed] [Google Scholar]
- 12. Gebhart S, Faupel M, Fowler R, et al. Glucose sensing in transdermal body fluid collected under continuous vacuum pressure via micropores in the stratum corneum. Diabetes Technol Ther. 2003;5:159-166. [DOI] [PubMed] [Google Scholar]
- 13. Paranjape M, Garra J, Schneider S, White T, Currie R. A PDMS dermal patch for non-intrusive transdermal glucose sensing. Sensors Actuators A: Physical. 2003;104:195-204. [Google Scholar]
- 14. Huang YB, Fang JY, Wu PC, Chen TH, Tsai MJ, Tsai YH. Noninvasive glucose monitoring by back diffusion via skin: chemical and physical enhancements. Biol Pharm Bull. 2003;26:983-987. [DOI] [PubMed] [Google Scholar]
- 15. Kajiwara K, Uemura T, Kishikawa H, et al. Noninvasive measurement of blood glucose concentrations by analysing Fourier transform infra-red absorbance spectra through oral mucosa. Med Biol Eng Comput. 1993;31(suppl):S17-S22. [DOI] [PubMed] [Google Scholar]
- 16. Burmeister JJ, Arnold MA, Small GW. Noninvasive blood glucose measurements by near-infrared transmission spectroscopy across human tongues. Diabetes Technol Ther. 2000;2:5-16. [DOI] [PubMed] [Google Scholar]
- 17. Pleitez MA, Lieblein T, Bauer A, Hertzberg O, von Lilienfeld-Toal H, Mäntele W. In vivo noninvasive monitoring of glucose concentration in human epidermis by mid-infrared pulsed photoacoustic spectroscopy. Anal Chem. 2013;85:1013-1020. [DOI] [PubMed] [Google Scholar]
- 18. Stuart DA, Yuen JM, Shah N, et al. In vivo glucose measurement by surface-enhanced Raman spectroscopy. Anal Chem. 2006;78:7211-7215. [DOI] [PubMed] [Google Scholar]
- 19. Dieringer JA, McFarland AD, Shah NC, et al. Surface enhanced Raman spectroscopy: new materials, concepts, characterization tools, and applications. Faraday Discuss. 2006;132:9-26. [DOI] [PubMed] [Google Scholar]
- 20. Enejder AM, Scecina TG, Oh J, et al. Raman spectroscopy for noninvasive glucose measurements. J Biomed Opt. 2005;10:031114. [DOI] [PubMed] [Google Scholar]
- 21. MacKenzie HA, Ashton HS, Spiers S, et al. Advances in photoacoustic noninvasive glucose testing. Clin Chem. 1999;45:1587-1595. [PubMed] [Google Scholar]
- 22. Caduff A, Dewarrat F, Talary M, Stalder G, Heinemann L, Feldman Y. Non-invasive glucose monitoring in patients with diabetes: a novel system based on impedance spectroscopy. Biosens Bioelectron. 2006;22:598-604. [DOI] [PubMed] [Google Scholar]
- 23. Caduff A, Hirt E, Feldman Y, Ali Z, Heinemann L. First human experiments with a novel non-invasive, non-optical continuous glucose monitoring system. Biosens Bioelectron. 2003;19:209-217. [DOI] [PubMed] [Google Scholar]
- 24. Chu MX, Miyajima K, Takahashi D, et al. Soft contact lens biosensor for in situ monitoring of tear glucose as non-invasive blood sugar assessment. Talanta. 2011;83:960-965. [DOI] [PubMed] [Google Scholar]
- 25. Abikshyeet P, Ramesh V, Oza N. Glucose estimation in the salivary secretion of diabetes mellitus patients. Diabetes Metab Syndr Obes. 2012;5:149-154. [DOI] [PMC free article] [PubMed] [Google Scholar]
- 26. Ge X, Rao G, Kostov Y, et al. Detection of trace glucose on the surface of a semipermeable membrane using a fluorescently labeled glucose-binding protein: a promising approach to noninvasive glucose monitoring. J Diabetes Sci Technol. 2013;7(1):4-12. [DOI] [PMC free article] [PubMed] [Google Scholar]
- 27. Pellett MA, Hadgraft J, Roberts MS. The back diffusion of glucose across human skin in vitro. Int J Pharm. 1999;193(1):27-35. [DOI] [PubMed] [Google Scholar]
- 28. Groenendaal W, von Basum G, Schmidt KA, et al. Quantifying the composition of human skin for glucose sensor development. J Diabetes Sci. Tech. 2010;4(5):1032-1040. [DOI] [PMC free article] [PubMed] [Google Scholar]
- 29. Nanda A, Nanda S, Ghilzai NM. Current developments using emerging transdermal technologies in physical enhancement methods. Curr Drug Deliv. 2006;3(3):233-242. [DOI] [PubMed] [Google Scholar]
- 30. Cunningham DD, Young DF. Measurements of glucose on the skin surface, in stratum corneum and in transcutaneous extracts: implications for physiological sampling. Clin Chem Lab Med. 2003;41(9):1224-1228. [DOI] [PubMed] [Google Scholar]
- 31. Sonowane M, Savory J, Cross RE, Heintges MG, Chester B. Kinetic measurement of glucose with a centrifugal analyzer: hexokinase and glucose oxidase procedures compared. Clin Chem. 1976;22(7):1100-1101. [PubMed] [Google Scholar]
- 32. Ge X, Lam H, Swati MJ, LaCourse WR, Rao G, Tolosa L. Comparing the performance of the optical glucose assay based on the glucose binding protein with high performance anion-exchange chromatography with pulsed electrochemical detection: efforts to design a low-cost point-of-care glucose sensor. J Diabetes Sci Technol. 2007;1(6):864-872. [DOI] [PMC free article] [PubMed] [Google Scholar]
- 33. Holleran W M, et al. Processing of epidermal glucosylceramides is required for optimal mammalian cutaneous permeability barrier function. J Clin Inv. 1993;91:1656-1664. [DOI] [PMC free article] [PubMed] [Google Scholar]
- 34. Tolosa L, Gryczynski I, Eichorn L, et al. Glucose sensor for low cost lifetime-based sensing using a genetically engineered protein. Anal Biochem. 1999;267(1):114-120. [DOI] [PMC free article] [PubMed] [Google Scholar]
- 35. Moyer J, Wilson D, Finkelshtein I, Wong B, Potts R. Correlation between sweat glucose and blood glucose in subjects with diabetes. Diabetes Technol Ther. 2012;14(5):398-402. [DOI] [PubMed] [Google Scholar]
- 36. Kulcu E, Tamada JA, Reach G, Potts RO, Lesho MJ. Physiological differences between instestitial glucose and blood glucose measured in human subjects. Diabetes Care. 2003;26(8):2405-2409. [DOI] [PubMed] [Google Scholar]