Abstract
In a randomized crossover trial the impact of continuous glucose monitoring (CGM) was tested on the occurrence of low blood glucose values measured by point of care (POC) measurement and on low glucose values measured by CGM in the interstitial fluid. A total of 41 type 1 diabetic patients (age 42.0 ± 11.4 years, diabetes duration 15.3 ± 10.1 years, A1c 8.2 ± 1.4%) used a CGM system (Dexcom SEVEN PLUS system) twice. In first study phase (CGM blind), patients were blind regarding the CGM current glucose levels and were not alerted when critical glucose values were reached. In the second phase (CGM real time), patients had access to current glucose levels and were alerted if critical glucose values were reached. During CGM real time the proportion of hypoglycemic POC blood glucose values were significantly reduced (7.5 ± 5.6% vs 10.1 ± 7.5%; P = .04), whereas the proportion of euglycemic blood glucose values were significantly enhanced (73.7 ± 18.3% vs 68.3 ± 12.1%; P = .01). The duration of low glucose periods in the interstitial fluid was significantly lower in the CGM real time phase (125 ± 89 vs 181 ± 125 minutes per day; P = .005). The time until a low blood glucose was detected by POC measurement was shortened by 33.2 ± 76.1 minutes (P = .03). The study demonstrated that CGM is able to not only reduce duration of hypoglycemia measured by CGM in interstitial fluid, but also reduce the proportion of low POC blood glucose measurements. In addition, hypoglycemia can be detected earlier.
Keywords: continuous glucose monitoring, hypoglycemia, type 1 diabetes
Continuous glucose monitoring (CGM) is a promising tool supporting people with diabetes in improving glycemic control without increasing the risk of hypoglycemia. Recent meta-analysis suggests that CGM use reduces the duration of hypoglycemic and hyperglycemic phases, whereas the time spent in euglycemia is prolonged.1,2 Thus, CGM promises to facilitate the avoidance of hypoglycemic glucose levels while improving overall glycemic control. The beneficial impact of CGM on avoiding high glucose values was not only demonstrated by glucose measurements of the CGM system itself, but also by the reduction of HbA1c.3,4 This is corroborated by recent studies and meta-analyses of studies that used early generation devices showing that overall glycemic control could be improved.2,5-7 In the meta-analysis, reductions between 0.2 and 0.7 A1c percentage points were observed due to the use of CGM.1,2
Furthermore there are also meta-analytic findings that the exposure to hypoglycemia could be reduced.1 However, the avoidance of severe hypoglycemia as a clinical endpoint by means of CGM could not be demonstrated.1,2 In contrast to the outcomes concerning the reduction of hyperglycemia, which could be corroborated by independent measures (eg, A1c) or episodes of ketoacidosis,1,2 the results regarding minimizing hypoglycemia relied only on the CGM measurements themselves. This is problematic since it is known that the results of CGM of early generation CGM systems in the hypoglycemic range are less concordant with laboratory or point of care (POC) measurements than the results of CGM in the eu- or hyperglycemic range. In the low glycemic range, mean absolute relative differences between CGM measurements and laboratory or POC measurement ranged from 14.5% to 38%.8-11 This indicates a rather problematic discordance between CGM and reference methods especially in the hypoglycemic range. Therefore, the confirmation of a low CGM measurement by way of POC or laboratory measurement is required in clinical care before corrective actions are undertaken.
In our study we analyze the impact of CGM on the avoidance of hypoglycemia determined not only by CGM measured hypoglycemia, but also by POC measurements. The primary outcome of the study is the reduction of the proportion of low blood glucose values by POC measurement and the time until a low blood glucose value is detected or confirmed by a POC measurement. Secondary outcomes include the impact of CGM measurement on the duration of hypo-, eu-, and hyperglycemic glucose phases measured by CGM. A subsequent analysis is performed to determine if an earlier detection of low blood glucose by POC measurements could also be corroborated by CGM measurements showing a shorter duration of a hypoglycemic glucose phase prior to the POC measurement while using the CGM system.
Methods and Subjects
Research Design
This study has a crossover design. Participation in the study required the use of CGM twice for 5 days. In the open study condition (CGM real time), subjects used current glucose values and trends; if the glucose level fell below 80 mg/dl, a hypoglycemic alert was triggered, and, conversely, a hyperglycemic alert was elicited if glucose values were higher than 180 mg/dl. In the blinded study condition (CGM blind), no access to glucose values, glucose trends, or hypo- and hyperglycemic alerts were provided. The order of these 2 conditions was randomized.
Measurement of Glycemia
The Dexcom SEVEN PLUS CGM system was used for the continuous glucose measurement. The system and its measurement performance have been described in detail in a previous publication.9 The Dexcom SEVEN PLUS CGM system is designed to provide continuous measurement of glucose concentrations over a range of 40 to 400 mg/dl for up to 7 days and consists of 3 principal components: a sensor, a transmitter, and a receiver. The sensor is inserted into the subcutaneous tissue and measures a glucose signal in the interstitial fluid. The measured glucose signal is send wirelessly to a receiver at 5-minute intervals. The receiver has internally programmed algorithms which convert the sensor signals into a reading in mg/dl, based on capillary glucose values entered for calibration. The first calibration was done at the end of the 2-hour start-up period; update calibrations were performed every 12 hours thereafter (twice daily). The sensor was calibrated using the Glukometer 3000 (Bio Sensor Technology, Germany). This POC measurement system measures blood glucose enzymatic-amperiometrically and has a variation coefficient of < 5%. The measurement system is subjected to daily quality assurance measurement and is also used as the standard reference method in this study.12 A biochemical hypoglycemic episode was defined if the blood glucose was ≤70 mg/dl (≤3.9 mmol/l).
Setting
The study was carried out in an inpatient setting at the Diabetes Center Mergentheim, Bad Mergentheim, Germany. In spite of the inpatient setting, subjects with type 1 diabetes were provided free choice regarding the amount of carbohydrates they consumed; in addition, they engaged in physical exercise during leisure hours. A total of 6 routine blood glucose measurements were taken per day (fasting, after breakfast, before lunch, after lunch, before dinner, and before bedtime). In addition, subjects were requested to take a blood glucose measurement when they received an alert by the CGM system during the CGM open study phase to confirm low or high glucose excursions before they undertook treatment corrective actions.
Sample Recruitment
The following inclusion criteria for the study were applied:
Type 1 diabetes with a diabetes duration of more than 6 months
Age > 18 years
No current diagnosis of psychiatric disease
Patients who fulfilled inclusion criteria and gave informed consent were included. The study was approved by the local ethics committee.
Statistical Analysis
To assess CGM performance, the mean absolute relative difference (MARD) values from the reference POC glucose measurements were calculated. The CGM performance was also reported in accordance to the EN ISO-Norm 15197. The EN-ISO-Norm 15197 was established to evaluate POC devices. It requires that 95% of POC measurements deviate less than 20% from the reference method, if blood glucose is higher than 75 mg/dl or deviate less than 15 mg/dl from the reference method if blood glucose is lower than 75 mg/dl. In this study the percentage of comparisons between CGM and POC meeting this criterion is reported. In addition, Pearson correlation coefficients were calculated per patient. These correlation coefficients were aggregated to a mean correlation for the CGM real time and CGM blind conditions using Fisher’s Z score transformation and were tested for a significant difference. Glucose or blood glucose values in the hypoglycemic range were defined as values ≤70 mg/dl (3.9 mmol/l), values between 70 and ≤180 mg/dl (3.9 to 10.0 mmol/l) were regarded as euglycemic, and values >180 mg/dl (10.0 mmol/l) were defined as hyperglycemic.
A Bland–Altman analysis was done to show deviations of sensor glucose from the mean of sensor and reference glucose.13
The central dependent variables were assessed by the proportion of hypoglycemic blood glucose values as assessed by the Glukometer 3000 and the time difference between the last nonhypoglycemic blood glucose measurement and the hypoglycemic blood glucose measurement performed by the Glukometer 3000 during CGM real time and CGM blind. In addition, the durations of hypo-, eu-, and hyperglycemic phases measured by the CGM device in the interstitial fluid were analyzed. The duration of a hypoglycemic phase prior to a hypoglycemic POC measurement was subsequently analyzed to corroborate earlier detection of hypoglycemia by POC measurement. The mean was calculated for all these outcome variables per patient and study phase (CGM blind and CGM real time).
Data regarding CGM performance and use were tested regarding potential significant differences by paired t tests. The difference of correlations were tested for significance by using the z test. For percentages of comparisons within the EN ISO-Norm 15197, a paired t test was used.
“Within variance” analyses were used to analyze the impact of CGM on the duration of glycemic phases, the percentage of hypo-, eu-, or hyperglycemic POC measurements and the time until low blood glucose was detected by POC measurement. The “within repeated” factor was the treatment factor (CGM blind vs CGM real time). The order of the study phases was controlled by using the order of study phases as the “between” factor.
Results
Subjects
A total of 41 patients with type 1 diabetes participated in this study (see Table 1 for sample characteristics). Most participants were male. The A1c mean of 8.2% suggested suboptimal baseline control. The majority of the sample was on an intensive insulin therapy via multiple daily injections; only 4 patients (9.8%) used continuous subcutaneous insulin infusion (CSII) therapy. No patient was on a continuous therapy with Paracetamol during the study phases.
Table 1.
Sample Characteristics.
| Parameter | Percentage (n) or mean ± standard deviation |
|---|---|
| % female | 22 (9) |
| Mean age (years) | 42.0 ± 11.4 |
| Mean diabetes duration (years) | 15.3 ± 10.1 |
| Mean A1c (%) | 8.2 ± 1.4 |
| % with CSII treatment | 9.8 (4) |
Sensor Use and Performance
Results regarding the sensor use and sensor performance are summarized in Table 2. The mean duration of CGM use during CGM real time and CGM blind was comparable. Also the correlations between sensor glucose and reference method showed no substantial difference during CGM real time and CGM blind. The MARDs over all measurements were nearly identical. However, the MARDs in the different blood glucose ranges (hypo-, eu-, and hyperglycemic ranges) differed significantly (P < .001), whereas the MARD between CGM real time and CGM blind did not differ significantly in the different blood glucose ranges.
Table 2.
CGM Use and CGM Performance.
| CGM blind | CGM real time | P | |
|---|---|---|---|
| Mean duration of use in hours ± SD | 106 ± 16.9 | 108.2 ± 24.1 | .553 |
| Mean correlations between reference method and CGM | .112a | ||
| Pearson’s r | .91 | .89 | |
| Fisher’s Z | 1.53 ± 0.32 | 1.42 ± 0.30 | |
| MARD ± SD between reference methods and CGM | 16.8 ± 4.7 | 17.0 ± 4.5 | .792 |
| MARD ± SD between reference methods and CGM in different glycemic ranges | |||
| Hypoglycemia (≤70 mg/dl) | 25.7 ± 30.0 | 25.0 ± 20.7 | .732 |
| Euglycemia (>70-≤180 mg/dl) | 16.2 ± 16.8 | 16.4 ± 16.8 | .739 |
| Hyperglycemia (>180 mg/dl) | 14.1 ± 14.3 | 14.5 ± 13.3 | .785 |
| % within EN ISO Norm 15197 ± SD | 72.9 ± 12.0 | 69.0 ± 11.7 | .106 |
MARD, mean absolute relative difference.
Significance tests based on Fisher’s Z transformations.
CGM accuracy was significantly lower in the hypoglycemic range compared to the euglycemic or hyperglycemic range. Measurement pairs of sensor glucose and reference glucose, which were within the acceptance criteria of the EN ISO Norm 15197, were also comparable between CGM real time and CGM blind (see Table 2).
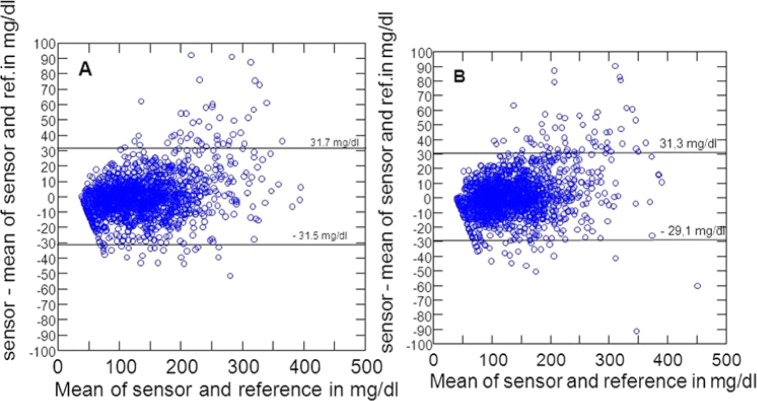
The Bland–Altman analysis is shown in Figure 1. The sensor difference from the mean of sensor and reference glucose was 0.1 ± 15.8 mg/dl during CGM blind and 1.3 ± 15.2 mg/dl during CGM real time. This means that 95% of measurement errors are approximately ± 30 mg/dl in both conditions.
Figure 1.
Bland–Altman plots. (A) CGM blind. (B) CGM real time.
In summary, sensor use and sensor performance, assessed by multiple criteria, were highly comparable during the study phases CGM real time and CGM blind.
Effects of CGM on Blood Glucose Values
On average, there were 39.1 ± 10.3 POC measurements of blood glucose per patient during the CGM real time phase and 36.7 ± 6.0 POC measurements during the CGM blind phase (P = .114). The mean blood glucose measured by the POC reference systems was 134.4 ± 18.1 mg/dl during the CGM real time phase and 137.3 ± 21.0 during the CGM blind phase (P = .360), indicating a comparable average blood glucose during the 2 study phases.
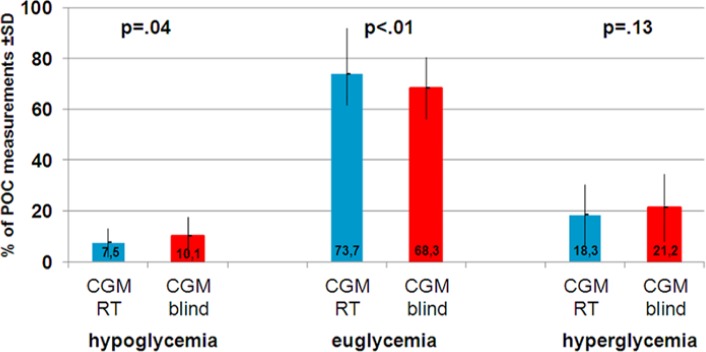
Figure 2 shows that the proportion of low blood glucose values and the proportion of euglycemic results differed significantly. The proportion of hypoglycemic blood glucose values assessed by the POC was significantly reduced from 10.1% during CGM blind to 7.5% during CGM real time (P = .04). During CGM real time the proportion of euglycemic POC readings significantly enhanced from 68.3% to 73.7% (P < .01). The proportion of hyperglycemic blood glucose measurements was reduced by CGM real time from 21.2% to 18.3%, but the reduction failed to reach statistical significance (P = .13).
Figure 2.

Proportion of hypo-, eu- and hyperglycemic POC measurement during CGM real time (CGM RT) and CGM blind.
Effects of CGM on Interstitial Glucose Concentrations
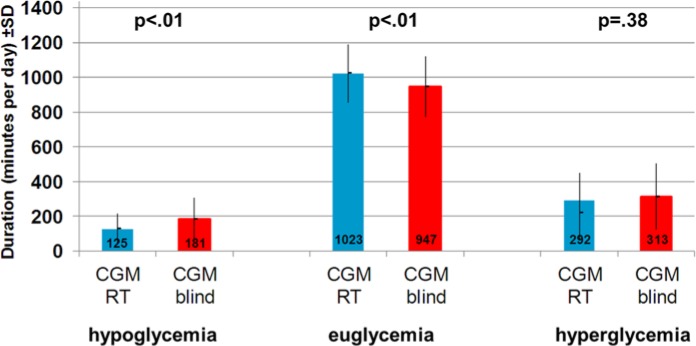
The results yielded by POC blood glucose measurements were mirrored by the CGM results. The duration of hypoglycemia could be significantly reduced by approximately 1 hour (56 minutes) per day during CGM real time (P < .01), whereas the duration of euglycemia could be significantly increased by approximately 75 minutes (P < .01). The reduction of the duration of hyperglycemia was insignificant (see Figure 3).
Figure 3.

Duration of hypo-, eu- and hyperglycemic glucose phases in the interstitial fluid during CGM real time (CGM RT) and CGM blind.
Effects of CGM on Hypoglycemia Detection by POC
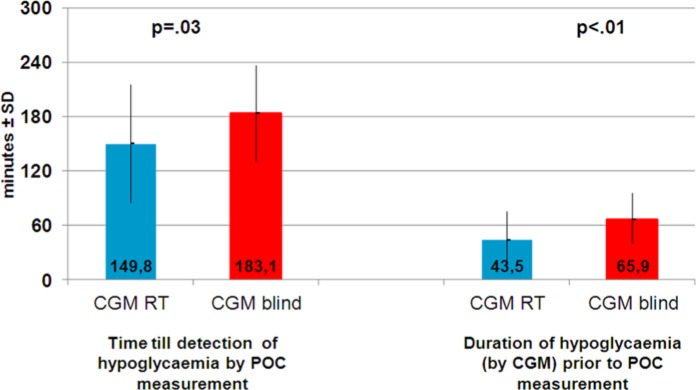
The time between the last eu- or hyperglycemic POC measurement and a hypoglycemic measurement was analyzed during the 2 study phases. In the CGM blind phase the last POC measurement prior to the hypoglycemic POC reading was 110.3 ± 22.2 mg/dl, and the mean value of hypoglycemic POC measurement was 60.0 ± 4.5 mg/dl. In the CGM real time phase the last POC measurement prior to the hypoglycemic POC reading was 120.3 ± 35.5 mg/dl and the mean hypoglycemic POC measurement was 58.9 ± 5.4 mg/dl. Controlled for order effects, the time difference between the last euglycemic POC measurement and the first hypoglycemic POC measurement was significantly shorter during CGM real time than during CGM blind (149.8 ± 65.4 minutes vs 183.1 ± 53.5 minutes; P = .028; see Figure 4).
Figure 4.

Time between last euglycemic and first hypoglycemic POC measurement (left side) and duration of CGM low glucose prior to hypoglycemia POC measurement (right side).
Subsequent Analyses
In the CGM system a hypoglycemic alert was set if glucose dropped below 80 mg/dl. In a subsequent analysis it was determined how many minutes before the hypoglycemic POC blood glucose measurement the CGM system recorded a glucose level lower than 80 mg/dl. If the POC measurement showed a glucose value of ≤70 mg/dl, the CGM system had a glucose measurement ≤80 mg/dl in the interstitial fluid 65.9 ± 29.7 minutes prior to hypoglycemic POC measurement during CGM blind, whereas during CGM real time the CGM system showed a glucose value of ≤80 mg/dl 43.5 ± 31.7 minutes prior to the hypoglycemic POC blood glucose measurement. The time until detection of hypoglycemia by POC was significantly shorter during CGM real time than CGM blind (P < .01; see Figure 4).
Conclusions
There is convincing evidence that the use of CGM is capable of reducing exposure to hypoglycemic glucose values measured in the interstitial fluid.1,3,14,15 However, these results mainly rely on the CGM glucose measurement itself. Of interest is also that recent trials,16,17 which can be considered as landmark studies, were able to demonstrate the beneficial effects of CGM only on CGM-measured glucose profiles but not with regard to POC measurements of hypoglycemia or severe hypoglycemic episodes.
Given that CGM measurement performance in the lower glucose range is lesser than in eu- or hyperglycemic ranges with earlier generation CGM devices, the confirmation of the efficacy of CGM for the avoidance of low blood glucose values by POC measurement adds evidence to the potential of CGM to avoid hypoglycemia. In addition to confirming known effects of CGM on the reduction of hypoglycemic episodes in the interstitial fluid, this study demonstrated that the beneficial effect of CGM was also evident with POC measurements in the capillary blood. The proportion of low blood glucose readings was reduced, whereas the proportion of euglycemic blood glucose measurements was enhanced during CGM real time.
Also the time difference between the last euglycemic blood glucose measurement and the detection of a hypoglycemic blood glucose value was shortened by approximately 30 minutes. This finding was corroborated by comparing CGM blind and CGM real-time glucose values before the hypoglycemic POC measurement. During CGM real time, the CGM glucose values fell below a threshold of 80 mg/dl 43 minutes prior to POC measurement, whereas CGM glucose values fell below 80 mg/dl already 66 minutes prior to the POC measurement when CGM was blinded. This suggests that CGM real time use is associated with an earlier detection of low blood glucose by POC by more than 20 minutes. However there is an interesting delay between the POC measurement and the hypoglycemic alert of 45 minutes. There is clearly further research warranted to explore the reason for this delay. Of special interest is the analysis to which extent this time delay might be due to a phenomenon called “alert fatigue.”
Since POC blood glucose measurement is currently recommended before undertaking any corrective blood glucose actions, the earlier detection also enables a faster treatment of mild hypoglycemia. Thus, real-time CGM use minimizes low blood glucose exposure and may reduce the risk of developing hypoglycemia unawareness.18
There are also some limitations of the study. The inpatient setting enabled reliable blood glucose measurement at a sufficient frequency to demonstrate the ability of CGM to avoid biochemical hypoglycemia, but it also limited the duration of the study. The study was performed with the Dexcom SEVEN PLUS System, which is succeeded by the Dexcom G4 system, which showed remarkable better precision regarding the measurement accuracy than its ancestor.19,20 A further limitation is that the POC system used had lower measurement precision than laboratory measurements.
In summary, this proof of principle study showed that biochemical hypoglycemia, measured by a blood glucose value based on a reference method, could be reliably avoided in a sample of type 1 diabetic patients using real-time CGM.
Footnotes
Abbreviations: A1c, glycated hemoglobin A1c; CGM, continuous glucose monitoring; POC, point of care.
Declaration of Conflicting Interests: The author(s) declared no potential conflicts of interest with respect to the research, authorship, and/or publication of this article.
Funding: The author(s) disclosed receipt of the following financial support for the research, authorship, and/or publication of this article: Dexcom provided CGM devices and a small grant to cover expenditures related to legal requirements (eg, patient insurance, ethical board).
References
- 1. Pickup JC, Freeman SC, Sutton AJ. Glycaemic control in type 1 diabetes during real time continuous glucose monitoring compared with self monitoring of blood glucose: meta-analysis of randomised controlled trials using individual patient data. BMJ. 2011;343:d3805. [DOI] [PMC free article] [PubMed] [Google Scholar]
- 2. Langendam M, Luijf YM, Hooft L, DeVries JH, Mudde AH, Scholten RJ. Continuous glucose monitoring systems for type 1 diabetes mellitus. Cochrane Database Syst Rev. 2012;1:CD008101. [DOI] [PMC free article] [PubMed] [Google Scholar]
- 3. Battelino T, Conget I, Olsen B, et al. The use and efficacy of continuous glucose monitoring in type 1 diabetes treated with insulin pump therapy: a randomised controlled trial. Diabetologia. 2012;55:3155-3162. [DOI] [PMC free article] [PubMed] [Google Scholar]
- 4. Tamborlane WV, Beck RW, Bode BW, et al. Continuous glucose monitoring and intensive treatment of type 1 diabetes. N Engl J Med. 2008;359:1464-1476. [DOI] [PubMed] [Google Scholar]
- 5. Garg SK, Kelly WC, Voelmle MK, et al. Continuous home monitoring of glucose: improved glycemic control with real-life use of continuous glucose sensors in adult subjects with type 1 diabetes. Diabetes Care. 2007;30:3023-3025. [DOI] [PubMed] [Google Scholar]
- 6. Block CD, Keenoy B, Gaal LV. A review of current evidence with continuous glucose monitoring in patients with diabetes. J Diabetes Sci Technol. 2008;2:718-727. [DOI] [PMC free article] [PubMed] [Google Scholar]
- 7. Mauras N, Fox L, Englert K, Beck RW. Continuous glucose monitoring in type 1 diabetes. Endocrine. 2013;43:41-50. [DOI] [PubMed] [Google Scholar]
- 8. Wentholt IM, Vollebregt MA, Hart AA, Hoekstra JB, DeVries JH. Comparison of a needle-type and a microdialysis continuous glucose monitor in type 1 diabetic patients. Diabetes Care. 2005;28:2871-2876. [DOI] [PubMed] [Google Scholar]
- 9. Garg SK, Smith J, Beatson C, Lopez-Baca B, Voelmle M, Gottlieb PA. Comparison of accuracy and safety of the SEVEN and the Navigator continuous glucose monitoring systems. Diabetes Technol Ther. 2009;11:65-72. [DOI] [PubMed] [Google Scholar]
- 10. Zijlstra E, Heise T, Nosek L, Heinemann L, Heckermann S. Continuous glucose monitoring: quality of hypoglycaemia detection. Diabetes Obes Metab. 2013;15:130-135. [DOI] [PubMed] [Google Scholar]
- 11. Freckmann G, Pleus S, Link M, Zschornack E, Klotzer HM, Haug C. Performance evaluation of three continuous glucose monitoring systems: comparison of six sensors per subject in parallel. J Diabetes Sci Technol. 2013;7:842-853. [DOI] [PMC free article] [PubMed] [Google Scholar]
- 12. ABT Diagnostics: Glukometer 3000. 2014. Available from http://www.abt-diagnostic.de/de/glukometer_techdata.html. Accessed January 14, 2014.
- 13. Bland M. An Introduction to Medical Statistics. Oxford, UK: Oxford University Press; 2000. [Google Scholar]
- 14. Garg S, Zisser H, Schwartz S, Bailey T, Kaplan R, Ellis S, Jovanovic L. Improvement in glycemic excursions with a transcutaneous, real-time continuous glucose sensor: a randomized controlled trial. Diabetes Care. 2006;29:44-50. [DOI] [PubMed] [Google Scholar]
- 15. Battelino T, Phillip M, Bratina N, Nimri R, Oskarsson P, Bolinder J. Effect of continuous glucose monitoring on hypoglycemia in type 1 diabetes. Diabetes Care. 2011;34:795-800. [DOI] [PMC free article] [PubMed] [Google Scholar]
- 16. Bergenstal RM, Klonoff DC, Garg SK, et al. Threshold-based insulin-pump interruption for reduction of hypoglycemia. N Engl J Med. 2013;369:224-232. [DOI] [PubMed] [Google Scholar]
- 17. Phillip M, Battelino T, Atlas E, et al. Nocturnal glucose control with an artificial pancreas at a diabetes camp. N Engl J Med. 2013;368:824-833. [DOI] [PubMed] [Google Scholar]
- 18. Cryer PE. Hypoglycemia: still the limiting factor in the glycemic management of diabetes. Endocr Pract. 2008;14:750-756. [DOI] [PubMed] [Google Scholar]
- 19. Freckmann G, Pleus S, Link M, Zschornack E, Klotzer HM, Haug C. Performance evaluation of three continuous glucose monitoring systems: comparison of six sensors per subject in parallel. J Diabetes Sci Technol. 2013;7:842-853. [DOI] [PMC free article] [PubMed] [Google Scholar]
- 20. Pleus S, Schmid C, Link M, et al. Performance evaluation of a continuous glucose monitoring system under conditions similar to daily life. J Diabetes Sci Technol 2013;7:833-841. [DOI] [PMC free article] [PubMed] [Google Scholar]


