

Abstract
Neonatal hypoglycemia is common and can cause serious brain injury. Continuous glucose monitoring (CGM) could improve hypoglycemia detection, while reducing blood glucose (BG) measurements. Calibration algorithms use BG measurements to convert sensor signals into CGM data. Thus, inaccuracies in calibration BG measurements directly affect CGM values and any metrics calculated from them. The aim was to quantify the effect of timing delays and calibration BG measurement errors on hypoglycemia metrics in newborn infants. Data from 155 babies were used. Two timing and 3 BG meter error models (Abbott Optium Xceed, Roche Accu-Chek Inform II, Nova Statstrip) were created using empirical data. Monte-Carlo methods were employed, and each simulation was run 1000 times. Each set of patient data in each simulation had randomly selected timing and/or measurement error added to BG measurements before CGM data were calibrated. The number of hypoglycemic events, duration of hypoglycemia, and hypoglycemic index were then calculated using the CGM data and compared to baseline values. Timing error alone had little effect on hypoglycemia metrics, but measurement error caused substantial variation. Abbott results underreported the number of hypoglycemic events by up to 8 and Roche overreported by up to 4 where the original number reported was 2. Nova results were closest to baseline. Similar trends were observed in the other hypoglycemia metrics. Errors in blood glucose concentration measurements used for calibration of CGM devices can have a clinically important impact on detection of hypoglycemia. If CGM devices are going to be used for assessing hypoglycemia it is important to understand of the impact of these errors on CGM data.
Keywords: continuous glucose monitor, neonatal, intensive care unit, hypoglycemia, recalibration, algorithm
Neonatal hypoglycemia is common and may often be undetected in new born infants.1 It has been associated with permanent brain injury, seizures, poor vision, and poor neurodevelopment in affected babies.2 However, the definition of neonatal hypoglycemia and the best course of treatment remain a contentious subject.1,3,4
Continuous glucose monitoring (CGM) devices, with their 1- to 5-minute measurement interval, have recently been used to identify hypoglycemia in a more effective, less invasive manner than blood glucose (BG) measurements alone.1,5-7 CGM devices typically consist of a small pager-like monitoring device that receives a signal from a sensor inserted into the subcutaneous layer, just beneath the skin. Calibration algorithms convert the signal into a meaningful glucose concentration by comparing it to known calibration BG measurements, which are entered into the monitor by the user.
In the busy critical or neonatal care environment it is possible for time delays to occur between measuring BG and entering the value into the CGM device for calibration. The magnitude of time delays can depend on a number of factors, including the meter/method used to measure BG and the location of the BG meter relative to the patient.8-10 Calibration algorithms cannot currently detect or correct for these time delays. Consequently, any delay could potentially introduce significant error in the output CGM trace, especially when the BG level is rapidly changing.11,12
Another source of error that could impact CGM data is calibration BG measurement error. Typical point-of-care glucometers have measurement error in the range of 2-10%.13-16 However, these devices are often designed for otherwise healthy people with diabetes and they can exhibit reduced performance in critically ill or neonatal care patients, particularly due to medications or fluctuating hematocrit levels17-19 and at low glucose concentrations. In contrast, blood gas analyzers (BGAs) can measure BG concentrations with less than 2% error for a wide range of patient states, with little influence from hematocrit, pH, or PaO2, which are often actively measured and accounted for.20 Hence, the choice of calibration measurement method could have a significant impact on CGM accuracy, independent of calibration timing.
These errors can add uncertainty to the CGM trace and to any glycemic metrics calculated from it. Therefore, studies utilizing CGM devices to detect and quantify hypoglycemia, or other glycemic events, should be aware of these potential sources of error and the potential impact on results. In particular, the resulting uncertainty or variability would limit the detectable resolution of any true clinical changes and should be accounted for in the study design. This study quantifies the effect of timing delays and calibration BG measurement errors, both together and separately, on metrics used to classify hypoglycemia in newborn infants.
Subjects and Methods
Patients
This post hoc analysis uses CGM and BG data from 155 newborn infants admitted to Waikato Hospital Neonatal Intensive Care Unit (NICU) between December 2008 and November 2010. Babies greater than 35 weeks gestation, less than 48 hours old, and at risk of neonatal hypoglycemia were eligible for the study. Primary risk factors for neonatal hypoglycemia included having a mother with diabetes, prematurity, and/or being small or large for gestational age. All patients had a SOF sensor inserted shortly after birth, and data were recorded using a CGMS System Gold device (Medtronic Minimed, Northridge, CA, USA). Patients with less than 24 hours of CGM data were excluded, and CGM data after 72 hours were trimmed. The median [interquartile range; IQR] duration of CGM recordings were 1.8 [1.5, 2.0] days with 5.9 [5.1, 6.9] calibrations per day. These data were used to create 1 of 2 timing error models and for the main analysis presented here. This study and use of data were approved by the Northern Y Ethics Committee, New Zealand.
Timing Error Models
Timing error models are used to assess the impact of delays entering BG measurements into the CGM for calibration. Two models were created for this study, 1 using data from the Waikato Hospital NICU study and 1 using data from an ongoing CGM study in the Christchurch Hospital ICU. The Christchurch Hospital ICU study and use of data were approved by the Upper South A Regional Ethics Committee, New Zealand.
Both centers used BGAs for calibration BGs (Waikato: Radiometer ABL800Flex, Copenhagen; Christchurch: Radiometer ABL90Flex, Copenhagen). The BGA recorded the time and glucose concentration electronically, but nurses had to manually enter the BG value into the CGM, which stored this time/value. The distribution of time discrepancies between measuring BG and calibrating the CGM were used to create the model. Any time delays between obtaining the blood sample and determining the glucose concentration were considered negligible due to the close proximity of the BGA to the patients. Figure 1 shows the raw data and empirically derived models of timing error used in this study.
Figure 1.
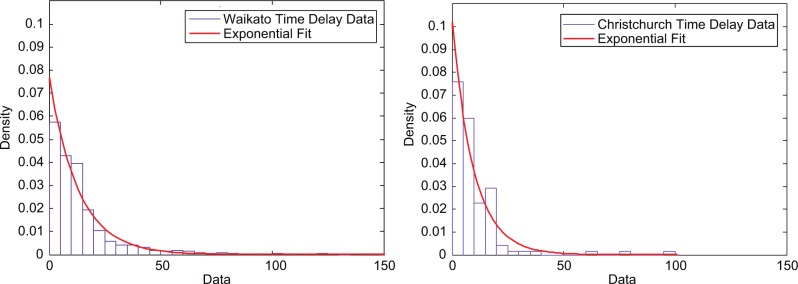
Distribution of time delay data from both Waikato (left) and Christchurch (right) data sets. Waikato Hospital data had 1947 time delay values and an exponential decay model (µ = 12.96) fit the empirical data. Christchurch Hospital had 155 delay values and an exponential decay model (µ = 8.84) captured the empirical data.
Measurement Error Models
Measurement error models describe calibration BG measurement errors, commonly parameterized by accuracy and precision. A wide range of error levels for different devices can be found in the literature,21-25 but this study focused on 3 glucose meters: Abbott Optimum Xceed (Abbott Diabetes Care, Alameda, CA, USA), Nova Statstrip (Nova Biomedical, Waltham, MA, USA), and Roche Accu-Chek Inform II (F. Hoffmann-La Roche Ltd, Basel, Switzerland).
All 3 models were developed using data from the Christchurch ICU study. Under this protocol, BG is determined using a BGA and the remaining blood is distributed across up to 15 separate BG meters (up to 5 of each model). Not every model of glucometer was available for each patient in the study, resulting in different numbers of paired meter-BGA values for each glucometer. All measurements were made by trained staff, minimizing user associated error.10 All devices used in this study measure glucose concentration in whole BG and display a plasma equivalent glucose concentration as recommended by the International Federation of Clinical Chemistry and Laboratory Medicine (IFCC). Furthermore, BGAs in the same family as the one used in this study have also been shown to correlate well with laboratory plasma glucose determinations,26 allowing direct comparison between all devices.
For each glucometer measurement, the error between the glucometer and BGA value was calculated as (meter – BGA). Errors were stratified into bins, based on the BGA gold standard measurement. Mean and standard deviation of each bin were then used to describe the error distribution, and assumed Gaussian around any bias. Positive bias assumes the glucose meter is reading higher than the recorded BGA value and vice versa.
The Abbott Optium Xceed is an inexpensive and commonly available device that measures the glucose concentration of a whole blood sample, and estimates the plasma equivalent glucose concentration using a constant adjustment factor of 1.12.13 This factor is derived from the difference between plasma glucose and whole BG concentration for an individual with a normal hematocrit level. The Abbott test strips are validated for a hematocrit range of 20-70.13 The top section of Table 1 shows the error model derived from the experimental Abbott and BGA data. There were a total of 724 paired meter-BGA measurements available for the model.
Table 1.
Measurement Error Data for the Abbott Optium Xceed, Nova Statstrip, and Roche Accu-Chek Inform II Glucose Meters.
| Abbott error model | |||||
|---|---|---|---|---|---|
| Reference BG (mmol/l) | <5.9 | 6.0-6.9 | 7.0-7.9 | 8.0-8.9 | >9.0 |
| Number of measurements | 141 | 277 | 224 | 42 | 40 |
| Error mean (mmol/L) | 0.5099 | 0.5433 | 0.2299 | 0.1952 | 0.635 |
| Error SD (mmol/L) | 0.4982 | 0.7519 | 0.5521 | 0.8748 | 0.3965 |
| Nova error model | |||||
| Reference BG (mmol/l) | <6.9 | 7.0-7.9 | >8.0 | ||
| Number of measurements | 67 | 74 | 123 | ||
| Error mean (mmol/L) | −0.0134 | −0.0823 | −0.1905 | ||
| Error SD (mmol/L) | 0.2564 | 0.2471 | 0.3463 | ||
| Roche error model | |||||
| Reference BG (mmol/l) | <6.9 | 7.0-7.9 | >8.0 | ||
| Number of measurements | 174 | 160 | 10 | ||
| Error mean (mmol/L) | −0.181 | −0.4212 | −0.27 | ||
| Error SD (mmol/L) | 0.2615 | 0.2645 | 0.0949 | ||
The Nova and Roche models have a reduced number of bins to avoid skewing due to low measurement numbers.
The Nova Statstrip GLU was designed for point-of-care testing in the hospital environment and adjusts for hematocrit level when calculating plasma glucose concentration. The Nova test strips used in this study were validated for a hematocrit range of 20-65%.27 The middle section of Table 1 shows the error model derived from the 229 paired meter-BGA measurements.
The Roche Accu-Chek Inform II was also designed for point-of-care testing and monitoring in hospitals. This device also adjusts for hematocrit level and test strips were validated for a hematocrit range of 10-65%.15 The bottom section of Table 1 shows the error model derived from 344 paired meter-BGA measurements.
All 3 measurement error models were validated against the error characteristics described by the manufacturers.13,16,21 The Roche and Nova measurement error models compared well to the manufacturers’ data. The Abbott measurement error model has increased bias and variation compared to the manufacturer’s data. Finally, the models described here are comparable to what has been reported in the literature for these devices.17,28
Analysis
This analysis used CGM and BG data from 155 babies admitted to the Waikato NICU study. Timing and measurement errors from the models described in Sections 2.2/2.3 were added to calibration BG measurements, before CGM data were recalibrated using a published calibration algorithm.12 Hypoglycemia of each infant was quantified by
Number: Number of independent hypoglycemic events
Duration: Percentage of CGM recordings below 2.6 mmol/L
Hypoglycemic index: Total area between the 2.6 mmol/L threshold and the CGM trace (when CGM < 2.6 mmol/L), divided by the total monitoring duration
Monte Carlo (MC) methods were employed to reduce the impact of randomly sampled outliers on results. A 1000-run MC simulation was completed for each individual model (2 timing and 3 measurement error models) resulting in 5 simulations. Simulations were also run for all possible combinations of timing/measurement error models (a further 6 simulations). The simulation protocol can be summarized as follows:
For every MC run on a given infant CGM trace, the difference between the number of hypoglycemic events in the CGM data for that MC run and the number of hypoglycemic events in the baseline (no added error) clinical data was determined as [Number(MC run) – Number(baseline)]
The median difference across 1000 MC runs for each patient was recorded
The Median [IQR] (90% confidence interval) of the values calculated in step 2 for all patients were included in the results table
Steps 1-3 were repeated for hypoglycemia percentage duration and hypoglycemic index.
Results
Timing Error Only
Timing error tends to have little effect on the number of hypoglycemic events, shown in Table 2. Both timing error models have a median difference from the original metrics of 0 and the 90% CI variation is only ±2 events. Percentage duration and hypoglycemic index are increased by timing error for both models. The Waikato model had a positive median difference of 0.21 (duration) and 0.27 (index) and the Christchurch model had a positive median difference of 0.17 (duration) and 0.18 (index). The Waikato timing error model shows a larger increase in duration and index, and greater variation, resulting in it overreporting more frequently than the Christchurch model.
Table 2.
Overall Cohort Results From Each 1000-run MC Simulation Showing the Median [IQR] (90% CI) Difference in Hypoglycemia Metrics From Baseline.
| Baseline hypoglycemia | ||||
|---|---|---|---|---|
| Number of hypoglycemic events | 2 [1, 5] (0, 13) | |||
| Percentage duration | 6.13 [1, 13] (0, 29) | |||
| Hypoglycemic index | 10.13 [1.3, 27] (0, 87) | |||
| Results from error Monte Carlo simulations using error models | ||||
| Number of Hypoglycemic events | No measurement error | Abbott measurement error | Nova measurement error | Roche measurement error |
| No timing error | −1 [−3, 0] (−8, 0) | 0 [0, 1] (−3, 2) | 0 [0, 2] (−3, 4) | |
| Waikato timing error | 0 [0, 1] (−2, 2) | −1 [−2, 0] (−8, 0) | 0 [0, 1] (−3, 2) | 1 [0, 2] (−3, 4) |
| Christchurch timing error | 0 [0, 0] (−2, 2) | −1 [−2, 0] (−8, 0) | 0 [0, 1] (−3, 2) | 1 [0, 2] (−3, 4) |
| Percentage Duration | ||||
| No timing error | −4.68 [−9.0, −1.0] (−17, 0) | 0.49 [0.1, 1.6] (−0.1, 6.7) | 4.45 [1.8, 10] (0, 23) | |
| Waikato timing error | 0.21 [0, 1.3] (−1.7, 4.1) | −4.25 [−9.0, −1.0] (−15, 0) | 1.02 [0.1, 3.2] (−0.5, 8.7) | 5.36 [2.1, 11] (0, 26) |
| Christchurch timing error | 0.17 [0, 0.9] (−1.5, 3.6) | −4.40 [−8.5, −0.6] (−15, 0) | 0.84 [0, 2.7] (−0.4, 8.1) | 5.23 [2.2, 11] (0, 25) |
| Hyperglycemic Index | ||||
| No timing error | −7.64 [−22, 0] (−59, 0) | 2.93 [0.5, 8.2] (0, 16) | 19.4 [4.2, 38] (0, 70) | |
| Waikato timing error | 0.27 [0, 3.1] (−3.3, 14) | −6.84 [−22, −0.3] (−48, 0) | 3.84 [0.7, 12] (−0.1, 27) | 20.8 [4.1, 42] (0, 82) |
| Christchurch timing error | 0.18 [0, 2.3] (−2.9, 11) | −7.24 [−21, −0.4] (−50, 0) | 3.77 [0.60, 11] (0, 23) | 21.3 [4.7, 42] (0, 80) |
Glucometer Error
The Abbott Optium Xceed results have a negative median difference across all metrics and the variation is skewed to the left, shown in Table 2. Hence, the Abbott results tended to underreport all hypoglycemic metrics. The number of hypoglycemic events recorded had a median difference of −1 [IQR: −3, 0]. The Nova Statstrip tended to overreport percentage duration and hypoglycemic index, with median and IQRs of 0.49 [0.1, 1.6] and 2.93 [0.5, 8.2], respectively. The Roche Accu-Chek Inform II tended to overreport hypoglycemia the most and also had the largest variation, with median differences of 4.45 [1.8, 10] for duration and 19.4 [4.2, 38] for index. When compared to the Abbott and Roche results, the Nova results are closest to the baseline hypoglycemic metrics.
The tendency to under- or overreport hypoglycemia metrics can be seen in Figure 2, which shows a single patient data set simulated with each measurement error model. The original recalibrated trace (dark blue line) shows a significant hypoglycemic event between 430 and 570 minutes. With the Abbott error model (A in Figure 2) this hypoglycemic event only appears in approximately 50% of the 1000 MC runs. In the Nova (B in Figure 2) and the Roche (C in Figure 2) simulations this hypoglycemic event is detected for 100% of the MC runs. As a consequence of the negative bias, especially in the Roche model, this event tends to drop below the 2.6 mmol/L threshold earlier and rise later than the baseline trace, resulting in a concomitant increase in duration and index.
Figure 2.

Example continuous glucose monitoring (CGM) traces showing the effect of (A) Abbott measurement error, (B) Nova measurement error, and (C) Roche measurement error. The colored band in each plot shows the 5th-95th percentile variation in the CGM trace over 1000 MC simulations.
Figure 3 shows the baseline (no error) duration of hypoglycemia (x-axis) plotted against the duration of hypoglycemia for each MC run (y-axis), for a 1000 MC run simulation. Essentially, the spread in the y direction shows the amount of variation in the hypoglycemia metric for the 1000 MC runs. The left plot shows results when using the Abbott model, with a clear tendency to underreport the duration of hypoglycemia. The right plot is for the Roche model, showing that the duration metric has been overestimated, with the majority of results above the MC = baseline 45° line.
Figure 3.

Duration of hypoglycemia in each of 1000 MC runs plotted against baseline duration of hypoglycemia, for all 155 CGM data sets. (A) Simulation results using Abbott measurement error. (B) Simulation results using Roche measurement error.
Combined Measurement and Timing Error
The combination of measurement and timing error leads to an increase in both the median difference and variation of these across all metrics. However, the results are not additive, and the contribution from timing error is dominated by measurement error, as shown in Table 2.
Discussion
Timing Error Versus Measurement Error
The observed timing errors noted in the clinical practice have little impact on CGM hypoglycemic metrics. Measurement error alone has a much larger effect on the hypoglycemic metrics than timing error alone. The best performing measurement model, the Nova, increases the median duration of hypoglycemia by more than double that of the Waikato timing error model. The median hypoglycemic index of the Nova measurement error model is 10 times that of the Waikato timing error model. The variation seen in these metrics is also greater for the Nova. In addition, when the effects of measurement and timing error are combined, there is little change to the results compared to measurement error alone. Thus these results clearly illustrate the dominance of measurement error over timing error in the overall cohort.
Clinically, when real-time CGM devices are used to help detect neonatal hypoglycemia, the effects of these errors can be reduced by assessing the state of the CGM trace at the time of calibration. It is widely recommended that CGM devices be calibrated during periods of stable glycemia to avoid substantial errors in CGM data that may result from timing errors. In these cases, time and care can be taken to ensure the most accurate measurement of BG levels is obtained, employing a BGA (if available) instead of a point-of-care glucometer.
If the CGM must be calibrated during a time of rapidly changing glucose, the user should be aware that the discrepancy between the calibration BG measurement and the true BG level increases with delay in entering the calibration measurement. This is potentially a problem in newborn babies whose glucose levels can fluctuate significantly during the first few hours of life. In these specific cases, it is highly recommended that the calibration measurement is obtained and entered into the CGM without delay, suggested within 5 minutes. In the context of hypoglycemia, any error in the “calibration factor” due to time delay can have an effect on the level of measured hypoglycemia hours after the calibration has occurred. However, if BG levels are low and trending downward at the time of calibration it may be more advisable to obtain a very accuracy BGA measurement as a measure of safety.
The Impact of Bias
The tendency of Abbott to underreport the hypoglycemic metrics, while Nova and Roche overreport, is related to the direction and magnitude of their measurement bias. The negative biases of the Nova and Roche models cause the trace to be pulled down more frequently during calibration. Hence, the number of hypoglycemic events tends to increase, as do the time and area below the threshold. In contrast, the positive bias in the Abbott meters causes the trace to be pulled up during calibration causing hypoglycemia to be underreported.
It is likely that the Abbott meter, not being designed specifically for the ICU environment, is more sensitive to clinical factors including varying hematocrit and medications such as acetaminophen, ascorbic acid and dopamine.29 The cohort data used to create the models came from patients with median [IQR] (90%CI) hematocrit levels of 27.7% [25, 31] (24, 36), and while they all remained within the validated range for the test strip, the median is significantly lower than the normal hematocrit level of 40-45%. The combination of low hematocrit levels and a constant correction factor of 1.12 is likely to have contributed to the positive bias seen in the Abbott model. Using a whole blood to plasma conversion equation30 and a hematocrit value of 27%, the “true” conversion factor is calculated to be 1.07, which is 5% lower than the constant Abbott value. In addition, newborn babies can have hematocrit levels as high as 65%31 causing the Abbott meter to underreport the true plasma glucose by ~6%.
The clinical impact of these findings could be significant for future studies using CGM devices to classify hypoglycemia in neonates. However, it is not yet possible to quantify what percentage of under-/overreporting of hypoglycemia is clinically significant, as the long-term effects of hypoglycemia on infants are still being investigated. Glucometer device characteristics such as bias and clinical factors such as hematocrit could have a substantial impact on the results of a study of glycemia. For example, if 2 separate studies were investigating hypoglycemia using CGM devices, the study outcomes could differ simply due to the type of glucose meter used to calibrate the CGM. Systematic reviews and meta-analyses need to be considered when studies using different glucometers are compared. Thus, it is important to select an appropriate method of measuring glucose for calibration when undertaking CGM studies, and to understand the range of impact or uncertainty that the device may impart to the results.
Variation in Hypoglycemia Metrics
The IQR and 90%CI in the results table are used to assess the variation in the hypoglycemia metrics across the 1000 MC runs. The results showed a counterintuitive trend: the Roche results had a wider 90%CI (more variation in results), for duration and index, than the results from the lower precision Abbott meter. The negative bias of the Roche was deemed to be the cause of this unexpected result as the increased amount of hypoglycemia allows more variation to be observed.
In Figure 3 it is evident that truncation in the variation of hypoglycemia metrics occurs when calibration causes the CGM to be lifted above the hypoglycemic threshold. Plot A in Figure 3 illustrates how the negative bias in the Roche model increases the area and time below the 2.6 mmol/L threshold, allowing more variation to be seen in the hypoglycemia metrics. Conversely, plot B in Figure 3 shows that the full effect of the Abbott precision is only experienced by patients with large baseline durations of hypoglycemia. The positive bias of the Abbot error causes the majority of points to fall below the 45° line and the variation observed in duration is truncated at zero, causing the tighter 90%CI seen in results. Finally, the widths of the bands in Figure 2 reinforce this point and show the true effect of precision on the overall CGM trace.
Limitations
The main limitation of this study is the method used to calibrate the CGM after adding timing and measurement error to calibration BGs. The proven calibration algorithm from Signal et al12 was designed to be used with very accurate calibration BG measurements, with little or no timing error. Thus, it inherently assumes the calibration BGs are perfect and forces the CGM trace to pass through them. Inbuilt CGM calibration algorithms typically use regression techniques32 to reduce the impact of individual erroneous measurements on the output CGM trace. However, the details of these algorithms are not typically fully disclosed, and therefore it was not possible to use one directly in this study. Although the effect of glucometer calibration errors on hypoglycemic metrics might be reduced with the use of an inbuilt calibration algorithm, it is likely that the trends discussed in this study will still remain as such algorithms would only moderate the impact of calibration error and not eliminate it.
A second limitation is that the CGM devices used in this study are not the latest CGM technology available on the market. This is a post hoc analysis of data that were collected between 2008 and 2010, using devices purchased for first use in 2006 as part of another research study. At the time of purchase, the CGMS Gold was the most widely reported CGM device used for research. While the exact numerical results may differ with newer devices or different technologies, it is likely that the trends in results and overall conclusions reported in this study would still be observed.
Finally, the assessment of hypoglycemia in CGM data does not account explicitly account for potential inaccuracies in the CGM data itself. The recalibration algorithm exploits the very accurate and frequent calibration BG measurements to minimize CGM error, but it is likely that the recalibrated CGM data still contain some degree of error. This remaining error could potentially affect the exact numerical results when quantifying hypoglycemia, but again, it is likely the key trends and observations discussed in this study would still remain.
Conclusions
This study aimed to quantify the effect of calibration delays and glucometer measurement error on the hypoglycemic metrics detected using CGM devices in infants at risk of hypoglycemia soon after birth. Overall, measurement error tends to have a much larger impact on hypoglycemia metrics than timing error. The effect of bias in calibration BG measurements was 2-fold: (1) a negative error bias increases the prevalence of hypoglycemia and (2) it also increases the amount of variation seen in hypoglycemic metrics. The opposite was also true for positive biases. Finally, if CGM devices are to be used clinically for assessing events such as hypoglycemia, it is important that the investigators are aware of the potential impact that errors in calibration BG measurements can have on event detection.
Acknowledgments
The authors would like to acknowledge members of the CHYLD Study Group for collecting and compiling data for this study, and the CHYLD Study Steering Group for oversight and approval of the article.
Footnotes
Abbreviations: BG, blood glucose; BGAs, blood gas analyzers; CGM, continuous glucose monitoring; CI, confidence interval; ICU, intensive care unit; IQR, interquartile range; MC, Monte Carlo; NICU, neonatal intensive care unit.
Declaration of Conflicting Interests: The author(s) declared no potential conflicts of interest with respect to the research, authorship, and/or publication of this article.
Funding: The author(s) disclosed receipt of the following financial support for the research, authorship, and/or publication of this article: UC Department of Mechanical Engineering, New Zealand, Health Research Council of New Zealand. The project described was supported in part by grant RO1HD069622 from the Eunice Kennedy Shriver National Institute of Child Health & Human Development. The content is solely the responsibility of the authors and does not necessarily represent the official views of the Eunice Kennedy Shriver National Institute of Child Health & Human Development or the National Institutes of Health.
References
- 1. Harris DL, et al. Continuous glucose monitoring in newborn babies at risk of hypoglycemia. J Pediatr. 2010;157(2):198-202. [DOI] [PubMed] [Google Scholar]
- 2. Stanley CA, Baker L. The causes of neonatal hypoglycemia. New Engl J Med. 1999;340(15):1200-1201. [DOI] [PubMed] [Google Scholar]
- 3. Cornblath M, et al. Controversies regarding definition of neonatal hypoglycemia: suggested operational thresholds. Pediatrics. 2000;105(5):1141-1145. [DOI] [PubMed] [Google Scholar]
- 4. Koh THHG, Eyre JA, Aynsleygreen A. Neonatal hypoglycemia—the controversy regarding definition. Arch Dis Child. 1988;63(11):1386-1388. [DOI] [PMC free article] [PubMed] [Google Scholar]
- 5. Beardsall K, et al. The continuous glucose monitoring sensor in neonatal intensive care. Arch Dis Child Fetal Neonatal Ed. 2005;90(4):F307-F310. [DOI] [PMC free article] [PubMed] [Google Scholar]
- 6. Signal M, et al. Continuous glucose monitors and the burden of tight glycemic control in critical care: can they cure the time cost? J Diabetes Sci Technol. 2010;4(3):625-635. [DOI] [PMC free article] [PubMed] [Google Scholar]
- 7. Pretty CG, et al. Hypoglycemia detection in critical care using continuous glucose monitors: an in silico proof of concept analysis. J Diabetes Sci Technol. 2010;4(1):15-24. [DOI] [PMC free article] [PubMed] [Google Scholar]
- 8. Aragon D. Evaluation of nursing work effort and perceptions about blood glucose testing in tight glycemic control. Am J Crit Care. 2006;15(4):370-377. [PubMed] [Google Scholar]
- 9. Carayon P, Gurses AP. A human factors engineering conceptual framework of nursing workload and patient safety in intensive care units. Intensive Crit Care Nurs. 2005;21(5):284-301. [DOI] [PubMed] [Google Scholar]
- 10. Ginsberg BH. Factors affecting blood glucose monitoring: sources of errors in measurement. J Diabetes Sci Technol. 2009;3(4):903-913. [DOI] [PMC free article] [PubMed] [Google Scholar]
- 11. Castle JR, Ward WK. Amperometric glucose sensors: sources of error and potential benefit of redundancy. J Diabetes Sci Technol. 2010;4(1):221-225. [DOI] [PMC free article] [PubMed] [Google Scholar]
- 12. Signal M, et al. Impact of retrospective calibration algorithms on hypoglycemia detection in newborn infants using continuous glucose monitoring. Diabetes Technol Ther. 2012;14(10):883-890. [DOI] [PMC free article] [PubMed] [Google Scholar]
- 13. Abbott. Abbott Optium Test-Strip Packet Insert. Alameda, CA: Abbott Diabetes Care; 2010. [Google Scholar]
- 14. Arkray. Glucocard Test Strip II Data Sheet. Japan: Arkray Inc; 2007. [Google Scholar]
- 15. Roche. ACCU-CHEK Comfort Curve Test-strip Packet Insert. Basel, Switzerland: Roche Diagnostics; 2007. [Google Scholar]
- 16. Solnica B, Naskalski JW, Sieradzki J. Analytical performance of glucometers used for routine glucose self-monitoring of diabetic patients. Clin Chim Acta. 2003;331(1-2):29-35. [DOI] [PubMed] [Google Scholar]
- 17. Kanji S, et al. Reliability of point-of-care testing for glucose measurement in critically ill adults. Crit Care Med. 2005;33(12):2778-2785. [DOI] [PubMed] [Google Scholar]
- 18. Karon BS, et al. Accuracy of Roche Accu-Chek inform whole blood capillary, arterial, and venous glucose values in patients receiving intensive intravenous insulin therapy after cardiac surgery. Am J Clin Pathol. 2007;127(6):919-926. [DOI] [PubMed] [Google Scholar]
- 19. Hoedemaekers CW, et al. Accuracy of bedside glucose measurement from three glucometers in critically ill patients. Crit Care Med. 2008;36(11):3062-3066. [DOI] [PubMed] [Google Scholar]
- 20. Watkinson PJ, et al. The effects of precision, haematocrit, pH and oxygen tension on point-of-care glucose measurement in critically ill patients: a prospective study. Ann Clin Biochem. 2012;49(pt 2):144-151. [DOI] [PubMed] [Google Scholar]
- 21. Critchell CD, et al. Accuracy of bedside capillary blood glucose measurements in critically ill patients. Intensive Care Med. 2007;33(12):2079-2084. [DOI] [PubMed] [Google Scholar]
- 22. Nuntnarumit P, et al. Clinical performance of the new glucometer in the nursery and neonatal intensive care unit. Pediatr Int. 2011;53(2):218-223. [DOI] [PubMed] [Google Scholar]
- 23. Ho HT, Yeung KW, Young BW. Evaluation of “point of care” devices in the measurement of low blood glucose in neonatal practice. Arch Dis Child Fetal Neonatal Ed. 2004;89(4):F356-F359. [DOI] [PMC free article] [PubMed] [Google Scholar]
- 24. Poirier JY, et al. Clinical and statistical evaluation of self-monitoring blood glucose meters. Diabetes Care. 1998;21(11):1919-1924. [DOI] [PubMed] [Google Scholar]
- 25. Rao LV, et al. Accuracy evaluation of a new glucometer with automated hematocrit measurement and correction. Clin Chim Acta. 2005;356(1-2):178-183. [DOI] [PubMed] [Google Scholar]
- 26. Scott RJ, et al. Evaluation of multiple whole blood glucose methods compared with a laboratory plasma hexokinase reference assay. Point Care. 2008;7(2):43-46. [Google Scholar]
- 27. Nova. Nova Stat Strip Glucose Test Strip Packet Insert. Waltham, MA: Nova Biomedical; 2011. [Google Scholar]
- 28. Makaya T, Memmott A, Bustani P. Point-of-care glucose monitoring on the neonatal unit. J Paediatr Child Health. 2012;48(4):342-346. [DOI] [PubMed] [Google Scholar]
- 29. Docherty PD, Chase JG, David T. Characterisation of the iterative integral parameter identification method. Med Biol Eng Comput. 2012;50(2):127-134. [DOI] [PubMed] [Google Scholar]
- 30. Mahoney JJ, Ellison JM. Assessing glucose monitor performance—a standardized approach. Diabetes Technol Ther. 2007;9(6):545-552. [DOI] [PubMed] [Google Scholar]
- 31. Jopling J, et al. Reference ranges for hematocrit and blood hemoglobin concentration during the neonatal period: data from a multihospital health care system. Pediatrics. 2009;123(2):e333-e337. [DOI] [PubMed] [Google Scholar]
- 32. Bequette BW. Continuous glucose monitoring: real-time algorithms for calibration, filtering, and alarms. J Diabetes Sci Technol. 2010;4(2):404-418. [DOI] [PMC free article] [PubMed] [Google Scholar]