

Abstract
Continuous glucose monitors (CGMs) provide real-time interstitial glucose concentrations that are essential for automated treatment of individuals with type 1 diabetes. Miscalibration, noise spikes, dropouts, or pressure applied to the site (e.g., lying on the site while sleeping) can cause inaccurate glucose signals, which could lead to inappropriate insulin dosing decisions. These studies focus on the problem of pressure-induced sensor attenuations (PISAs) that occur overnight and can cause undesirable pump shut-offs in a predictive low glucose suspend system. The algorithm presented here uses real-time CGM readings without knowledge of meals, insulin doses, activity, sensor recalibrations, or fingerstick measurements. The real-time PISA detection technique was tested on outpatient “in-home” data from a predictive low-glucose suspend trial with over 1125 nights of data. A total of 178 sets were created by using different parameters for the PISA detection algorithm to illustrate its range of available performance. The tracings were reviewed via a web-based analysis tool by an engineer with an extensive expertise on analyzing clinical datasets and ~3% of the CGM readings were marked as PISA events which were used as the gold standard. It is shown that 88.34% of the PISAs were successfully detected by the algorithm, and the percentage of false detections could be reduced to 1.70% by altering the algorithm parameters. Use of the proposed PISA detection method can result in a significant decrease in undesirable pump suspensions overnight, and may lead to lower overnight mean glucose levels while still achieving a low risk of hypoglycemia.
Keywords: algorithms, artificial pancreas, continuous glucose monitor, fault detection, hypoglycemia, sensor attenuations
Continuous glucose monitors (CGMs) provide real-time information about interstitial glucose values that can be used to alert the patient or for automating glucose control.1,2 While the technology has evolved over the past decade, problems remain for effective management of diabetes. Outstanding progress in the development of glucose biosensors has not yet fulfilled the promise of tight diabetes management, and there are many challenges and obstacles facing highly stable and reliable continuous glycemic monitoring.3-5 Sometimes the sensors are miscalibrated, lose their calibration, or suffer from sensor signal dropouts and degradation due to fouling. Another common problem, particularly overnight when a subject sleeps on their sensor, is sensor attenuation, which we will refer to as pressure-induced sensor attenuation (PISA). The physical and biochemical basis of pressure- and movement-based sensor attenuations are presented by Helton et al.6,7 A computer-implemented method has been proposed by Breton et al8 for determining the probability of signal attenuation by receiving analyte sensor related signals and estimating sensor characteristics. Mensh et al9 studied the performance of CGMs as a function of sleeping position and used four sensors, two at each side of the abdomen. They observed sudden decreases in CGM readings where there was a significant pressure applied to the skin around the sensor due to the sleep position.
Sensors are an important part of any form of a closed-loop algorithm. For example, predictive pump shut-off (or predictive low glucose suspend) algorithms rely on an estimate of the rate of change of sensor glucose to shut-off an insulin pump to avoid hypoglycemia. Inpatient clinical studies have shown a 73% rate in avoiding hypoglycemia using a predictive pump shut-off algorithm,10 and preliminary outpatient (at-home) trials showed a reduction in overnight hypoglycemia by almost 50%.11,12 PISAs caused false suspensions in these studies and should be prevented.13 When a PISA occurred, the predictive algorithm underpredicted glucose and, in some cases, shut off the pump inappropriately. This, in turn, led to higher than desired morning glucose levels. We refer to pump shut-offs that occur unnecessarily due to PISAs as undesirable pump shut-offs; an example is shown in Figure 1.13,14
Figure 1.
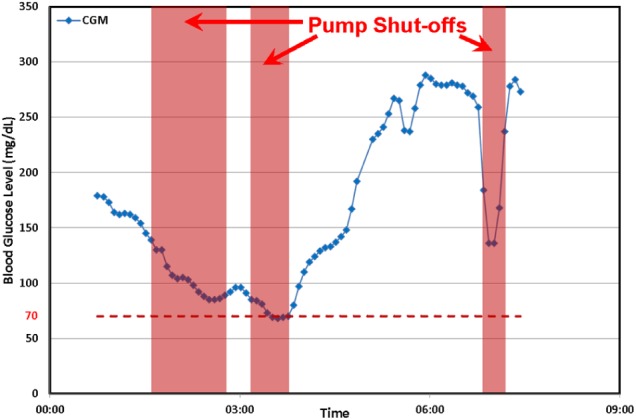
In this overnight study there are three periods where a pump shut-off occurred. The third shut-off is due to a PISA event, and was deemed to be an undesirable pump shut-off.13,14
The primary goal of this article is to introduce a novel method to detect PISAs and to illustrate its range of available performance by using 1125 nights of a recent large outpatient study.12
Methods
Generally, the start of a PISA is characterized by a sudden decrease in glucose levels that violate physiological rate-of-change limits. The end of a PISA generally occurs at least 15 minutes later and has a negative rate of rate of change. A Kalman filter algorithm was used to provide glucose predictions at 1-minute intervals, which are updated when a new sensor signal is available (typically at 5-minute intervals); Kalman filter implementation details are available in Cameron et al.10
Pressure-Induced Sensor Attenuation (PISA) Detection Algorithm
There are two sets of rules to be used for detecting/entering a new PISA event/series and for ending/leaving ongoing attenuations. When the algorithm reads a new CGM at time step k, it checks the following criteria,
a.
b.
c. OR
where is the rate of change (ROC) in CGM and is calculated as . It should be noted here that k is the index of a valid CGM reading and the time between consecutive readings,, might not be constant. The algorithm applies these rules starting from the third valid reading (a) to perform successful calculation of current and previous ROCs. The second rule (b) is related to the magnitude of the last ROC in CGM. The algorithm compares this value () with a threshold value () to see if the decrease in CGM is rapid and larger than expected. In addition to these two rules, we need a confirmation of having a relatively (by the order of ) larger decrease in CGM by checking the ratio of current and previous ROC values (c). The latter will be ignored if the previous ROC of CGM is positive. If all three conditions above are satisfied, then the CGM value,, will be marked as the start of a PISA and will not be used by the pump shut-off algorithm.
Each subsequent reading is assumed to be a continuation of the PISA unless one of the following conditions is satisfied,
d.
e.
- f.
where is the total number of CGM values marked as PISA since last known good reading. If the current PISA is longer than or equal to a given time window, (d), or if the time between the last two CGM readings is greater than a sensor dropout threshold, (e), then the PISA is accepted to be over. The PISA also ends if the last CGM ROC is greater than a given limit, , and one of the following four rules are satisfied: (i) the current CGM, , has risen back above the Kalman estimated glucose value, , (ii) a decreasing ROC over the last four CGM readings indicates that the CGM drop is recovering to a physiologically likely value, that is, negative ROC of last two CGM ROC values which is calculated as , (iii) and (iv) there was a recalibration in CGM and this is a false positive PISA detection. If the ratios of the CGM ROC values calculated in this subrule fall in the given range (between and , the values are given in Table 1), the trend of CGM before and after the sudden drop are similar (i.e., their signs should be the same and therefore the ratios in the inequalities should be positive), and this behavior could be because of a recalibration. At this time, we should also make an additional comment on the CGM ROC values (first derivatives) when subrule (ii) was executed to end PISA: while positive CGM ROC values could be a clear indication of a rebound, their negative values might be a recovery from a potential false PISA detection.
Table 1.
Parameters and Their Ranges Used in PISA Detection Algorithm.
| Parameter | Values |
|---|---|
| ∈ {−1.90, . . . thru . . . −3.10, in −0.10 intervals} | |
| ∈ {–2.80, –2.90, –3.00, –3.10} | |
| ∈ {1.20, 1.30, 1.50, 1.70} | |
| , | ∈ {1 ± 0.30, 1 ± 0.20, 1 ± 0.10} |
The proposed approach for detecting CGM sensor attenuations were assessed retrospectively on 1125 nights of an outpatient, “in-home” trial where the patients used a pump suspension system that included a MiniMed Paradigm® REAL-Time Veo™ System and Enlite™ glucose sensor (Medtronic Diabetes, Northridge, CA).12 The data include nearly 108 000 CGM readings at mostly 5-minute intervals with at least 4 hours of data in each night. The gold standard for PISAs was determined by visual inspection of all data points by an expert engineer since no reference glucose values are available. This evaluation was performed on an in-house developed web-based data analysis environment and a total of 3267 CGM readings (~3%) that are believed to be attenuated (PISA) were manually picked.
To illustrate the available range of performance, 178 different “parameter sets” were formed by selecting a value for each parameter from the ranges given in Table 1. These values were fed to the algorithm along with the CGM data obtained from the outpatient study (1125 nights). The readings detected as PISA were compared with PISA gold values and corresponding truth measures were found using the following definitions:
If any CGM reading is detected by the algorithm as PISA, we call it as “positive,” and if any CGM reading is marked as PISA by the gold standard, we accept it as “true.” Table 2 summarizes the criteria for the decision of truth measures.
Table 2.
Definition of Truth Measures for Each CGM Reading in Parameter Testing.
| If marked as PISA by the gold standard |
|||
|---|---|---|---|
| True | False | ||
| If detected as PISA by the algorithm | + | TP (true positive) | FP (false positive) |
| – | FN (false negative) | TN (true negative) | |
True positive rate, TPR (sensitivity) = TP/P = TP/(TP + FN), and false positive rate, FPR (1 − specificity) = FP/N = FP/(FP + TN) values for each parameter set were calculated.
Results
Truth measures were calculated for each parameter set and corresponding TPR and FPR values were plotted in Figure 2. There are four sets represented by larger symbols and different colors in the figure: “aggressive,” “nominal,” “cautious,” and “trial” (the values used during an ongoing clinical trial). These specific sets were chosen to further illustrate the effect of parameters on individual nights. In the aggressive set, we obtained the highest true positive (88.34%) and false positive (6.96%) rates. On the other hand, the cautious set yielded the lowest TPR (63.64%) and FPR (1.70%) values. Although both parameter sets seems reasonable to use to detect PISAs, it also gives an option to the user to trade-off between true/false positive rates according to their comfort level. The TPR and FPR values for the nominal set were found to be 81.05% and 3.36%, respectively. The parameters used in these sets are listed in Table 3.
Figure 2.
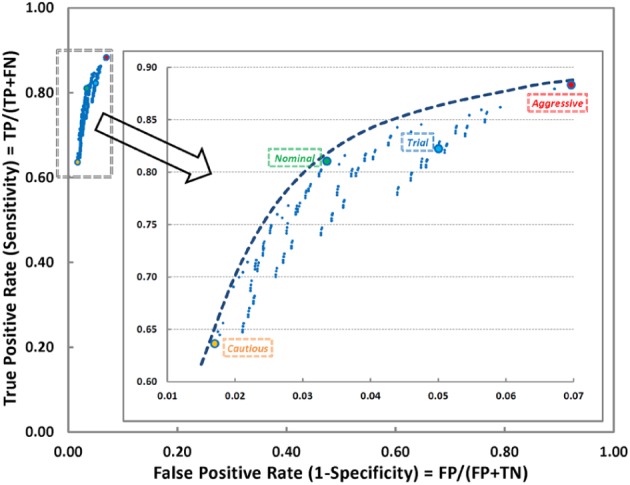
Receiver operating characteristic curve shows the effect of various parameter sets. Inset is the magnified area for better visualization. Larger dots represent various sets of parameters selected for further analysis. Aggressive set has the highest true positive rate while on the other hand; cautious set has the lowest false positive rate. Nominal set has parameters between aggressive and cautious, and the trial set was determined in the region relatively closer to the aggressive and currently being used in a clinical study.
Table 3.
Selected Parameter Sets With Corresponding Values.
| Set | , | TPR (%) | FPR (%) | |||
|---|---|---|---|---|---|---|
| Aggressive | −1.90 | −2.80 | 1.20 | 1 ± 0.10 | 88.34 | 6.96 |
| Trial | −2.00 | −3.10 | 1.50 | 1 ± 0.30 | 82.25 | 5.00 |
| Nominal | −2.50 | −2.80 | 1.30 | 1 ± 0.30 | 81.05 | 3.36 |
| Cautious | −3.10 | −2.80 | 1.30 | 1 ± 0.30 | 63.64 | 1.70 |
The “trial” parameter set is in a region between the aggressive and the nominal sets with TPR and FPR values of 82.25% and 5.00%, respectively. This parameter set is currently being used in a PISA detection algorithm which is implemented in an active outpatient trial to investigate the reduction of nocturnal hypoglycemia by using predictive algorithms and pump suspension.15 The study includes 90 individuals with type 1 diabetes from an age group of 3- to 15-year-old children and the length of the trial is planned to be 42 nights per individual.
Figure 3 shows four sample plots that illustrate the difference in performance between the different parameter sets. The diamond symbols refer to the PISA gold standard, and red, blue, green and orange upper arrow symbols are used for detected PISA regions by using aggressive, trial, nominal, and cautious sets, respectively. In Figure 3a, there are no CGM readings detected as PISA using the cautious parameter set since none of the negative ROC values in blood glucose readings are greater than 3.1 mg/dL in that region. Similarly the first PISA region was not successfully detected by the nominal parameter set. Figure 3b shows the importance of the ratio of the last two ROC of CGM values. The aggressive and nominal sets detect a PISA just before 10:00 am while trial and cautious sets do not. Since the negative ROC of CGM parameters in these sets are in ascending order, value of 1.50 for the trial set prevented the detection of the PISA. Figure 3c is a good example for the aggressive set. All others could not detect the attenuation at around 1:55 am because of a relatively small drop in the CGM value. To understand the behavior of the next plot, recall the rule (f{iv}) of the PISA detection algorithm. This part of the algorithm checks the trend of readings before and after a sudden decrease in CGM to see if there is a recalibration. In Figure 3d, both aggressive and trial sets detected a PISA just after 5:00 am but recover it by applying this recalibration check. It is very obvious that the existence of recalibration information along with CGM data would improve quality of the detection of sensor attenuations.
Figure 3.

The effect of each parameter set is shown in individual night continuous glucose monitor (CGM) plots.
Discussion
Sensor anomalies can cause problems in open-loop, low glucose suspend, or fully closed-loop studies. One sensor anomaly occurs when a patient applies pressure on the sensor site. Another anomaly is infusion set failure, which can occur due to blocked or dislodged sets, inflammation, or leakage. Techniques for both infusion set failure and CGM sensor attenuation detection16 are also presented by Baysal et al.13 Facchinetti et al17 present a Kalman-filter-based algorithm to detect sensor and infusion set anomalies and apply the approach in simulation studies using the UVa simulator.18 In another study, different cases were investigated to evaluate the performances of CGM systems.19
This algorithm only uses CGM readings. Adding extra information can only improve performance. Particularly, adding information about calibrations would remove false positives. Adding orientation information could allow this algorithm to be enabled only when the patient is prone and potentially sleeping. Adding extra CGM sensors would provide hardware redundancy, mitigate the lost readings during a PISA, and provide reference values to further tune the algorithm.9 Information about insulin, meals, and exercise just before sleep could help eliminate false positives around rapid decreases in the glucose level.20
Conclusions
Application of the PISA algorithm detected 88.34% of the PISA gold standard readings successfully with a 6.96% false positive rate. It was shown that the latter could be reduced to 1.70% by altering the parameters of the algorithm from “aggressive” to “cautious.”
The proposed PISA detection algorithm for use in overnight studies can lead to a significant reduction in undesired pump shut-offs that occur due to PISA-related events. This in turn may lead to a lower risk of elevated mean glucose levels and also lead to a lower overall A1c and better health outcomes for people with type 1 diabetes.
Acknowledgments
The data used in this article were collected at the Barbara Davis Center for Childhood Diabetes in Aurora, Colorado, the Stanford Hospital in Stanford, California, and St. Joseph’s Health Care in London, Ontario. We would like to recognize John Lum (Jaeb Center for Health Research) for his significant review and feedback on the manuscript.
Appendix
In Home Closed-Loop Study Group
Clinical Centers: Listed with clinical center name, city, and state. Personnel are listed as (PI) for principal investigator, (I) for co-investigator, and (C) for coordinator: Division of Pediatric Endocrinology and Diabetes, Stanford University, Stanford, CA: Bruce A. Buckingham, MD (PI); Darrell M. Wilson, MD (I); Tandy Aye, MD (I); Paula Clinton, RD (C); Breanne P. Harris (C). Barbara Davis Center for Childhood Diabetes, University of Colorado, Denver, CO: H. Peter Chase, MD (PI); David M. Maahs, MD, PhD (I); Robert Slover, MD (I); Paul Wadwa, MD (I); Jaime Realsen (C); Laurel Messer, RN, CDE (C). St. Joseph’s Health Care, London, ON: Irene Hramiak, MD, FRCP (PI); Terri Paul, MD, MSc, FRCPC (I); Sue Tereschyn, RN, CDE, CCRA (C); Marsha Driscoll, BScN, RN, CDE (C). Rensselaer Polytechnic Institute, Troy, NY: B. Wayne Bequette, PhD (PI); Fraser Cameron, PhD (I), Nihat Baysal, PhD (I). Coordinating Center: Jaeb Center for Health Research, Tampa, FL: Roy W. Beck, MD, PhD (PI); John Lum, MS; Craig Kollman, PhD; Peter Calhoun, MA; Judy Sibayan, MPH, Nelly M. Njeru, BA; Werner Sauer, BS; Jennifer Lott. Data and Safety Monitoring Board: John C. Pickup, BM, DPhil (chair), Irl Hirsch, MD; Howard Wolpert, MD.
Footnotes
Abbreviations: CGM, continuous glucose monitor; PISA, pressure-induced sensor attenuation; ROC, rate of change.
Declaration of Conflicting Interests: BAB: Medtronic MiniMed (medical advisory board, research support). HPC: Dexcom (research grants).
Funding: The project described was supported by the National Institute of Diabetes and Digestive and Kidney Diseases (R01DK085591), grants from JDRF (22-2013-266, 22-2011-647, 3-2011-80), and the JDRF Canadian Clinical Trial Network (CCTN), which is a public–private partnership including JDRF International, JDRF-Canada (JDRF-C), and the Federal Economic Development Agency for Southern Ontario (FedDev Ontario) and is supported by JDRF grant 80-2010-585. The content is solely the responsibility of the authors and does not necessarily represent the official views of the National Institute of Diabetes and Digestive and Kidney Diseases or the National Institutes of Health.
Contributor Information
for the In Home Closed-Loop Study Group (IHCL):
Bruce A. Buckingham, Darrell M. Wilson, Tandy Aye, Paula Clinton, Breanne P. Harris, H. Peter Chase, David M. Maahs, Robert Slover, Paul Wadwa, Jaime Realsen, Laurel Messer, Irene Hramiak, Terri Paul, Sue Tereschyn, Marsha Driscoll, B. Wayne Bequette, Fraser Cameron, Nihat Baysal, Roy W. Beck, John Lum, Craig Kollman, Peter Calhoun, Judy Sibayan, Nelly M. Njeru, Werner Sauer, Jennifer Lott, John C. Pickup, Irl Hirsch, and Howard Wolpert
References
- 1. Bequette BW. Continuous glucose monitoring: real-time algorithms for calibration, filtering and alarms. J Diabetes Sci Technol. 2010;4(2):404-418. [DOI] [PMC free article] [PubMed] [Google Scholar]
- 2. Bequette BW. Challenges and progress in the development of a closed-loop artificial pancreas. Annu Rev Control. 2012;36:255-266. [DOI] [PMC free article] [PubMed] [Google Scholar]
- 3. Klonoff DC. A review of continuous glucose monitoring technology. Diabetes Technol Ther. 2005;7(5):770-775. [DOI] [PubMed] [Google Scholar]
- 4. Vashist SK. Continuous glucose monitoring systems: a review. Diagnostics. 2013;3:385-412. [DOI] [PMC free article] [PubMed] [Google Scholar]
- 5. Wang J. Electrochemical glucose biosensors. Chem Rev. 2008;108:814-825. [DOI] [PubMed] [Google Scholar]
- 6. Helton KL, Ratner BD, Wisniewski NA. Biomechanics of the sensor-tissue interface—effects of motion, pressure, and design on sensor performance and the foreign body response—part I: theoretical framework. J Diabetes Sci Technol. 2011;5(3):632-646. [DOI] [PMC free article] [PubMed] [Google Scholar]
- 7. Helton KL, Ratner BD, Wisniewski NA. Biomechanics of the sensor-tissue interface—effects of motion, pressure, and design on sensor performance and the foreign body response—part II: examples and application. J Diabetes Sci Technol. 2011;5(3):647-656. [DOI] [PMC free article] [PubMed] [Google Scholar]
- 8. Breton MD, Kovatchev BP, Budiman ES, Doniger KJ, inventors; Abbott Diabetes Care Inc, University of Virginia Patent Foundation, assignees. Method, system and computer program product for real-time detection of sensitivity decline in analyte sensors. United States patent US 8,135,548 B2. March 13, 2012. [Google Scholar]
- 9. Mensh BD, Wisniewski NA, Neil BM, Burnett DR. Susceptibility of interstitial continuous glucose monitor performance to sleeping position. J Diabetes Sci Technol. 2013;7(4):863-870. [DOI] [PMC free article] [PubMed] [Google Scholar]
- 10. Cameron F, Wilson DM, Buckingham BA, et al. In-patient studies of a Kalman filter based predictive pump shut-off algorithm. J Diabetes Sci Technol. 2012;6(5):1142-1147. [DOI] [PMC free article] [PubMed] [Google Scholar]
- 11. Buckingham BA, Cameron F, Calhoun P, et al. Outpatient safety assessment of an in-home predictive low-glucose suspend system with T1D subjects at elevated risk of nocturnal hypoglycemia. Diabetes Technol Ther. 2013;15(8):622-627. [DOI] [PMC free article] [PubMed] [Google Scholar]
- 12. Maahs DM, Calhoun P, Buckingham BA, et al. A randomized trial of a home system to reduce nocturnal hypoglycemia in type 1 diabetes. Diabetes Care. 2014;37:1885-1891. [DOI] [PMC free article] [PubMed] [Google Scholar]
- 13. Baysal N, Cameron F, Buckingham BA, Wilson DM, Bequette BW. Detecting sensor and insulin infusion set anomalies in an artificial pancreas. In: Proceedings of the 2013 American Control Conference (ACC) New York, NY: IEEE; 2013:2929-2933. [Google Scholar]
- 14. Baysal N, Cameron F, Buckingham BA, Wilson DM, Chase HP, Bequette BW. Nocturnal CGM signal attenuation: An outpatient study. J Diabetes Sci Technol. 2013;7(1):A9. [Google Scholar]
- 15. In Home Closed-Loop Study Group. Outpatient reduction of nocturnal hypoglycemia by using predictive algorithms and pump suspension in children. Available at: http://clinicaltrials.gov/show/NCT01823341. Accessed April 10, 2014.
- 16. Herrero P, Calm R, Vehí J, et al. Robust fault detection system for insulin pump therapy using continuous glucose monitoring. J Diabetes Sci Technol. 2012;6(5):1131-1141. [DOI] [PMC free article] [PubMed] [Google Scholar]
- 17. Facchinetti A, Del Favero S, Sparacino G, Cobelli C. An online failure detection method of the glucose sensor-insulin pump system: improved overnight safety of type 1 diabetic subjects. IEEE Trans Biomed Eng. 2013;60(2):406-416. [DOI] [PubMed] [Google Scholar]
- 18. Kovatchev BP, Breton M, Dalla Man C, Cobelli C. In silico preclinical trials: a proof of concept in closed-loop control of type 1 diabetes. J Diabetes Sci Technol. 2009;3(1):44-55. [DOI] [PMC free article] [PubMed] [Google Scholar]
- 19. Obermaier K, Schmelzeisen-Redeker G, Schoemaker M, et al. Performance evaluations of continuous glucose monitoring systems: precision absolute relative deviation is part of the assessment. J Diabetes Sci Technol. 2013;7(4):824-832. [DOI] [PMC free article] [PubMed] [Google Scholar]
- 20. Stenerson M, Cameron F, Wilson DM, et al. The impact of accelerometer and heart rate data on hypoglycemia mitigation in type 1 diabetes. J Diabetes Sci Technol. 2014;8(1):64-69. [DOI] [PMC free article] [PubMed] [Google Scholar]