Abstract
For decades, neurophysiologists have characterized the biophysical properties of a rich diversity of neuron types. However, identifying common features and computational roles shared across neuron types is made more difficult by inconsistent conventions for collecting and reporting biophysical data. Here, we leverage NeuroElectro, a literature-based database of electrophysiological properties (www.neuroelectro.org), to better understand neuronal diversity, both within and across neuron types, and the confounding influences of methodological variability. We show that experimental conditions (e.g., electrode types, recording temperatures, or animal age) can explain a substantial degree of the literature-reported biophysical variability observed within a neuron type. Critically, accounting for experimental metadata enables massive cross-study data normalization and reveals that electrophysiological data are far more reproducible across laboratories than previously appreciated. Using this normalized dataset, we find that neuron types throughout the brain cluster by biophysical properties into six to nine superclasses. These classes include intuitive clusters, such as fast-spiking basket cells, as well as previously unrecognized clusters, including a novel class of cortical and olfactory bulb interneurons that exhibit persistent activity at theta-band frequencies.
Keywords: neuron biophysics, intrinsic membrane properties, electrophysiology, neuron diversity, neuroinformatics, text mining, databases
neurophysiologists have recorded and published vast amounts of quantitative data about the biophysical properties of neuron types across many years of study. Compared with other fields, however, little progress has been made in compiling and cross-analyzing these data, let alone collecting or depositing measurements or raw data (Akil et al. 2011; Ferguson et al. 2014). It is thus difficult, for example, to determine whether a cerebellar Purkinje cell is more similar to a hippocampal CA1 pyramidal cell or a cortical basket cell without first recollecting such data in a dedicated experiment, even though thousands of recordings have been made from these neuron types across many laboratories. By analogy to genetics, imagine if genes needed to be resequenced every time an investigator wanted to examine genetic homology (Altschul et al. 1990; Benson et al. 2013).
The fundamental challenge in comparing electrophysiological data collected across laboratories is twofold. First, unlike genetic sequences (Altschul et al. 1990; Benson et al. 2013) or neuron morphologies (Ascoli et al. 2007), electrophysiological data are not compiled centrally but remains scattered throughout the vast literature (Akil et al. 2011; Ferguson et al. 2014). Second, and perhaps more critically, electrophysiological data are collected and reported using inconsistent methodologies and nomenclatures (Ascoli et al. 2008). Thus, if two laboratories report phenotypic differences for the same neuron type, do these differences reflect true biological differences or are they merely the result of methodological differences? These challenges stand as a major barrier to comparison and generalization of results across neuron types and routinely lead to unnecessary replication of experiments and the slowing of progress (Akil et al. 2011; Ferguson et al. 2014).
Here, we present a novel approach for integrating and normalizing arbitrarily large amounts of brain-wide electrophysiological data collected across different laboratories. In contrast to costly ongoing efforts by large institutes to record such data anew (Insel et al. 2013; Kandel et al. 2013; Markram 2006), our methods capitalize on the immense wealth of data on neuronal biophysics that has already been painstakingly recorded and published, for example, in journals such as this one. By leveraging the methodological variability inherent in how different laboratories collect and report biophysical data, we develop statistical methods to disentangle the confounding role of methodological inconsistencies from true biophysical differences among neuron types. This allows us to normalize and compare data collected across laboratories, including our own, and assess whether neuron types in disparate regions of the brain share common electrophysiological profiles and thereby fulfill common computational and circuit functions.
This work is of relevance to the broad community of neurophysiologists and computational modelers as it makes large amounts of valuable electrophysiological data easily accessible for subsequent comparison, reuse, and reanalysis. More generally, our work offers a partial solution to the perceived reproducibility crisis in science (Collins and Tabak 2014; Ioannidis 2005; Vasilevsky et al. 2013) by demonstrating how data collected using methodologically inconsistent sources can be combined and leveraged to generate novel insights.
MATERIALS AND METHODS
Electrophysiological Database Construction
We built a custom infrastructure for extracting neuron type-specific electrophysiological measurements, such as resistance input (Rinput) and half-width action potential (APhw), as well as associated metadata (detailed in Tripathy et al. 2014). Briefly, our methods for obtaining this information are as follows. First, we obtained thousands of full article texts as HTML files from publisher websites. We next searched for articles containing structured HTML data tables; within these tables we used text-matching tools to find entities corresponding to electrophysiological concepts like “input resistance” and “spike half-width.” Our methodology accounts for common synonyms and abbreviations of these properties (e.g., “input resistance” is often abbreviated as “Rin”).
To identify measurements from neuron types collected in control or normotypic conditions, we primarily used manual curation. We used the listing of vertebrate neuron types provided by NeuroLex (Larson and Martone 2013; Shepherd 2003) (http://neurolex.org/wiki/Vertebrate_Neuron_overview) to link mentions of a neuron type within an article to a canonical, expert-defined neuron type. After identifying both neuron type and electrophysiological concepts, we then extracted the mean electrophysiological measurement (and when possible, the error term and number of replicates). In most cases, however, our current methods were unable to extract the number of replicates; we thus have limited our focus here to analyses using mean measurements alone. Following application of the automated algorithms, we manually curated the extracted information and standardized electrophysiological property measurements to the same overall calculation methodology (e.g., see appendix). In addition, we also used manual curation alone to extract information from ∼35 articles, which did not contain information in a formatted data table (typically older articles only available as PDFs or articles specific to olfactory circuit physiology).
We also obtained information on article-specific experimental conditions from each article's methods section. Specifically, we considered the effect of animal species, animal strain (here we distinguished between strains of rats but not different genetic strains of mice), electrode type (sharp vs. patch clamp), preparation type (in vitro, in vivo, cell culture), liquid junction potential correction (explicitly corrected, explicitly not corrected, not reported in the article), animal age (in days; when only animal weight was reported, we manually converted reported weight to an approximate age using conversion tables provided by animal vendors), and recording temperature (we assigned reports of “room temperature” recordings to 22°C and in vivo recordings to 37°C). Additional methodological details, including recording and electrode solution contents and pipette resistances, will be considered in future iterations.
Explicit details and evaluation criteria for the quality control (QC) audit of the NeuroElectro database are provided in the appendix.
Data Analysis
Data filtering and preprocessing.
Before performing systematic analyses of the data within the NeuroElectro database (i.e., see data referred to following Fig. 2 onwards, unless otherwise specified), we performed the following filtering steps: 1) we excluded nonbrain neuron types (e.g., we excluded spinal cord neuron types); 2) we excluded data collected from dissociated and slice cell cultures; 3) to account for large differences in animal age across species, we only used data from rats, mice, and guinea pigs; 4) we excluded data from embryonic and perinatal (<5 days) animals; and 5) due to inconsistencies in the definition of membrane time constant (τm), we excluded measurements of τm, which deviated >2 SD from the median measurement across articles. Where metadata attributes were not reported or were unidentifiable within an article (which was typically rare for the experimental conditions that we focused on), we used mean (or mode) imputation for continuous (or categorical) metadata attributes (Little and Rubin 2002).
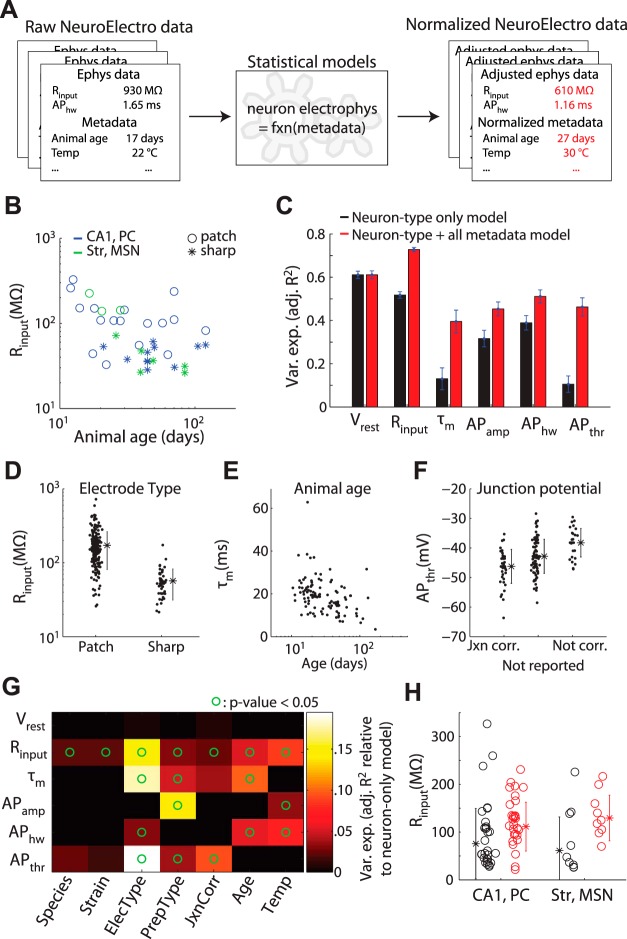
Fig. 2.
Methodological differences significantly explains observed variability in literature-mined electrophysiological data. A: cartoon illustrating metadata-based NeuroElectro data normalization. B: example data showing how measured values of Rinput vary as a function of recording electrode type and animal age. C: variance explained by statistical models for each electrophysiological property when only neuron type information is used (black) and when neuron type plus all metadata attributes are used (red). Error bars indicate SD, computed from 90% bootstrap resamplings of the entire dataset. D–F: example relationships between specific metadata predictors and variation in electrophysiological properties. Dots show model-adjusted electrophysiological measurements after accounting for specific differences across neuron types. F: refers to correction of liquid junction potential (“jxn”). Asterisks indicate population mean and error bars indicate SD. G: influence of individual metadata predictors in helping explain variance in specific electrophysiological properties. Heatmap values indicate relative improvement over the model that includes neuron type information only. Circles indicate where the regression model including a metadata attribute was statistically more predictive than the model with neuron type information alone (P < 0.05, ANOVA). PrepType label indicates in vitro vs. in vivo. H: example data before (black) and after using statistical models to adjust for differences in metadata among electrophysiological measurements (red). Measurements become less variable and skewed after adjustment for methodological differences.
Metadata incorporation.
We used statistical models to account for the influence between heterogeneous experimental conditions and measured electrophysiological values. Specifically, we modeled the relationship between electrophysiological measurements and experimental metadata as = βX, where denotes the vector of electrophysiological measurements corresponding to a single property across all articles [e.g., resting membrane potential (Vrest)]; X denotes the regressor matrix where rows denote the metadata attributes associated with a single measurement yi (e.g., = [xNeuronType,i, xSpecies,i, xStrain,i, …]) and β are the regression coefficients denoting the relative contribution of each metadata attribute. We log10-transformed measurements of Rinput, τm, APhw, and animal age to normalize values because these varied across multiple orders of magnitude and/or to enforce that these values remain strictly positive following metadata-based adjustment.
When combining the influence of multiple metadata attributes into a single regression model (see Fig. 2C), we wished to use powerful and flexible models to capture the relationship between metadata and measurement variance while also mitigating the tendency of more complex statistical models to overfit the data. Thus, when fitting statistical models, we used stepwise regression methods (implemented as LinearModel.stepwise in MATLAB) to add model terms one-by-one and added terms until the model's Bayesian information criterion (BIC) was optimized. Our choice of BIC here is based on its conservativeness relative to other approaches for model selection, which helps protect against statistical overfitting. Furthermore, for each electrophysiological property, we selected the potential model complexity from a set of candidate models (i.e., models that included terms for only: constant, linear, purely quadratic, interaction, interaction + quadratic). We selected model complexity using 10-fold cross validation and minimization of the sum of squared errors on out-of-sample data. In reporting the variance explained by different models, we used adj. R2 to compare between models differing in their number of parameters.
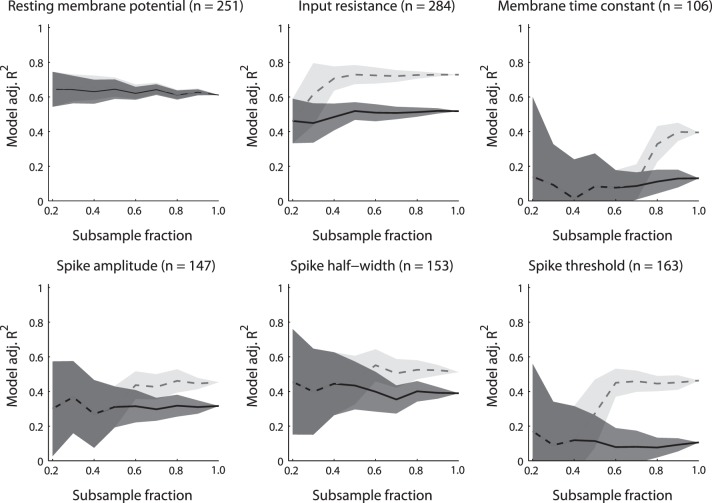
After fitting metadata regression models for each electrophysiological property, for subsequent analysis we adjusted each electrophysiological measurement to its estimated value had it been measured under conditions described by the population mean metadata value (or mode for categorical metadata attributes). For example, since the majority of measurements represented in NeuroElectro were recorded using patch-clamp electrodes, we then adjusted data values obtained using sharp electrodes to their predicted value had they been recorded using patch-clamp electrodes. To assess the robustness of the fit of the regression models, we re-ran the regression analysis on different versions of the dataset where the data were randomly subsampled (see appendix). Note that the penalty that BIC imposes against overfitting is stronger when there are fewer data points used to fit the models. Thus progressively subsampling the dataset penalizes away the amount of variance in the electrophysiological data that can be explained by experimental metadata.
Electrophysiological property correlation and neuron type similarity analyses.
For analysis of electrophysiological and neuron type correlations, we first pooled data by averaging measurements collected within the same neuron type. We then defined each neuron type using its vector of six electrophysiological measurements. We quantified correlations between pairs of electrophysiological properties using Spearman's correlation, which assesses the rank correlation and allows for detection of relationships that are monotonic but not necessarily linear. We used the Benjamini-Hochberg false discovery rate procedure to control for multiple comparisons performed in the pairwise correlation analysis.
To quantify how much variance across electrophysiological properties could be explained by subsequent principal components (PCs), we needed to first account for missing or unobserved measurements within our dataset. For example, some neurons did not have a reported measurement for τm or AP threshold (APthr) within our dataset. To address this issue of missing data (Little and Rubin 2002), we used probabilistic principal component analysis (pPCA), a modification of traditional PCA that is robust to missing data. To further mitigate the problem of missing data, in this analysis we only considered neuron types that were defined by at least three different articles and with no more than two of the six total electrophysiological properties missing; after this filtering step, <10% of total electrophysiological observations were missing.
To quantify the electrophysiological similarity of neuron types, we calculated the pairwise Euclidean distances between pairs of neuron types defined by the vector of six electrophysiological properties and used a dendrogram analysis to sort neuron types on the basis of electrophysiological similarity. Missing or unobserved electrophysiological measurements were imputed using pPCA, as described above. Here, we chose to be agnostic about the relative importance of each biophysical property and weighted biophysical properties based solely on their relative measurement uncertainty (see Fig. 2C for definition). Thus properties that tend to show greater cross-study variability (such as τm) will be less downweighted in this analysis relative to more reliable measurements like Vrest. Empirically, we found this weighting to help further mitigate unaccounted-for measurement and methodological variability.
The dendrogram, D, denoting the hierarchical similarity among neuron types, was constructed using linkages computed by Ward's minimum variance method. We used multiscale bootstrap resampling to assess the statistical significance of subtrees of D using the pvclust package in the language R (Felsenstein 2004; Suzuki and Shimodaira 2006) (referred to as the approximately unbiased P value, see Fig. 5). A detailed description of the pvclust algorithm methodology is provided in the appendix.
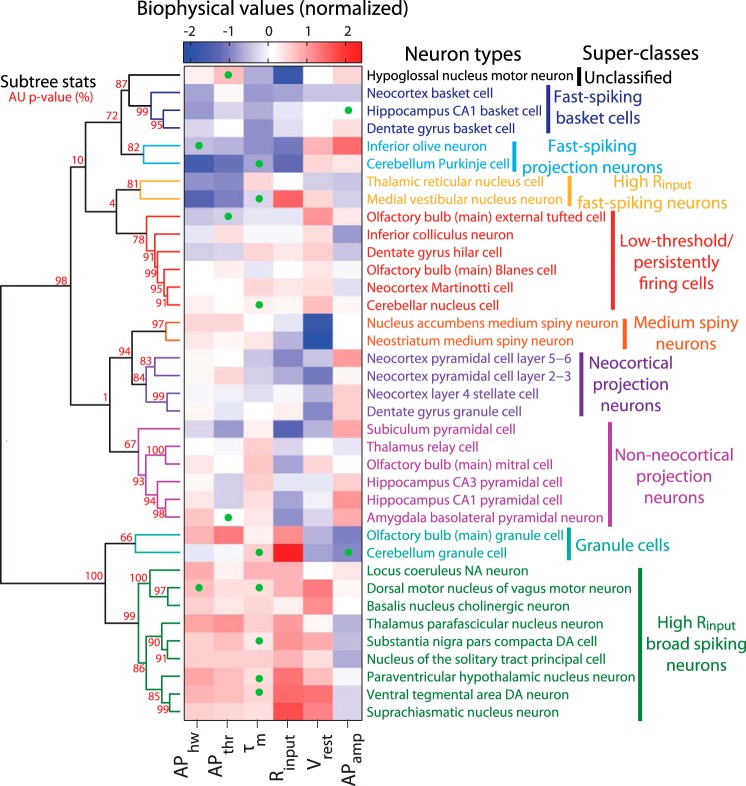
Fig. 5.
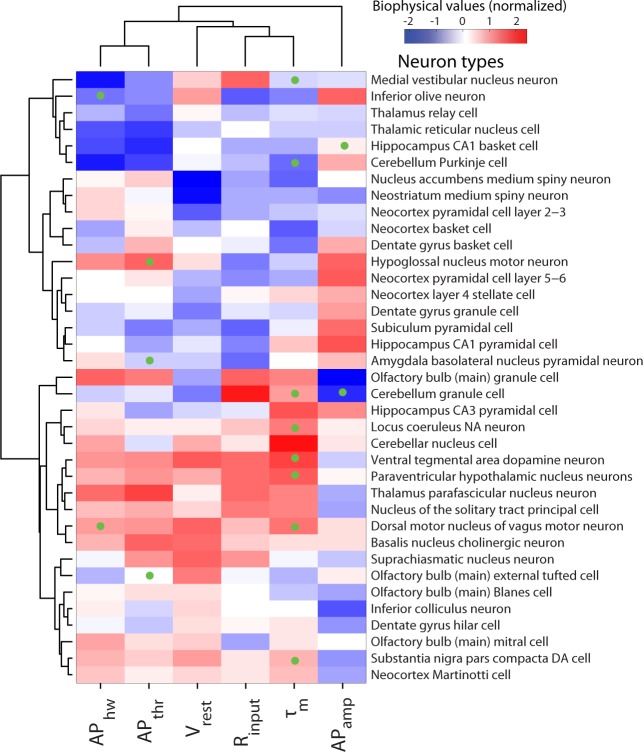
Hierarchical clustering of diverse neuron types on the basis of biophysical similarity. Neuron types sorted in order of biophysical similarity (similarity indicated by levels of dendrogram; dendrogram linkages computed using Ward's method and Euclidean distances). Heatmap values indicate observed neuron type-specific electrophysiological measurements, red (blue) values indicate large (small) values relative to mean across neuron types. Statistical consistency of dendrogram subtrees calculated via bootstrap resampling [red values indicate approximately unbiased (AU) P values (see materials and methods); P values rounded to nearest integer for visualization]. Dendrogram subtrees are grouped into neuron type superclasses indicated by text coloring (and are otherwise black) based on P values and visual inspection. Only neuron types with measurements defined by at least three articles and with at least 4 (of the 6 total) biophysical properties reported were used in this analysis. Probabalistic principal component analysis (PCA) was used to impute unobserved measurements, indicated via green dots on heatmap.
Acute Slice Electrophysiology
Animals.
Hippocampal CA1 pyramidal cell recordings were conducted using postnatal day (P)15–18 M72-GFP mice (Potter et al. 2001) and Thy1-YFP-G mice (Feng et al. 2000). Main olfactory bulb mitral cell recordings were conducted using P15-18 M72-GFP, Thy1-YFP-G, and C57BL/6 mice. A subset of data from these neurons has been published previously (Burton and Urban 2014). Main olfactory bulb granule cell recordings were conducted using P18-22 C57BL/6 and albino C57BL/6 mice. Neocortical basket cell recordings were conducted using a P26 parvalbumin reporter mouse, resulting from a cross between Pvalb-2A-Cre (Allen Institute for Brain Science) and Ai3 (Madisen et al. 2010) lines. Striatal medium spiny neuron recordings were conducted using P14-17 M72-GFP mice. A total of 20 mice of both sexes were used in this study. Animals were housed with littermates in a 12:12-h light-dark cycle. All experiments were completed in compliance with the guidelines established by the Institutional Animal Care and Use Committee of Carnegie Mellon University, which approved all procedures.
Slice preparation.
Mice were anesthetized with isoflurane and decapitated into ice-cold oxygenated dissection solution containing the following (in mM): 125 NaCl, 25 glucose, 2.5 KCl, 25 NaHCO3, 1.25 NaH2PO4, 3 MgCl2, and 1 CaCl2. Brains were rapidly isolated and acute slices (310-μm thick) prepared using a vibratome (VT1200S; Leica or 5000mz-2; Campden Instruments). Slices recovered for 30 min in ∼37°C oxygenated Ringer's solution that was identical to the dissection solution except for lower Mg2+ concentrations (1 mM MgCl2) and higher Ca2+ concentrations (2 mM CaCl2). Slices were then stored in room temperature oxygenated Ringer's solution until recording. Parasagittal slices were used for hippocampal and striatal recordings. Coronal slices were used for neocortical recordings. Horizontal slices were used for main olfactory bulb recordings.
Recording.
Slices were continuously superfused with oxygenated Ringer solution warmed to 37°C during recording. Cells were visualized using infrared differential interference contrast video microscopy. Hippocampal CA1 pyramidal cells (n = 10) were identified by their large soma size, pyramidal shape, and position within CA1. Neocortical basket cells (n = 5) were identified by expression of YFP fluorescence. Main olfactory bulb mitral cells (n = 10) were identified by their large cell body size and position within the mitral cell layer. Main olfactory bulb granule cells (n = 9) were identified by their small cell body size and position within the mitral cell or granule cell layers. Striatal medium spiny neurons (n = 8) were identified by their extensively spine-studded dendritic arbors viewable under epifluorescence through Alexa Fluor 594 cell fills. Whole cell patch-clamp recordings were made using electrodes (final electrode resistance: 6.1 ± 1.1 MΩ, μ ± σ; range: 4.4–8.7 MΩ) filled with the following (in mM): 120 K-gluconate, 2 KCl, 10 HEPES, 10 Na-phosphocreatine, 4 Mg-ATP, 0.3 Na3GTP, 0.2–1.0 EGTA, 0–0.25 Alexa Fluor 594 (Life Technologies), and 0.2% Neurobiotin (Vector Labs). Cell morphology was reconstructed under a ×100 oil-immersion objective with Neurolucida (MBF Bioscience). No cells included in this dataset exhibited gross morphological truncations. Mitral cells were recorded in the presence of CNQX (10 μM), DL-APV (50 μM), and Gabazine (10 μM) to limit the influence of spontaneous synaptic long-lasting depolarizations (Carlson et al. 2000) on measurements of biophysical properties. Data were low-pass filtered at 4 kHz and digitized as 10 kHz using a MultiClamp 700A amplifier (Molecular Devices) and an ITC-18 acquisition board (Instrutech) controlled by custom software written in IGOR Pro (WaveMetrics). The liquid junction potential (12–14 mV) was not corrected for. Pipette capacitance was neutralized and series resistance was compensated using the MultiClamp Bridge Balance operation and frequently checked for stability during recordings. Series resistance was maintained below ∼20 M for all pyramidal cell, mitral cell, basket cell, and medium spiny neuron recordings (14.0 ± 2.7 MΩ, μ ± σ; range: 8.4–20.1 MΩ). Higher series resistance (30.7 ± 6.2 MΩ, μ ± σ; range: 23.5–43.0 MΩ) was permitted in granule cell recordings due to their small (∼10 μm) soma sizes. After determination of each cell's native Vrest, current was injected to normalize Vrest to −65, −58, −65, −70, and −80 mV for pyramidal cells, mitral cells, granule cells, basket cells, and medium spiny neurons, respectively, before determination of other biophysical properties. In preliminary experiments, we also recorded from layer 5/6 neocortical pyramidal cells. However, these recordings were not further pursued due to the extensive electrophysiological and morphological heterogeneity observed within this broad category of neuron type.
Analysis.
Vrest was determined immediately after cell break in. τm Was calculated from a single-exponential fit to the initial membrane potential response to a hyperpolarizing step current injection. Rinput was calculated as the slope of the relationship between a series of hyperpolarizing step current amplitudes (that evoked negligible membrane potential “sag”) and the steady-state response of the membrane potential to injections of those step currents. In a subset of recordings, Rinput was also calculated as the steady-state response of the membrane potential to a single step current injection (evoking a ∼5-mV hyperpolarization) averaged across 50 trials. Both methods yielded equivalent results. To determine action potential properties of each neuron, a series of 2-s-long depolarizing step currents was injected into the neuron. The first action potential evoked by the weakest suprathreshold step current (i.e., the rheobase input) was used to determine the action potential properties of the neuron. APthr was calculated as the first point where the membrane potential derivative exceeded 20 mV/ms. AP amplitude (APamp) was measured from the point of threshold crossing to the peak voltage reached during the action potential. This amplitude was then used to determine APhw, calculated as the full action potential width at half-maximum amplitude of the action potential.
For the confusion matrix analysis (see Fig. 3), we used a Euclidean distance approach identical to that used in the analysis of electrophysiological neuron type similarity. Specifically, we represented each recorded single cell via its measurements along the six major electrophysiological properties. We then compared the similarity of each recorded neuron to the mean electrophysiological measurements of each of the five corresponding “canonical” neuron types from NeuroElectro, after either, first, adjusting the filtered NeuroElectro data to the methodological conditions used in our laboratory or using the raw and unfiltered data values from NeuroElectro, unnormalized for methodological differences. We classified each recorded single cell to the most similar of the canonical NeuroElectro neuron types by finding the NeuroElectro neuron type with the smallest Euclidean distance to the single cell, forming the basis for the confusion matrix.
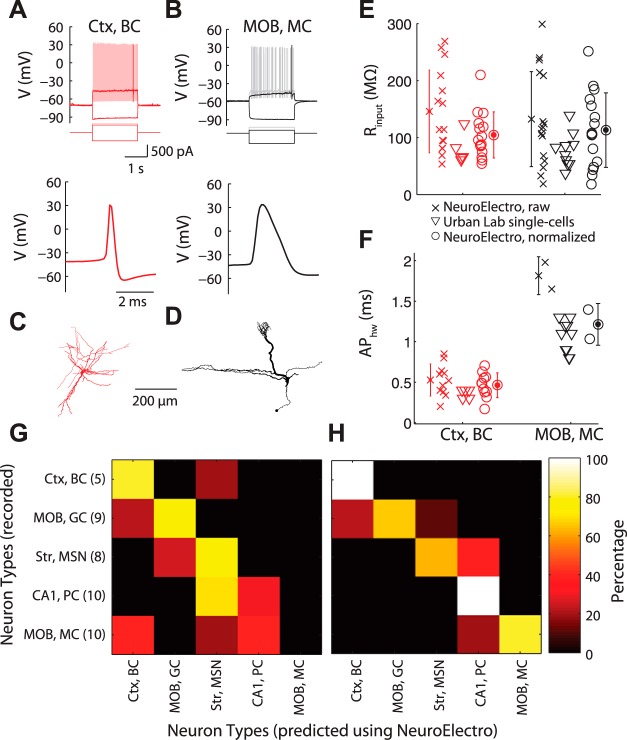
Fig. 3.
Direct comparison of NeuroElectro measurements to de novo recordings. A and B: representative recordings of a neocortical basket cell (Ctx, BC; A) and a main olfactory bulb mitral cell (MOB, MC; B), showing responses to hyperpolarizing, rheobase, and suprathreshold current injections (top), and action potential waveform (bottom). C and D: morphologies for cells in A and B. E and F: database measurements for mitral and basket cells before (crosses) and after (circles) metadata normalization and corresponding Urban Lab single cell measurements (triangles). Error bars indicate SD, computed across database measurements within a neuron type. G and H: confusion matrices highlighting classification of each recorded single cell to corresponding aggregate NeuroElectro neuron type for the raw (G) or metadata-normalized (H) NeuroElectro dataset. Matrix y-axis indicates recorded neuron identity and number within parentheses indicates n of recorded single cells per neuron type. The x-axis indicates the predicted neuron type based on biophysical similarity to NeuroElectro (i.e., perfect classification is a diagonal along matrix). MOB, GC, main olfactory bulb granule cell.
Data and Code Availability
The NeuroElectro dataset and spreadsheets listing mined publications, neuron types, and electrophysiological properties are provided at http://neuroelectro.org/static/src/ad_paper_supp_material.zip. The analysis code used here is available at http://github.com/neuroelectro.
RESULTS
Building an Electrophysiological Database by Mining the Research Literature
To make use of the formidable amount of neuronal electrophysiological data present within the research literature, we developed methods to attempt to “mine” such data from the text of published papers. While forgoing the difficulties of recording anew from multiple neuron types and brain areas, such a data-mining approach is not without its own challenges. These challenges include inconsistencies in published neuron naming schemes (Ascoli et al. 2008), in how electrophysiological properties are defined and calculated, and in experimental conditions themselves (Kandel et al. 2013). However, we reasoned that these limitations could potentially be overcome, by capitalizing on the redundancy of published values and the presence of informal community-based reporting standards (Ascoli et al. 2008; Toledo-Rodriguez et al. 2004). Our hope was thus to produce a unified dataset of sufficient quality for use in subsequent meta-analyses, and furthermore, that the dissemination of such a resource would encourage better standardization and consistency of future data collection.
We built a database, NeuroElectro, that links specific neuron types to measurements of biophysical properties reported within published research articles (Fig. 1A). Specifically, from 331 articles, we extracted and manually curated information on basic biophysical properties of 97 neuron types recorded during normotypic (i.e., “control”) conditions. Briefly, our mining strategy follows a three-stage process (detailed in Tripathy et al. 2014). First, we developed automated text-mining algorithms (Ambert and Cohen 2012; French et al. 2009; Yarkoni et al. 2011) to identify and extract content related to biophysical properties and experimental conditions. Our algorithms extracted reported mean biophysical measurement values, reflecting pooled values computed across multiple neurons within a type. Second, we manually curated the mined content, taking care to correctly label misidentified neuron types or electrophysiological properties. To help categorize the neuron types recorded within each article, we used the semistandardized listing of expert-defined neuron types provided by NeuroLex (Larson and Martone 2013; Shepherd 2003). Finally, we manually standardized the extracted electrophysiological values to a common set of units (e.g., gigaohm to megohm) and calculation conventions where possible (see appendix). We found the accuracy for data categorization and extraction to be 96% overall during a systematic QC audit (see appendix), which we deemed to be of sufficient quality for further meta-analyses.
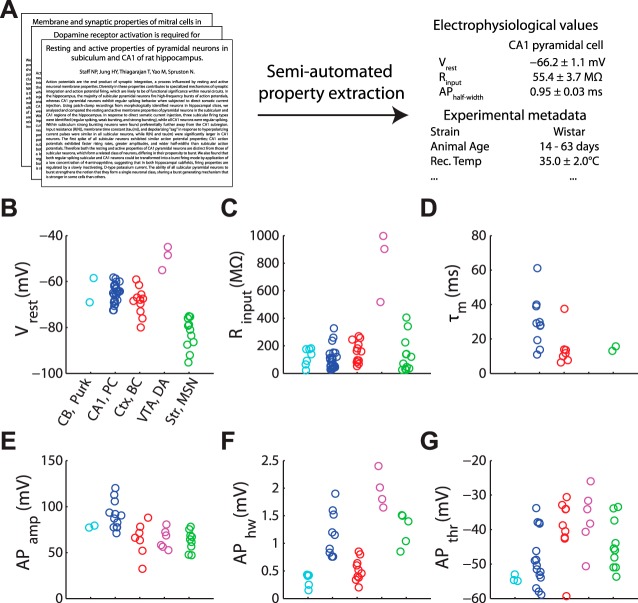
Fig. 1.
Schematic of NeuroElectro database construction and example electrophysiological measurements. A: semiautomated text-mining algorithms were applied to journal articles to extract neuron type-specific biophysical measurements and experimental conditions. B–G: example electrophysiological measurements extracted from the research literature for cerebellar Purkinje cells, CA1 pyramidal cells, cortical basket cells, ventral tegmental area dopaminergic cells, and striatal medium spiny neurons (abbreviated as CB, Purk; CA1, PC; Ctx, BC; VTA, DA; and Str, MSN). Vrest, resting membrane potential; Rinput, resistance input; τm, membrane time constant; APamp, APhw, and APthr, action potential amplitude, half-width, and threshold. Each circle denotes the value of the mean biophysical measurement value reported within an article.
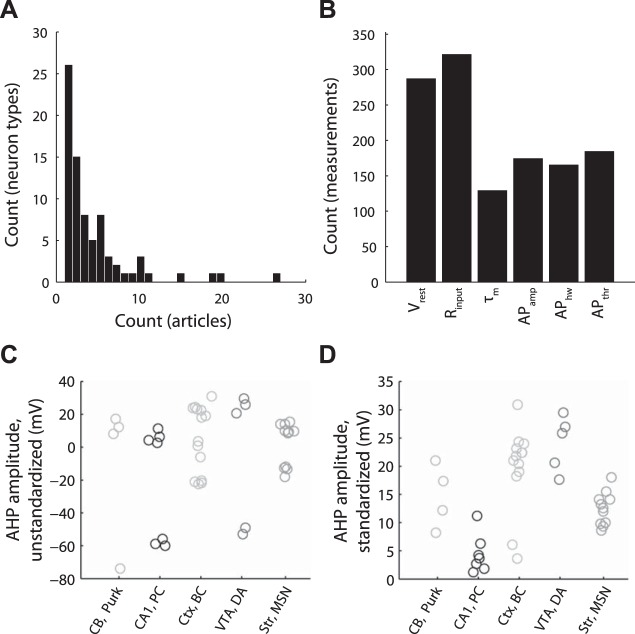
A sample of the resulting data is shown in Fig. 1 and the dataset in its entirety can be interactively explored through our web interface at http://neuroelectro.org. The dataset reflects known features of several neuron types; for example, cortical basket cells have narrow action potentials (Markram et al. 2004) and striatal medium spiny neurons rest at relatively hyperpolarized potentials (Gertler et al. 2008). In this study, we have focused our meta-analyses on six commonly and reliably reported biophysical properties: resting membrane potential, input resistance, membrane time constant, spike half-width, spike amplitude, and spike threshold (abbreviated as Vrest, Rinput, τm, APhw, APamp, APthr, respectively). Other parameters, such as spike afterhyperpolarization amplitude and time course, are recorded in NeuroElectro, but we chose not to not include them in the following analyses due to questions about the consistency of their reporting in the literature.
Experimental Metadata Explain Cross-Study Variance Among Electrophysiological Measurements
Our literature-based approach relies on pooling information across articles, which has the inherent advantage of distilling the consensus view of several expert investigators and laboratories. However, data collected under different experimental conditions may not be directly comparable. For example, Rinput tends to decrease as animals age (Okaty et al. 2009; Zhu 2000). Because NeuroElectro measurements are randomly sampled from the literature, relationships between experimental conditions (“metadata”) and electrophysiological measurements (“data”) should also be reflected within the dataset (Fig. 2, A and B). By annotating each electrophysiological measurement in our database with a corresponding set of experimental metadata (Fig. 2A), we were able to address the following three questions. First, can experimental metadata be used to account for and even correct for the variability of data reported across studies? Second, what is the influence of specific experimental conditions (e.g., recording temperature and electrode type) on measurements of biophysical properties? Third, what is the residual variability in reported values for a given neuron type after differences in several experimental conditions have been accounted for?
We used linear regression models to characterize the relationship between electrophysiological measurements and experimental metadata (after appropriate data filtering, like removing data from nonrodent species). We first asked to what extent the variability observed among electrophysiological measurements could be explained by neuron type alone (i.e., how consistent are measurements of the same neuron type from article-to-article). We found that Vrest was reported fairly consistently (Fig. 2C; adj. R2 = 0.6; i.e., 60% of the variability in Vrest across cells was explained by cell type). However, most properties, such as τm and APthr, had measurements that differed greatly across studies recording from the same neuron type (adj. R2 < 0.25). Thus there exists a large amount of variance in electrophysiological data that is unexplained by neuron type alone.
We found in many cases, however, that experimental metadata could significantly explain the variability in reported electrophysiological data (Fig. 2, D–F, summary in G). For example, knowing whether neurons were recorded using patch vs. sharp electrodes explained a substantial fraction of the observed variance in Rinput, with sharp electrodes yielding on average ∼100 MΩ lower Rinput than patch electrodes (Fig. 2D). Thus the dataset inherently reflects a historical controversy when the patch-clamp technique was first introduced and similar large discrepancies were observed in Rinput measurements made with patch vs. sharp electrodes (Spruston and Johnston 1992). Collectively, incorporating multiple experimental metadata factors accounted for considerably more measurement variability than neuron type alone (Fig. 2B; details in materials and methods). Importantly, these regression models provide quantitative relationships that can be used as “correction factors” to adjust or normalize each electrophysiological measurement for multivariate differences in recording practices across studies (Fig. 2, A and H). Such adjustments are conceptually analogous to “Q10” correction factors, often used to systematically correct for temperature-dependent kinetic reaction rates, for example, in ion channel gating (Hille 2001).
As a caveat, we note that there still remained a considerable amount of unexplained variance in electrophysiological measurements, even after metadata adjustment. This variance likely reflects the following: 1) within-type neuronal variability (Druckmann et al. 2012; Padmanabhan and Urban 2010; Tripathy et al. 2013); 2) additional experimental conditions not yet considered, like recording solution contents or overall preparation and recording quality; and 3) subtle differences in how investigators define electrophysiological properties (e.g., see appendix and discussion).
Experimental Validation of NeuroElectro Data Before and After Metadata Normalization
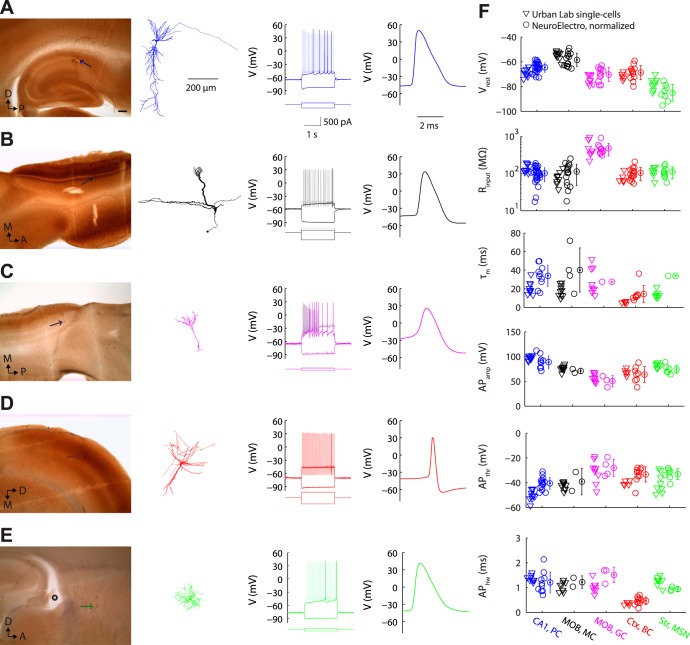
To directly validate NeuroElectro dataset measurements and our metadata normalization procedure, we recorded from a subset of commonly studied neuron types, including CA1 pyramidal cells, main olfactory bulb mitral cells and granule cells, neocortical basket cells, and striatal medium spiny neurons (Fig. 3, A–F, and appendix). Critically, to compare our de novo recordings to NeuroElectro, we needed to first statistically normalize the NeuroElectro measurements to the experimental conditions used in our laboratory, namely, our use of whole cell patch-clamp recordings near physiological temperatures in acute slices from young-adult mice.
Comparing our single cell biophysical measurements to NeuroElectro, we found close agreement to the global mean and variance defining each NeuroElectro neuron type following metadata adjustment (Fig. 3, E and F). To quantify this agreement, we used a confusion matrix analysis to classify each recorded cell to the corresponding most similar NeuroElectro neuron type. Experimentally recorded neurons were almost always correctly matched to the corresponding NeuroElectro neuron type after metadata normalization (81% of cells; 34 of 42 neurons; chance = 20%; Fig. 3H) but matched considerably less well when using the raw unnormalized NeuroElectro values (48% of cells; 20 of 42 neurons; Fig. 3G).
We thus conclude that the electrophysiological data and metadata populating NeuroElectro are sufficiently accurate and that individual laboratories can reasonably expect their own recordings to match NeuroElectro after adjusting for differences in experimental conditions. Moreover, this analysis underscores that 1) single neurons, even of the same canonical type, are biophysically heterogeneous (Padmanabhan and Urban 2010); and 2) incorrectly matched neurons may provide clues to functional similarities across different neuron types.
Investigating Brain-Wide Correlations Among Biophysical Properties
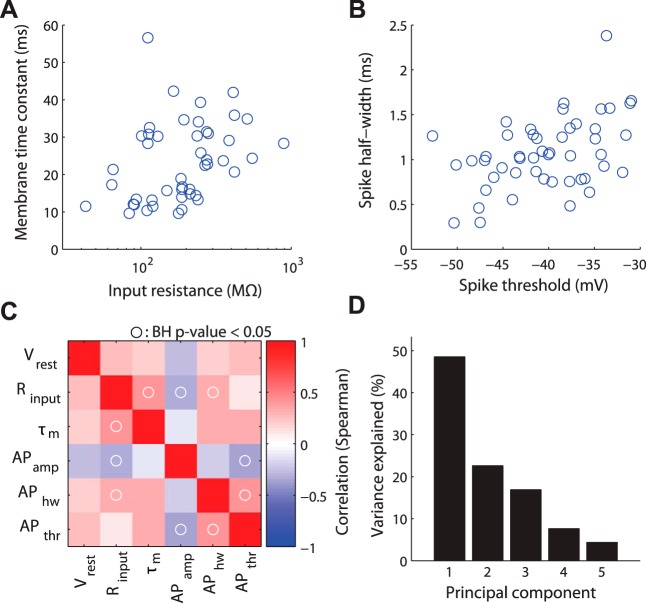
We next performed a series of analyses on our normalized brain-wide electrophysiology dataset with the goal of learning relationships between biophysical properties and diverse neuron types. To further help reduce the influence of unaccounted-for measurement and methodological variability, we first summarized electrophysiological data at the neuron type level by pooling measurements across articles. Correlating measurements of biophysical properties across neuron types, we observed a number of significant correlations (examples in Fig. 4, A and B; summary in C and appendix), including correlations expected a priori, such as a positive correlation between Rinput and τm. We also observed biophysical correlations more difficult to explain via first principles of neural biophysics, such as anticorrelation between Rinput and APamp and correlation between APthr and APhw.
Fig. 4.
Exploring correlations between biophysical properties. A and B: example data showing pairwise correlations among biophysical properties. Each data point corresponds to measurements from a single neuron type (after averaging observations collected across multiple studies and adjusting for experimental condition differences). C: correlation matrix of biophysical properties (Spearman's correlation). Circles indicate where correlation of biophysical properties was statistically significant (P < 0.05 after Benjamini-Hochberg false discovery rate correction). D: variance explained across probabilistic principal components of electrophysiological correlation matrix in C.
These correlations led us to use dimensionality reduction techniques to determine if this six parameter description of neuronal diversity could be further simplified. PCA (using pPCA to help account for unobserved or “missing” biophysical measurements not present in the database) showed that 50% of the variance across neuron types could be explained by a single component that largely reflects neuronal size (Fig. 4D). An additional 22% can be explained by the second PC, which roughly reflects basal firing rates and excitability. This analysis is unique through its focus on brain-wide neuronal diversity; moreover, such relationships may differ from previous correlations based on within neuron type variability (Druckmann et al. 2012; Padmanabhan and Urban 2010).
Biophysical Similarity Identifies Approximately Six to Nine Superclasses of Neuron Types
Lastly, we used NeuroElectro to gain insights into unknown biophysical similarities among diverse neuron types, with the goal of uncovering shared homology of function between different neurons. For example, fast-spiking basket cells populate multiple brain regions yet play similar functional roles within their larger neural circuits (Markram et al. 2004; Martina et al. 1998). Our goal was to use the normalized electrophysiological features to identify additional sets of biophysically similar neuron types that may also share computational functions.
We performed a hierarchical clustering analysis of the neuron types using the metadata-normalized NeuroElectro dataset. Specifically, for each pair of neuron types, we assessed their similarity by comparing the set of six basic biophysical properties defined above. Here, we chose to be agnostic about the relative importance of each biophysical property and weighted them by their relative measurement uncertainty (defined in Fig. 2C). We further mitigated unaccounted-for measurement and methodological variability by focusing on neuron types reported within at least three articles.
Several previously described classes of neuron types emerged from this analysis, validating our unbiased clustering approach (Fig. 5). For example, neocortical and hippocampal basket cells were closely clustered, as were GABAergic medium spiny neurons of both dorsal and ventral striatum. Likewise, we observed distinct clusters of both excitatory neocortical and nonneocortical projection neuron types, differing with respect to their Vrest. Furthermore, metadata normalization was critical, as performing the analysis using the unnormalized dataset gave paradoxical results; for example, that CA1 basket cells were more similar to thalamic relay cells than to cortical basket cells (see appendix).
Novel superclasses of neuron types also emerged from our clustering analysis. Foremost, we observed a cluster containing main olfactory bulb Blanes and external tufted cells, dentate gyrus hilar cells, and neocortical Martinotti cells that were defined by a depolarized Vrest and relatively hyperpolarized APthr. This is the first report identifying the shared electrophysiological similarity of these neuron types. Intriguingly, each of these neuron types exhibits low-threshold and persistent spiking activity at theta-band frequencies (Gentet et al. 2012; Hayar et al. 2004; Larimer and Strowbridge 2010; Pressler and Strowbridge 2006) and thus may share the computational function of driving or triggering recurrent network theta rhythms. Similarly, we observed a large cluster of high Rinput, broad spiking cells from the midbrain and brainstem, including the ventral tegmental area and locus coeruleus. Although markedly diverse in their combined neurotransmitter phenotype, many of these neuron types nevertheless exhibit similar activity patterns comprised of spontaneous “pacemaker”-like tonic firing (Stern 2001; Tateno and Robinson 2011), a behavior attributable to their distinctively depolarized Vrest.
Across the entire dataset, the major divisions among neuron types tended to be in terms of apparent neuron size (e.g., variance in Rinput) and basal excitability (e.g., the relative difference between Vrest and APthr). Additionally, we observed a qualitative correspondence between biophysical similarity and gross anatomical position, suggesting that shared precursor lineage may yield similar biophysical properties (Ohtsuki et al. 2012). While this initial analysis is focused only on simple biophysical properties, the observed “superclasses” are encouraging because they appear to also reflect gestalt spike pattern phenotypes, such as pacemaker or low-threshold firing behaviors. In the future, incorporating additional parameters such as spike afterhyperpolarization amplitudes or ionic currents will likely further refine these superclasses and better define their computational roles (Migliore and Shepherd 2005; Toledo-Rodriguez et al. 2004).
DISCUSSION
Here, we have developed a general approach for reconciling long-standing methodological inconsistencies that have made brain-wide meta-analyses of electrophysiological data exceedingly difficult. Using semiautomated text-mining (Tripathy et al. 2014), we were able to accurately compile considerable amounts of neuronal biophysical data from the vast research literature. In our initial analyses of the extracted data within NeuroElectro, we found that the raw biophysical data values pertaining to the same neuron type were immensely variable across studies. However, the size of this unprecedented collection of electrophysiological data enabled us to explicitly quantify the relationships between experimental conditions and biophysical properties. With these statistical models, we could systematically normalize methodologically-inconsistent data to account for basic differences in experimental protocols thereby revealing the actual features of neuron types.
Following methodological normalization, we obtained, for the first time, a unified reference dataset of neuronal biophysics amenable to brain-wide electrophysiological comparisons. Such metadata normalization was critical for comparing our de novo single cell recordings to NeuroElectro data from other neuron types. Our subsequent meta-analyses uncovered novel electrophysiological correlations and several biophysically based neuronal superclasses predicted to exhibit similar functionality. For example, we identify a new superclass containing hippocampal, neocortical, and olfactory bulb interneurons capable of persistent theta frequency activity–an emergent behavior attributable, in part, to a uniquely depolarized Vrest and hyperpolarized APthr. While such clustering analyses are limited by the somewhat low resolution data currently available, our approach is easily extensible to novel datasets, including from raw electrophysiological traces or additional data modalities like gene expression (Lein et al. 2007; McCarroll et al. 2014) or morphology (Ascoli et al. 2007).
Electrophysiological Standards Will Improve Future Meta-Analyses
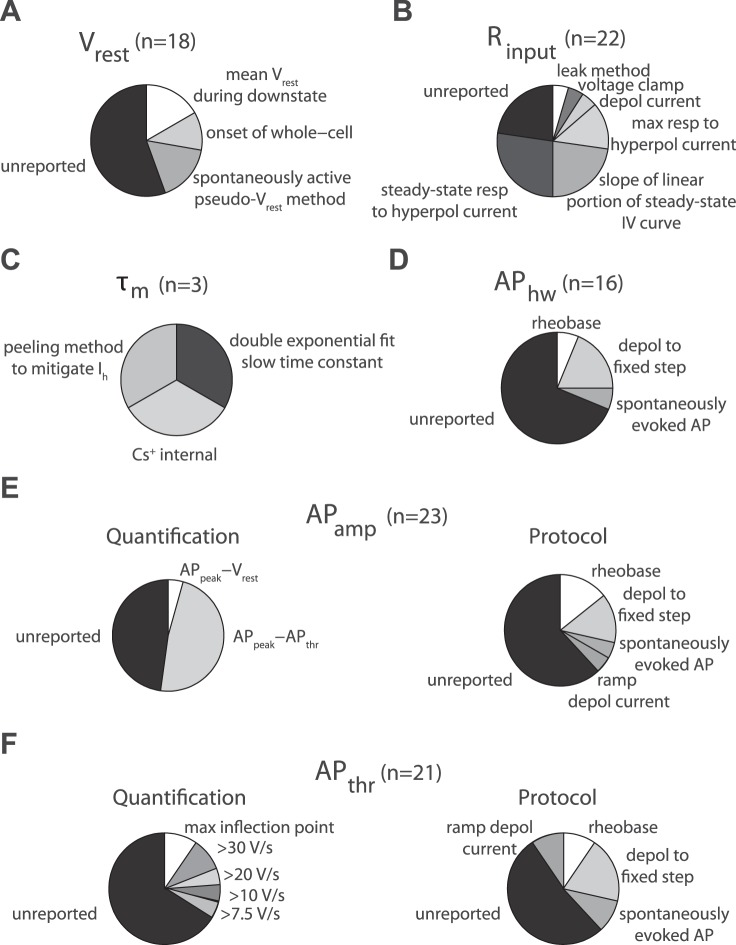
A major goal of our project was to rigorously identify the sources of variance that limit the comparison of cross-study electrophysiological data. However, a difficulty that we regularly encountered came from the lack of formal standards used in reporting electrophysiological data. For example, during the NeuroElectro database QC audit, we observed at least six different definitions for calculating Rinput (see appendix). Rigorously accounting for such inconsistent definitions was further hindered by frequently insufficient methodological details describing how each property was defined and calculated (i.e., only ∼60% of electrophysiological measurements were described with adequate detail to enable independent remeasurement). Thus, to the extent that inconsistent electrophysiological definitions yield systematically different measurements, naively pooling across studies (as we have done here) will continue to be a source of unexplained variance until more complete reporting standards are adopted.
Similarly, our approach requires mapping each extracted datum to a canonical neuron type. Since investigators use different terminologies to refer to neuron types (Ascoli et al. 2008), we used the community-generated expert-defined list of neuron types provided by NeuroLex (Hamilton et al. 2012; Larson and Martone 2013; Shepherd 2003). This choice saves us from the challenging task of redefining the canonical list of neuron types, but at present these definitions currently “lump” rather than “split” neuron types (e.g., “neocortex layer 5–6 pyramidal neuron”). While this lumping will also add unexplained variance to neuron type biophysical measurements, we have built the mapping of data to neuron type in NeuroElectro to be highly flexible, allowing NeuroElectro to similarly evolve to match updates in neuron type definitions.
Based on our experiences, we strongly recommend the usage of common definitions for basic biophysical measurements (Toledo-Rodriguez et al. 2004) and neuron types (Ascoli et al. 2008; Larson and Martone 2013). We also ask that experimentalists report more basic electrophysiological information within articles and, if possible, publish such data using machine-readable formats like data tables. Similarly, relevant experimental details should be clearly stated within methods sections (Vasilevsky et al. 2013) (e.g., liquid junction potential correction and recording quality criteria). In contrast to mandating that investigators standardize experimental protocols (e.g., using the same mouse line or electrode pipette solution), these shifts in data reporting practices we propose are simple, requiring minimal changes to current workflows. Implementing these basic recommendations will facilitate further data compilation efforts and the ultimate development of a comprehensive “parts list” of the brain (Insel et al. 2013).
Meta-Analysis as a Remedy for the Reproducibility Crisis in Neuroscience
Biomedical science is perceived to be undergoing a “reproducibility crisis” (Collins and Tabak 2014; Vasilevsky et al. 2013), where up to half of published findings may be false (Ioannidis 2005). In neurophysiology, such irreproducibility has been used to justify efforts by large single institutes to standardize the recollection of large amounts of data in the absence of an overarching question or hypothesis (Frégnac and Laurent 2014; Kandel et al. 2013; Markram 2006).
We feel that our integrative meta-analysis approach offers a potential alternative solution. Specifically, by aggregating vast amounts of previously collected quantitive data and tagging these with appropriate experimental metadata, the metadata can help resolve systematic discrepancies between data values. Thus, as opposed to the standard practice of only utilizing data from a single study or laboratory, this “wisdom of the crowds” approach explicitly links together the work of a wide community of investigators. Neuropsychiatric genetics provides an excellent example, where investigators have identified greater numbers of genetic loci conferring significant disease risk by pooling subject data across sites and consortia (McCarroll et al. 2014). While such quantitative meta-analyses are in their infancy in cellular and systems neuroscience (Akil et al. 2011; Ferguson et al. 2014), we feel that this approach increases the reach and impact of any one publication and has the potential to greatly increase the rate of progress in our field.
GRANTS
This work was supported by a National Science Foundation Graduate Fellowship (to S. J. Tripathy); National Institute of Deafness and Other Communications Disorders Grants F31-DC-013490 (to S. D. Burton), F32-DC-010535 (to R. C. Gerkin), and R01-DC-005798 (to N. N. Urban), and National Institute of Mental Health Grant R01-MH-081905 (to R. C. Gerkin). This research was funded in part by a grant from the Pennsylvania Department of Health's Commonwealth Universal Research Enhancement Program.
DISCLOSURES
No conflicts of interest, financial or otherwise, are declared by the author(s).
AUTHOR CONTRIBUTIONS
Author contributions: S.J.T., S.D.B., R.C.G., and N.N.U. conception and design of research; S.J.T., S.D.B., M.G., and R.C.G. analyzed data; S.J.T., S.D.B., M.G., R.C.G., and N.N.U. interpreted results of experiments; S.J.T. and S.D.B. prepared figures; S.J.T., S.D.B., R.C.G., and N.N.U. drafted manuscript; S.J.T., S.D.B., M.G., R.C.G., and N.N.U. edited and revised manuscript; S.J.T., S.D.B., M.G., R.C.G., and N.N.U. approved final version of manuscript; S.D.B. and M.G. performed experiments.
ACKNOWLEDGMENTS
We thank R. Kass, A.-M. Oswald, A. Gittis, A. Barth, E. Fanselow, and P. Pavlidis for helpful discussions and comments on the manuscript. We additionally thank A. Gittis for guidance on targeted neocortical basket cell recordings; G. LaRocca for technical support; and D. Tebaykin for NeuroElectro web-development assistance. We are especially grateful to all of the investigators whose collected data are represented within the NeuroElectro database.
Present address of S. J. Tripathy: Centre for High-Throughput Biology, Univ. of British Columbia, Vancouver, BC V6K 2Z7, Canada (e-mail: stripat3@gmail.com).
Appendix
Figures A1 and A2 provide contextual data for the NeuroElectro database, including the electrophysiological property standardization and variability of experimental methodologies. Figures A3 and A4 include specific data collected during the quality control audit on the variability of recording solutions used (Fig. A3) and inconsistencies among definitions used for common electrophysiological properties (Fig. A4). Figure A5 shows a more detailed analysis for validating the NeuroElectro database measurements against novel recorded data. Figure A6 depicted an expanded analysis of correlations between electrophysiological parameters. Figure A7 shows an analysis of hierarchical clustering of neuron types on the basis of biophysical similarity without first normalizing electrophysiological data for experimental condition differences. Figure A8 shows how the efficacy of the metadata prediction models varies as a function of the total NeuroElectro dataset size.
Fig. A1.
Distribution of neuron types and electrophysiological properties represented in NeuroElectro and illustration of electrophysiological property standardization. A: frequency histogram of distribution of neuron types vs. number of articles containing information about each neuron type. B: count of unique measurements of the 6 electrophysiological properties explored in this article. C and D: illustration of manual electrophysiological property standardization for NeuroElectro measurements extracted from literature. Example afterhyperpolarization (AHP) amplitude measurements before (C) and after standardization (D) to a common calculation definition. Neurons plotted are cerebellar Purkinje cells, CA1 pyramidal cells, cortical basket cells, ventral tegmental area dopaminergic cells, and striatal medium spiny neurons (abbreviated as Purk; CA1, pyr; Ctx, bskt; VTA, DA; and Str, MSN; respectively). Each circle denotes the value of the mean electrophysiological measurement reported within an article.
Fig. A2.
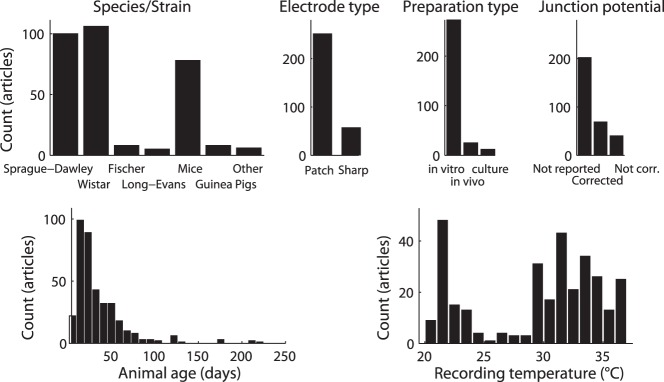
Histograms of methodological variability in neurophysiology literature reflected within the NeuroElectro database.
Fig. A3.
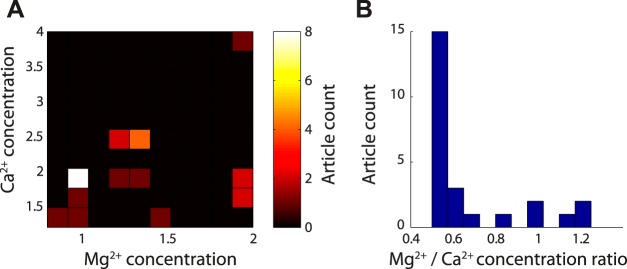
Quantification of Mg2+ and Ca2+ recording solution concentrations among articles in quality control subset. A: 2-dimensional histogram of Mg2+ and Ca2+ recording solution concentrations, reported in mM. The most commonly reported concentration pair is 1 mM Mg2+ and 2 mM Ca2+. B: same as A, but reported as ratio of Mg2+ and Ca2+ concentration; n = 27 articles quantified; 2 articles not shown since in vivo recording conditions were used and no external recording solution was reported.
Fig. A4.
Compilation of different overall methods for calculating electrophysiological properties from the sample of curated articles in the quality control (QC) audit. A–F: pie charts and labels indicate breakdown of electrophysiological calculation methodology and n indicates number of property measurements found in sample. Label “unreported” indicates that no specific methodological description could be found; n = 27 articles quantified in QC subset. A: resting membrane potential (Vrest), label “spontaneously active pseudo-Vrest method” indicates methodology for quantifying Vrest in spontaneously active neurons. B: input resistance (Rinput), label “leak method” indicates method for calculating Rinput based on leak current. C: membrane time constant (τm), label “peeling method to mitigate Ih” indicates method calculating τm that corrects for sag current influence, label “Cs+” indicates the use of cesium ions in the electrode pipette solution. D: action potential half-width (APhw). Labels indicate different protocols for eliciting spikes from which APhw is calculated. By definition, all APhw measurements have been quantified as AP full-width at half-maximal amplitude, usually from the first evoked AP in train. E: action potential amplitude (APamp). Pie charts indicate methodology for quantifying APamp (left) or protocol used to elicit action potentials (right). Quantification labels indicate whether APamp is defined as the difference between AP threshold and peak or Vrest and AP peak. F: action potential threshold (APthr), label “max inflection point” indicates identification of action potential threshold via 2nd derivative of voltage.
Fig. A5.
Validation of NeuroElectro database measurements with collection of raw data. A: representative targeted recording of a hippocampal CA1 pyramidal cell (“CA1, PC”), showing anatomical position and morphological reconstruction (left), response to hyperpolarizing and depolarizing rheobase and suprathreshold step current injections (middle), and action potential waveform (right). Anatomical scale bar = 200 μm. B–D: same as A for main olfactory bulb mitral cell (B; “MOB, MC”), main olfactory bulb granule cell (C; “MOB, GC”), neocortical basket cell (D; “Ctx, BC”), and striatal medium spiny neuron (E; “Str, MSN”). F: summary of targeted in vitro recordings and comparison to text-mined, metadata-adjusted values from NeuroElectro. D, dorsal; P, posterior; M, medial; A, anterior. Morphological reconstructions (except the representative granule cell) have been moderately thickened to aid visualization of thinner processes.
Fig. A6.
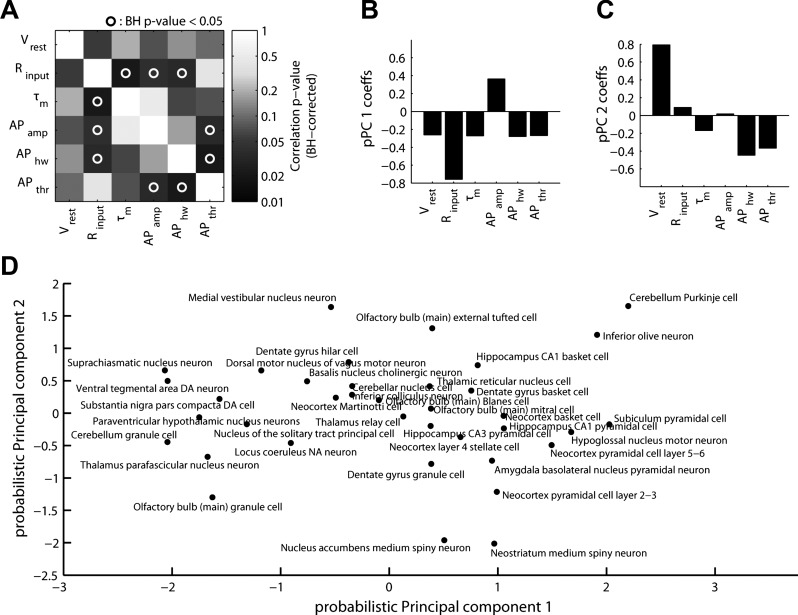
Expanded analysis of correlations among electrophysiological properties. A: Benjamini-Hochberg adjusted P values for pairwise electrophysiological property correlation matrix shown in Fig. 4. B and C: coefficients corresponding to the first (B) and second (C) probabilistic principal component (pPC). D: projection of neuron types onto space defined by first and second pPCs. Note that the first pPC qualitatively reflects the axis of electrotonically small (left) vs. large (right) neuron types, while the second pPC qualitatively reflects the axis of basal excitability of neuron types, separating hyperpolarized (bottom) from depolarized (top) resting membrane potentials.
Fig. A7.
Hierarchical clustering of neuron types, without first normalizing for differences in experimental metadata. Same as Fig. 5, but computed for biophysical data without first adjusting for differences in experimental conditions. Neuron types sorted in order of biophysical similarity (similarity indicated by levels of dendrogram; dendrogram linkages computed using Ward's method and Euclidean distances). Heatmap values indicate observed neuron type-specific electrophysiological measurements, and red (blue) values indicate large (small) values relative to mean across neuron types. Only neuron types with measurements defined by at least three articles and with at least 4 (of the 6 total) biophysical properties reported were used in this analysis. Probabalistic PCA was used to impute unobserved measurements, indicated via green dots on heatmap.
Fig. A8.
Influence of dataset size vs. predictive power of metadata for explaining electrophysiological measurement variability. Panels show different electrophysiological properties and lines show explanatory power of statistical model when using neuron type information only (black, solid line) or neuron type plus all metadata (grey, dashed line) as a function of randomly subsampling the original dataset to smaller sizes (on abscissa). Original dataset size indicated by subsample fraction = 1.0. Shaded lines indicate SD when resampling the dataset 25 times per subsampling size. Note that as dataset is subsampled to smaller sizes, explanatory power of the model that includes metadata is not greater than the model that includes neuron type information only.
Electrophysiological Database QC Assessment
To validate and QC the accuracy of our semiautomated data extraction methods, we conducted a systematic audit of a randomly chosen 10% of the algorithmically mined articles (n = 27 articles), which had curated electrophysiological data obtained from a structured data table within an article.
Specifically, four curators (two pairs of two curators, each working independently) were each tasked with validating the accuracy of concept identification, data extraction, and data standardization. The curators (S. J. Tripathy, S. D. Burton, M. Geramita, and R. C. Gerkin), each had extensive experience reading literature and designing and performing electrophysiology experiments. Curators were split into pairs of two curators each, where each member of each pair independently curated the same manuscripts, allowing an assessment of intercurator consistency.
Below are listed the explicit instructions provided to each curator during the 10% article QC audit to independently validate the accuracy of the NeuroElectro database.
1) Assess whether each neuron type mentioned within a HTML data table had been mapped correctly (“yes,” “no,” or “ambiguous”), based on the provided listing of canonical neuron types and their definitions. “Ambiguous” responses and notations were used in cases where the neuron type was not included in the provided neuron type list.
2) Assess whether electrophysiological property concepts had been identified and mapped correctly (“yes,” “no,” or “ambiguous”). In addition, curators were asked to explicitly describe how each electrophysiological property had been calculated and evaluate whether the electrophysiological measurement could be in principle replicated based on the provided methodological details. For example, for APthr, if the article defined how threshold was computed (e.g., voltage derivative threshold criterion) but did not describe how spikes were evoked (e.g., rheobase current injection), then the APthr measurement was judged as nonreplicable. Curators were instructed to attempt to find such electrophysiological definitions if they were referenced within a previous article. Curators were not allowed to report “ambiguous” for evaluations of replicability.
3) Extract the electrophysiological data corresponding to each neuron type-electrophysiological property pair as it directly appears in the formatted data table. Following this extraction, standardize the data value to the common calculation methodology (e.g., measurements of input resistance reported in GΩ were standardized to MΩ).
4) Assess whether methodological metadata concepts were identified and mapped correctly. In addition, curators were asked to curate information for a small number of additional metadata concepts (extracellular Mg2+ and Ca2+ concentrations, slice thickness, etc.) as seed data for future metadata extraction algorithms.
To evaluate the outcome of the QC audit, we quantified agreement between curators and between curators and NeuroElectro using a simple percentage agreement measure. Concepts that were labeled as ambiguous by the curator were not considered in the quantification. Because we quantify NeuroElectro accuracy compared with the human curators, the intercurator agreement measure sets a rough upper bound on the potential maximum accuracy of NeuroElectro. Specifically, the aggregate intercurator consistency measure of 95% sets the upper bound of NeuroElectro accuracy at 97.5%.
QC results.
We found close agreement between the manually curated QC data and NeuroElectro, with 96% accuracy of the NeuroElectro database overall (specifically: 93% for neuron types, 99% for electrophysiological concepts, 96% for experimental conditions, and 95% for correctly extracted and standardized electrophysiological data). Intercurator agreement was also high, with 95% of concepts and data identified and extracted identically across each pair of two curators. Moreover, “mistakes” or miscurated entries within the NeuroElectro database usually represented cases where the underlying concept or data were truly ambiguous (e.g., a neuron type that did not explicitly exist within the NeuroLex list of neuron types).
Within the QC sample, we also analyzed how often authors use different definitions for similar electrophysiological properties and whether sufficient details were provided to independently replicate each measurement. Strikingly, we found that sufficient methodological details were provided to replicate only 42% of reported electrophysiological measurements. While this measure of replicability is inherently subjective and dependent on electrophysiological experience (yielding an intercurator agreement of only 65%), our results nevertheless parallel other aggregate measures of methodological rigor, such as antibody reporting (Vasilevsky et al. 2013).
Description of Dendrogram Bootstrap Resampling
We used multiscale bootstrap resampling to assess the statistical significance of subtrees of D using the pvclust package in the language R (Suzuki and Shimodaira 2006). The pvclust dendrogram multiscale bootstrap resampling algorithm proceeds as follows: specifically, given an n × p data matrix M (here, n refers to neuron types and p refers to the 6 electrophysiological properties), pvclust first generates a number of bootstrapped versions of M through randomly sampling columns from M with replacement (10,000 bootstrap samples were used). For each bootstrapped data matrix, Mi, a dendrogram Di was generated through hierarchical clustering. Next, for each subtree in the original dendrogram D, the analysis assesses how often the same subtree appears across the bootstrapped dendrograms D1:10,000. Here, subtree equality is defined by subtrees that share identical tree topology and neuron membership but does not assess equality of branch lengths. Lastly, because the bootstrap probability is known to be a downwardly biased measure for determining subtree probability (Felsenstein 2004), pvclust corrects for this downward bias by performing the entire bootstrap procedure multiple times at a number of scales by resampling M to have differing numbers of columns (here, we use 3 through 9 columns in M). This allows for the bootstrap probability to be corrected, yielding the approximately unbiased P value for each subtree.
REFERENCES
- Akil H, Martone ME, Van Essen DC. Challenges and opportunities in mining neuroscience data. Science 331: 708–712, 2011. [DOI] [PMC free article] [PubMed] [Google Scholar]
- Altschul SF, Gish W, Miller W, Myers EW, Lipman DJ. Basic local alignment search tool. J Mol Biol 215: 403–410, 1990. [DOI] [PubMed] [Google Scholar]
- Ambert KH, Cohen AM. Text-mining and neuroscience. Int Rev Neurobiol 103: 109–132, 2012. [DOI] [PubMed] [Google Scholar]
- Ascoli GA, Alonso-Nanclares L, Anderson SA, Barrionuevo G, Benavides-Piccione R, Burkhalter A, Buzsaki G, Cauli B, DeFelipe J, Fairen A, Feldmeyer D, Fishell G, Fregnac Y, Freund TF, Gardner D, Gardner EP, Goldberg JH, Helmstaedter M, Hestrin S, Karube F, Kisvarday ZF, Lambolez B, Lewis DA, Marin O, Markram H, Munoz A, Packer A, Petersen CC, Rockland KS, Rossier J, Rudy B, Somogyi P, Staiger JF, Tamas G, Thomson AM, Toledo-Rodriguez M, Wang Y, West DC, Yuste R. Petilla terminology: nomenclature of features of GABAergic interneurons of the cerebral cortex. Nat Rev Neurosci 9: 557–568, 2008. [DOI] [PMC free article] [PubMed] [Google Scholar]
- Ascoli GA, Donohue DE, Halavi M. NeuroMorpho.Org: a central resource for neuronal morphologies. J Neurosci 27: 9247–9251, 2007. [DOI] [PMC free article] [PubMed] [Google Scholar]
- Benson DA, Cavanaugh M, Clark K, Karsch-Mizrachi I, Lipman DJ, Ostell J, Sayers EW. GenBank. Nucleic Acids Res 41: D36–42, 2013. [DOI] [PMC free article] [PubMed] [Google Scholar]
- Burton SD, Urban NN. Greater excitability and firing irregularity of tufted cells underlies distinct afferent-evoked activity of olfactory bulb mitral and tufted cells. J Physiol 592: 2097–2118, 2014. [DOI] [PMC free article] [PubMed] [Google Scholar]
- Carlson GC, Shipley MT, Keller A. Long-lasting depolarizations in mitral cells of the rat olfactory bulb. J Neurosci 20: 2011–2021, 2000. [DOI] [PMC free article] [PubMed] [Google Scholar]
- Collins FS, Tabak LA. Policy: NIH plans to enhance reproducibility. Nature 505: 612–613, 2014. [DOI] [PMC free article] [PubMed] [Google Scholar]
- Druckmann S, Hill S, Schürmann F, Markram H, Segev I. A hierarchical structure of cortical interneuron electrical diversity revealed by automated statistical analysis. Cereb Cortex 23: 2994–3006, 2013. [DOI] [PubMed] [Google Scholar]
- Felsenstein J, Inferring Phylogenies. Sunderland, MA: Sinauer Associates, 2004. [Google Scholar]
- Feng G, Mellor RH, Bernstein M, Keller-Peck C, Nguyen QT, Wallace M, Nerbonne JM, Lichtman JW, Sanes JR. Imaging neuronal subsets in transgenic mice expressing multiple spectral variants of GFP. Neuron 28: 41–51, 2000. [DOI] [PubMed] [Google Scholar]
- Ferguson AR, Nielson JL, Cragin MH, Bandrowski AE, Martone ME. Big data from small data: data-sharing in the “long tail” of neuroscience. Nat Neurosci 17: 1442–1447, 2014. [DOI] [PMC free article] [PubMed] [Google Scholar]
- French L, Lane S, Xu L, Pavlidis P. Automated recognition of brain region mentions in neuroscience literature. Front Neuroinform 3: 29, 2009. [DOI] [PMC free article] [PubMed] [Google Scholar]
- Frégnac Y, Laurent G. Neuroscience: where is the brain in the human brain project? Nature 513: 27–29, 2014. [DOI] [PubMed] [Google Scholar]
- Gentet LJ, Kremer Y, Taniguchi H, Huang ZJ, Staiger JF, Petersen CC. Unique functional properties of somatostatin-expressing GABAergic neurons in mouse barrel cortex. Nat Neurosci 15: 607–612, 2012. [DOI] [PubMed] [Google Scholar]
- Gertler TS, Chan CS, Surmeier DJ. Dichotomous anatomical properties of adult striatal medium spiny neurons. J Neurosci 28: 10814–10824, 2008. [DOI] [PMC free article] [PubMed] [Google Scholar]
- Hamilton DJ, Shepherd GM, Martone ME, Ascoli GA. An ontological approach to describing neurons and their relationships. Front Neuroinform 6: 15, 2012. [DOI] [PMC free article] [PubMed] [Google Scholar]
- Hayar A, Karnup S, Shipley MT, Ennis M. Olfactory bulb glomeruli: external tufted cells intrinsically burst at theta frequency and are entrained by patterned olfactory input. J Neurosci 24: 1190–1199, 2004. [DOI] [PMC free article] [PubMed] [Google Scholar]
- Hille B. Ion Channels of Excitable Membranes (3rd ed). Sunderland, MA: Sinauer Associates, 2001. [Google Scholar]
- Insel TR, Landis SC, Collins FS. The NIH BRAIN initiative. Science 340: 687–688, 2013. [DOI] [PMC free article] [PubMed] [Google Scholar]
- Ioannidis JP. Why most published research findings are false. PLoS Med 2: e124, 2005. [DOI] [PMC free article] [PubMed] [Google Scholar]
- Kandel ER, Markram H, Matthews PM, Yuste R, Koch C. Neuroscience thinks big (and collaboratively). Nat Rev Neurosci 14: 659–664, 2013. [DOI] [PubMed] [Google Scholar]
- Larimer P, Strowbridge BW. Representing information in cell assemblies: persistent activity mediated by semilunar granule cells. Nat Neurosci 13: 213–222, 2010. [DOI] [PMC free article] [PubMed] [Google Scholar]
- Larson SD, Martone ME. NeuroLex.org: an online framework for neuroscience knowledge. Front Neuroinform 7: 18, 2013. [DOI] [PMC free article] [PubMed] [Google Scholar]
- Lein ES, Hawrylycz MJ, Ao N, Ayres M, Bensinger A, Bernard A, Boe AF, Boguski MS, Brockway KS, Byrnes EJ, Chen L, Chen L, Chen TM, Chi Chin M, Chong J, Crook BE, Czaplinska A, Dang CN, Datta S, Dee NR, Desaki AL, Desta T, Diep E, Dolbeare TA, Donelan MJ, Dong HW, Dougherty JG, Duncan BJ, Ebbert AJ, Eichele G, Estin LK, Faber C, Facer BA, Fields R, Fischer SR, Fliss TP, Frensley C, Gates SN, Glattfelder KJ, Halverson KR, Hart MR, Hohmann JG, Howell MP, Jeung DP, Johnson RA, Karr PT, Kawal R, Kidney JM, Knapik RH, Kuan CL, Lake JH, Laramee AR, Larsen KD, Lau C, Lemon TA, Liang AJ, Liu Y, Luong LT, Michaels J, Morgan JJ, Morgan RJ, Mortrud MT, Mosqueda NF, Ng LL, Ng R, Orta GJ, Overly CC, Pak TH, Parry SE, Pathak SD, Pearson OC, Puchalski RB, Riley ZL, Rockett HR, Rowland SA, Royall JJ, Ruiz MJ, Sarno NR, Schaffnit K, Shapovalova NV, Sivisay T, Slaughterbeck CR, Smith SC, Smith KA, Smith BI, Sodt AJ, Stewart NN, Stumpf KR, Sunkin SM, Sutram M, Tam A, Teemer CD, Thaller C, Thompson CL, Varnam LR, Visel A, Whitlock RM, Wohnoutka PE, Wolkey CK, Wong VY, Wood M, Yaylaoglu MB, Young RC, Youngstrom BL, Feng Yuan X, Zhang B, Zwingman TA, Jones AR. Genome-wide atlas of gene expression in the adult mouse brain. Nature 445: 168–176, 2007. [DOI] [PubMed] [Google Scholar]
- Little RJ, Rubin DB. Statistical Analysis with Missing Data (2nd ed). New York: Wiley- Interscience, 2002. [Google Scholar]
- Madisen L, Zwingman TA, Sunkin SM, Oh SW, Zariwala HA, Gu H, Ng LL, Palmiter RD, Hawrylycz MJ, Jones AR, Lein ES, Zeng H. A robust and high-throughput cre reporting and characterization system for the whole mouse brain. Nat Neurosci 13: 133–140, 2010. [DOI] [PMC free article] [PubMed] [Google Scholar]
- Markram H. The blue brain project. Nat Rev Neurosci 7: 153–160, 2006. [DOI] [PubMed] [Google Scholar]
- Markram H, Toledo-Rodriguez M, Wang Y, Gupta A, Silberberg G, Wu C. Interneurons of the neocortical inhibitory system. Nat Rev Neurosci 5: 793- 807, 2004. [DOI] [PubMed] [Google Scholar]
- Martina M, Schultz JH, Ehmke H, Monyer H, Jonas P. Functional and molecular differences between voltage-gated K+ channels of fast-spiking interneurons and pyramidal neurons of rat hippocampus. J Neurosci 18: 8111–8125, 1998. [DOI] [PMC free article] [PubMed] [Google Scholar]
- McCarroll SA, Feng G, Hyman SE. Genome-scale neurogenetics: methodology and meaning. Nat Neurosci 17: 756–763, 2014. [DOI] [PMC free article] [PubMed] [Google Scholar]
- Migliore M, Shepherd GM. Opinion: an integrated approach to classifying neuronal phenotypes. Nat Rev Neurosci 6: 810–818, 2005. [DOI] [PubMed] [Google Scholar]
- Ohtsuki G, Nishiyama M, Yoshida T, Murakami T, Histed M, Lois C, Ohki K. Similarity of visual selectivity among clonally related neurons in visual cortex. Neuron 75: 65–72, 2012. [DOI] [PubMed] [Google Scholar]
- Okaty BW, Miller MN, Sugino K, Hempel CM, Nelson SB. Transcriptional and electrophysiological maturation of neocortical fast-spiking GABAergic interneurons. J Neurosci 29: 7040–7052, 2009. [DOI] [PMC free article] [PubMed] [Google Scholar]
- Padmanabhan K, Urban NN. Intrinsic biophysical diversity decorrelates neuronal firing while increasing information content. Nat Neurosci 13: 1276–1282, 2010. [DOI] [PMC free article] [PubMed] [Google Scholar]
- Potter SM, Zheng C, Koos DS, Feinstein P, Fraser SE, Mombaerts P. Structure and emergence of specific olfactory glomeruli in the mouse. J Neurosci 21: 9713–9723, 2001. [DOI] [PMC free article] [PubMed] [Google Scholar]
- Pressler RT, Strowbridge BW. Blanes cells mediate persistent feedforward inhibition onto granule cells in the olfactory bulb. Neuron 49: 889–904, 2006. [DOI] [PubMed] [Google Scholar]
- Shepherd GM (Editor). The Synaptic Organization of the Brain (5th ed). New York: Oxford Univ. Press, 2003. [Google Scholar]
- Spruston N, Johnston D. Perforated patch-clamp analysis of the passive membrane properties of three classes of hippocampal neurons. J Neurophysiol 67: 508–529, 1992. [DOI] [PubMed] [Google Scholar]
- Stern JE. Electrophysiological and morphological properties of pre-autonomic neurones in the rat hypothalamic paraventricular nucleus. J Physiol 537: 161–177, 2001. [DOI] [PMC free article] [PubMed] [Google Scholar]
- Suzuki R, Shimodaira H. Pvclust: an R package for assessing the uncertainty in hierarchical clustering. Bioinformatics 22: 1540–1542, 2006. [DOI] [PubMed] [Google Scholar]
- Tateno T, Robinson HP. The mechanism of ethanol action on midbrain dopaminergic neuron firing: a dynamic-clamp study of the role of I(h) and GABAergic synaptic integration. J Neurophysiol 106: 1901–1922, 2011. [DOI] [PubMed] [Google Scholar]
- Toledo-Rodriguez M, Blumenfeld B, Wu C, Luo J, Attali B, Goodman P, Markram H. Correlation maps allow neuronal electrical properties to be predicted from single-cell gene expression profiles in rat neocortex. Cereb Cortex 14: 1310–1327, 2004. [DOI] [PubMed] [Google Scholar]
- Tripathy SJ, Padmanabhan K, Gerkin RC, Urban NN. Intermediate intrinsic diversity enhances neural population coding. Proc Natl Acad Sci USA 110: 8248–8253, 2013. [DOI] [PMC free article] [PubMed] [Google Scholar]
- Tripathy SJ, Savitskaya J, Burton SD, Urban NN, Gerkin RC. NeuroElectro: a window to the world's neuron electrophysiology data. Front Neuroinform 8: 40, 2014. [DOI] [PMC free article] [PubMed] [Google Scholar]
- Vasilevsky NA, Brush MH, Paddock H, Ponting L, Tripathy SJ, LaRocca GM, Haendel MA. On the reproducibility of science: unique identification of research resources in the biomedical literature. PeerJ 1: e148, 2013. [DOI] [PMC free article] [PubMed] [Google Scholar]
- Yarkoni T, Poldrack RA, Nichols TE, Van Essen DC, Wager TD. Large-scale automated synthesis of human functional neuroimaging data. Nat Methods 8: 665–670, 2011. [DOI] [PMC free article] [PubMed] [Google Scholar]
- Zhu JJ. Maturation of layer 5 neocortical pyramidal neurons: amplifying salient layer 1 and layer 4 inputs by Ca2+ action potentials in adult rat tuft dendrites. J Physiol 526: 571–587, 2000. [DOI] [PMC free article] [PubMed] [Google Scholar]
Associated Data
This section collects any data citations, data availability statements, or supplementary materials included in this article.
Data Availability Statement
The NeuroElectro dataset and spreadsheets listing mined publications, neuron types, and electrophysiological properties are provided at http://neuroelectro.org/static/src/ad_paper_supp_material.zip. The analysis code used here is available at http://github.com/neuroelectro.


