

Abstract
Objectives. We investigated Black–White differences in the association between average alcohol drinking patterns and all-cause mortality.
Methods. We pooled nationally representative samples of 152 180 adults in the National Health Interview Survey from 1997 to 2002 with mortality follow-up through 2006. Usual drinking days per week and level of alcohol consumed per day were based on self-report. We used race- and gender-specific Cox proportional hazards regression analyses to adjust for physical activity, smoking status, and other potential confounders.
Results. Over 9 years, 13 366 deaths occurred from all causes. For men, the lowest multivariable-adjusted hazard ratio (HR) for total mortality among drinkers was 0.81 among White men who consumed 1 to 2 drinks 3 to 7 days per week (compared with abstainers) and Black men who abstained. For women, the lowest mortality risk was among White women (HR = 0.71) consuming 1 drink per day 3 to 7 days per week and Black women (HR = 0.72) consuming 1 drink on 2 or fewer days per week.
Conclusions. Risks and benefits of alcohol consumption in relation to mortality risk were dependent on race- and gender-specific drinking patterns.
Alcohol consumption is associated with both harmful and beneficial health effects. For instance, alcohol intake at or above moderation is associated with increased breast cancer risk, liver disease, violence, drowning, and injuries from falls and motor vehicle crashes.1 However, at moderate levels of consumption, alcohol is associated with a lower risk of type 2 diabetes and coronary heart disease2 and with survival benefits among middle-aged and older adults.3 Consuming alcohol in moderation may also help maintain cognitive function during the aging process.4 Potential biological mechanisms by which moderate alcohol consumption may be beneficial to certain health outcomes such as coronary heart disease are thought to be through the direct effects of ethanol, which may increase high-density lipoprotein cholesterol in addition to being antiatherogenic, anti-inflammatory, antithrombotic, and an insulin-sensitizing agent.5–9
Previous research has been conducted largely among US Whites or European populations, and whether alcohol in moderation yields comparable health and survival benefits among Blacks is unclear. Few previous studies have included a sufficient number of Black participants,10–16 which may have contributed to the lack of power to investigate interactions of race with the alcohol–mortality or cardiovascular disease relationship. A prospective study of all-cause mortality using data from the first National Health and Nutrition Examination Survey did not find evidence of an inverse association among Blacks,14 whereas a separate analysis in the same sample found a benefit for Whites.17 An analysis of coronary heart disease incidence in the Atherosclerosis Risk in Communities Study also found a differential association by race among men, with a positive relationship between average alcohol intake and coronary heart disease risk for Blacks and an inverse relation for Whites.10 Kerr et al.18 found an inverse association for moderate alcohol consumption compared with lifetime abstainers only among Whites in the 1984 and 1995 National Alcohol Surveys. Last, in a prospective analysis of cardiovascular mortality using data from the National Health Interview Survey (NHIS), Mukamal et al.13 reported significantly lower risk among light and moderate drinkers compared with abstainers among non-Hispanic Whites, but no significant benefit among the combined racial/ethnic minority populations.
Although most studies have been conducted among Europeans or White Americans, some data have suggested that Blacks (men, in particular) do not experience the apparent cardioprotective effect of alcohol.10,12,14,16 For instance, Fuchs et al.11 found that low to moderate alcohol consumption increased risk of hypertension among 512 Black men in the CARDIA study. Polymorphisms in the gene that encodes one of the alcohol dehydrogenase isoforms (ADH1B) appear to confer different rates of ethanol metabolism and have a substantially different genotype distribution between Blacks and Whites.19,20 Previous studies have found the alcohol-metabolizing ADH1B*3 functional polymorphism—found almost exclusively in populations with African ancestry and with a frequency of up to 33% —to be associated with a 70 to 80 times higher conversion rate of ethanol to acetaldehyde, reduced alcohol dependence, lower fetal alcohol syndrome rates, and increased liver cirrhosis risk.20–24 However, Blacks are more likely to have health conditions (e.g., hypertension, type 2 diabetes, chronic kidney disease) that are exacerbated by heavy or episodic alcohol drinking.25–27 The social and physical environmental contexts for drinking also influence patterns of drinking (e.g., bingeing) and the types of alcohol consumed, but context has been less studied in epidemiological studies of drinking and health across race.
Investigators have raised the question of whether the cardioprotective effect of alcohol is real or confounded by varying lifestyle characteristics between drinkers and nondrinkers whereby moderate drinkers may be more affluent and have health behaviors that would reduce their mortality risk regardless of moderate alcohol consumption.28,29 Moreover, the contrasting findings of previous research conducted mainly among White and Black men have also contributed to this concern. To address these issues, we investigated whether there were Black–White differences between both men and women from a large nationally representative survey in the relationship between alcohol consumption and all-cause mortality. We also explored differences in sociodemographic characteristics between Blacks and Whites to provide insights into the likelihood that social integration (the set of arrangements adopted by a society to accept new members) explains differences in apparent benefits. The extent to which moderate drinkers are more socially integrated than either abstainers or excessive drinkers may help explain whether moderate drinkers experience health benefits from alcohol consumption or whether they appear healthier because of indirect factors associated with being socially integrated, such as psychological and physical well-being enhanced through health behaviors (as one pathway) that affect health outcomes.
METHODS
We analyzed data from the NHIS, which is a series of cross-sectional, nationally representative surveys that uses a 3-stage stratified cluster probability sampling design to conduct in-person interviews in the households of noninstitutionalized US civilians. A detailed description of NHIS procedures has previously been published.30 Briefly, a probability sample of households was interviewed by trained interviewers from the US Census Bureau on a continuous basis each week to obtain information about the health and sociodemographic characteristics of each member of the sampled household. The data were collected using computer-assisted personal interviewing. A randomly selected adult and child (not included in this analysis) provided more specific health-related information. The final response rate for sample adults was 73.7% (survey year range = 71.1%–78.1%).
Study Participants
Participants included self-reported non-Hispanic White or non-Hispanic Black (hereinafter, White and Black) adults aged 18 years or older. Three percent of participants were excluded because they had missing data on alcohol consumption or mortality. Our final analytic sample consisted of 152 180 adults (25 811 Blacks and 126 369 Whites; Figure A, available as a supplement to the online version of this article at http://www.ajph.org).
Measures
All-cause mortality.
We identified deaths by linking the NHIS to the National Death Index and using International Classification of Diseases, 9th Revision codes.31 The National Death Index is a computer database of all deaths in the United States since 1979 with a high level of death ascertainment.32 The matching methodology used in linking NHIS and the National Death Index is a modification of probabilistic approaches and was performed by the National Center for Health Statistics.
This procedure identified 93% of deaths in 1988.33 Sensitivity varied by race and availability of information (e.g., social security number), with 97% sensitivity in Whites and 95% sensitivity in Blacks if a social security number was available. If it was unavailable, sensitivity was 93% for Whites and 84% for Blacks.33
Alcohol consumption.
All adults were asked about their lifetime alcohol consumption by responding to the following question: “In your entire life, have you had at least 12 drinks of any type of alcoholic beverage?” The standard-size drink is typically a 12-fluid-ounce bottle or can of beer, 8 to 9 fluid ounces of malt liquor, a 5-fluid-ounce glass of wine, and a 1.5-fluid-ounce shot of 80-proof spirits.34 Only participants who acknowledged drinking in the past year were further queried: “In the past year, on those days that you drank alcoholic beverages, on the average, how many drinks did you have?” Interviewers defined alcoholic beverages as including “liquor such as whiskey or gin, beer, wine, wine coolers, and any other type of alcoholic beverage.”
Participants were placed into the following mutually exclusive categories: (1) Never drinkers reported consuming fewer than 12 drinks during their lifetime; (2) former drinkers consumed at least 12 drinks in their lifetime, but none during the previous year; and (3) infrequent drinkers consumed at least 12 drinks in their lifetime but never 12 in a single year despite reporting alcohol consumption during the previous year. On the basis of the definition of moderate alcohol consumption of 1 to 2 drinks per day for men and 1 drink per day for women, the remaining participants were placed into the following separate categories: for men, (1) 1 to 2 drinks per day on 2 or fewer days per week, (2) 1 to 2 drinks per day on 3 to 7 days per week, (3) 3 or more drinks per day on 2 or fewer days per week, and (4) 3 or more drinks on 3 to 7 days per week; for women, (1) 1 drink per day on 2 or fewer days per week, (2) 1 drink per day on 3 to 7 days per week, (3) 2 or more drinks per day on 2 or fewer days per week, and (4) 2 or more drinks per day on 3 to 7 days per week.
Race/ethnicity.
Participants were asked, “What race or races do you consider yourself to be?” They then self-identified as 1 or more of the following categories: White, Black or African American, American Indian/Alaska Native, Asian, and multiple race.
Socioeconomic status.
Educational attainment was categorized as less than high school (no high school diploma), high school (high school or general equivalency diploma), some college, and at least a college-level education or more. We categorized participants as employed or not on the basis of employment status in the week before the interview, which was originally categorized as working for pay, job not at work (in the previous week), unemployed, or not in the labor force. Annual household income (with imputed values) was classified as $0–34 999, $35 000–74 999, and $75 000 or more, and poverty status was determined for the reported total family income compared with the US Census Bureau’s poverty thresholds for the survey year of interest.35 Visit with a doctor or health care professional in the 2 weeks before the interview was categorized as yes or no.
Health behaviors other than alcohol consumption.
Smoking status was categorized as current, former, or never. Leisure-time physical activity was categorized as none, low, or high. Participants engaging in at least some level of activity and providing a specific number of activity bouts were dichotomized at the midpoint of these bouts and classified as low or high. Participants reporting “never” or “unable to do this type of activity” were categorized as none.
Medical conditions.
Participants were asked whether they had ever been told by a doctor or other health professional that they had high blood pressure and, separately, whether they had diabetes/sugar diabetes or cancer. Participants were also asked whether a doctor or other health professional had ever diagnosed them as having coronary heart disease or any kind of heart condition or disease other than coronary heart disease, angina pectoris, or a myocardial infarction.
Social integration.
Although not formally assessed in the NHIS, we measured social integration with the following available variables: poverty, employment status, self-reported poor health, and educational attainment. We considered participants to not be socially integrated if they lived at or below the poverty level, were unemployed, reported fair or poor health, and had less than a high school education.
Covariates.
We used self-reported height and weight to calculate BMI (weight in kilograms divided by the square of height in meters). Obesity was defined as a BMI of 30 kilograms per meter squared, overweight as 25.0 to 29.9 kilograms per meter squared, normal weight as 18.5 to 24.9 kilograms per meter squared, and underweight as less than 18.5 kilograms per meter squared.19 Marital status was categorized as married or living with partner; divorced, separated, or widowed; or never married. Self-reported general health status was categorized as excellent or very good, good, or fair or poor, and regions of the country as South, Midwest, Northeast, and West.
Statistical Analysis
In all analyses, we used sampling weights to account for the unequal probabilities of selection resulting from the sample design, from nonresponse to the NHIS, and from planned oversampling of Hispanic, non-Hispanic Black, non-Hispanic Asian, and elderly (aged ≥ 65 years). We calculated standard errors or variance estimations using Taylor series linearization. We used the SUBPOP command in Stata version 13 (StataCorp, College Station, TX) for correct variance estimation using the analytic sample. We considered a 2-sided P < .05 as statistically significant.
Separately for men and women, we compared Blacks and Whites across categories of alcohol consumption for prespecified sociodemographic characteristics, self-reported medical history, and health behaviors by using Rao–Scott second-order corrected Pearson statistics that took survey weights into account.36 Using the age distribution from the 2000 US Census as the standard population, we used the direct method to calculate age-standardized death rates for specific categories of alcohol consumption among each race–gender group. To calculate race- and gender-specific mortality risk differences, we subtracted death rates in each alcohol consumption category from the race- and gender-specific death rate for never drinkers.
We used Cox proportional hazard regression models to estimate the race- and gender-specific hazard ratio of all-cause mortality as the outcome across levels of alcohol consumption. Follow-up time for the analyses was counted from age at enrollment (based on pooled surveys from 1997 to 2002) to either age at death or age at the end of the study period (December 31, 2006). We used age in years as the timescale in proportional hazard modeling. Covariates, selected a priori as potential confounders and adjusted for in a consecutive manner, included age (as the timescale), marital status, educational attainment, household income, poverty status, employment status, leisure-time physical activity, smoking status, health care visitation, BMI, and self-reported health status. We did not adjust for potential mediators of the association between alcohol and mortality (e.g., hypertension, diabetes). The proportional hazards assumption of the model, tested using Schoenfield residuals, was met. We tested for an interaction between alcohol drinking pattern and mortality by race using separate interaction terms for race and the aforementioned alcohol consumption categories. The interaction terms were tested separately for men and women.
Despite limited power, we incorporated a lag in sensitivity analyses by excluding the first 2 years of follow-up to address the potential for reverse causation whereby some nondrinkers may already be sick and at an increased risk of death. By race–gender group, we also investigated an interaction of continuous age on the alcohol category–mortality relationship in addition to stratifying by age group (< 50 and ≥ 50 years). To investigate the social integration theory,37 we conducted separate analyses excluding all participants
at or below the poverty line,
who were unemployed,
who reported fair or poor health,
with less than a high school education,
without all of the aforementioned characteristics combined, and
with any functional limitation due to their health.
RESULTS
Among men, 13% of White men and 24% of Black men were never drinkers (Table 1). Among women, 23% of White women and 42% of Black women reported never consuming alcohol (Table 2). Compared with Blacks, Whites were older, less likely to live in poverty (especially women), more likely to be married, to have at least a college education, and to engage in some level of physical activity across levels of alcohol consumption.
TABLE 1—
Baseline Sociodemographic, Health Behavior, and Clinical Characteristics Among NHIS Male Participants by Alcohol Consumption: United States, 1997–2002
| Characteristic | Former Drinkersa | Infrequent Drinkersb | Never Drinkersc | 1–2 Drinks ≤ 2 D/Wk | 1–2 Drinks 3–7 D/Wk | ≥ 3 Drinks ≤ 2 D/Wk | ≥ 3 Drinks 3–7 D/Wk |
| Sample size, no. (%) | 6 135 (9) | 5 055 (7) | 8 560 (14) | 14 663 (23) | 4 428 (7) | 20 331 (31) | 6 121 (9) |
| White | 5 202 (9) | 4 018 (7) | 6 473 (13) | 12 740 (23) | 3 835 (7) | 17 969 (32) | 5 463 (9) |
| Black | 933 (8) | 1 037 (10) | 2 087 (24) | 1 923 (21) | 593 (6) | 2 362 (24) | 658 (6) |
| Age, y, mean ±SE | |||||||
| White | 55.2 ±0.28 | 53.9 ±0.30 | 45.2 ±0.29 | 46.3 ±0.17 | 40.7 ±0.27 | 41.2 ±0.17 | 46.7 ±0.29 |
| Black | 53.9 ±0.68 | 48.9 ±0.61 | 37.4 ±0.47 | 40.4 ±0.44 | 38.3 ±0.57 | 38.6 ±0.34 | 42.1 ±0.66 |
| Educational attainment, ≥ college, % | |||||||
| White | 17 | 19 | 21 | 34 | 31 | 32 | 25 |
| Black | 9 | 13 | 13 | 18 | 12 | 14 | 8 |
| Unemployed, % | |||||||
| White | 2 | 3 | 3 | 2 | 3 | 3 | 4 |
| Black | 6 | 7 | 7 | 8 | 8 | 9 | 10 |
| Household annual income, ≥ $75 000, % | |||||||
| White | 15 | 16 | 18 | 30 | 29 | 31 | 25 |
| Black | 8 | 10 | 9 | 18 | 16 | 14 | 10 |
| Living in poverty, % | |||||||
| White | 7 | 8 | 10 | 5 | 6 | 6 | 7 |
| Black | 21 | 17 | 19 | 11 | 8 | 15 | 22 |
| Marital status, married, % | |||||||
| White | 71 | 75 | 60 | 71 | 63 | 59 | 57 |
| Black | 53 | 58 | 41 | 50 | 47 | 39 | 36 |
| Health behaviors | |||||||
| Smoking status, never, % | |||||||
| White | 25 | 39 | 72 | 51 | 45 | 41 | 24 |
| Black | 27 | 47 | 80 | 60 | 51 | 43 | 27 |
| Leisure time physical activity, never, % | |||||||
| White | 45 | 43 | 48 | 30 | 25 | 23 | 32 |
| Black | 59 | 48 | 47 | 32 | 29 | 35 | 53 |
| Clinical characteristics | |||||||
| BMI, kg/m2, mean ±SE | |||||||
| White | 27.5 ±0.08 | 27.5 ±0.10 | 26.8 ±0.08 | 27.4 ±0.05 | 27.0 ±0.08 | 26.7 ±0.04 | 26.5 ±0.07 |
| Black | 28.0 ±0.26 | 28.1 ±0.23 | 27.1 ±0.18 | 27.9 ±0.13 | 27.8 ±0.28 | 27.6 ±0.13 | 26.3 ±0.19 |
| Hypertension, % | |||||||
| White | 35 | 33 | 22 | 23 | 17 | 18 | 28 |
| Black | 45 | 39 | 21 | 25 | 22 | 23 | 28 |
| Health status, fair/poor, % | |||||||
| White | 25 | 21 | 13 | 8 | 5 | 5 | 10 |
| Black | 33 | 27 | 13 | 12 | 8 | 10 | 19 |
| Region of country, south, % | |||||||
| White | 38 | 44 | 44 | 32 | 31 | 30 | 34 |
| Black | 56 | 63 | 63 | 52 | 51 | 56 | 62 |
Note. BMI = body mass index; NHIS = National Health Interview Survey; unemployed = do not have a job, have actively looked for work in the previous 4 week, and are currently available for work. Values are weighted estimates. The sample size was n = 65 293.
Consumed 0 drinks in past year.
Consumed ≥ 12 drinks in their lifetime but never ≥ 12 in a single year.
Consumed ≤ 12 drinks in life.
TABLE 2—
Baseline Sociodemographic, Health Behavior, and Clinical Characteristics Among NHIS Female Participants by Alcohol Consumption: United States, 1997–2002
| Characteristic | Former Drinkersa | Infrequent Drinkersb | Never Drinkersc | 1 Drink ≤ 2 D/Wk | 1 Drink 3–7 D/Wk | ≥ 2 Drinks ≤ 2 D/Wk | ≥ 2 Drinks 3–7 D/Wk |
| Sample size, no. (%) | 5 086 (6) | 9 242 (10) | 23 074 (26) | 16 125 (19) | 16 426 (20) | 10 182 (12) | 6 752 (8) |
| White | 4 165 (6) | 7 236 (10) | 16 505 (23) | 13 664 (19) | 14 098 (21) | 8 941 (13) | 6 060 (8) |
| Black | 921 (5) | 2 006 (12) | 6 569 (42) | 2 461 (15) | 2 328 (14) | 1 241 (7) | 692 (4) |
| Age, y, mean ±SE | |||||||
| White | 51.7 ±0.37 | 53.8 ±0.26 | 52.4 ±0.25 | 48.1 ±0.19 | 41.4 ±0.15 | 40.2 ±0.21 | 45.2 ±0.33 |
| Black | 51.9 ±0.74 | 49.3 ±0.45 | 43.1 ±0.37 | 39.9 ±0.35 | 37.7 ±0.29 | 37.3 ±0.46 | 39.9 ±0.57 |
| Educational attainment, ≥ college, % | |||||||
| White | 20 | 13 | 13 | 29 | 29 | 33 | 30 |
| Black | 12 | 13 | 11 | 25 | 18 | 15 | 11 |
| Unemployed, % | |||||||
| White | 3 | 3 | 3 | 3 | 2 | 2 | 3 |
| Black | 4 | 8 | 6 | 5 | 7 | 8 | 11 |
| Household annual income, ≥ $75 000, % | |||||||
| White | 16 | 14 | 13 | 27 | 28 | 31 | 31 |
| Black | 7 | 8 | 7 | 17 | 11 | 9 | 7 |
| Living in poverty | |||||||
| White | 13 | 12 | 14 | 6 | 7 | 7 | 7 |
| Black | 34 | 27 | 32 | 16 | 23 | 26 | 38 |
| Marital status, married, % | |||||||
| White | 59 | 61 | 57 | 67 | 62 | 57 | 54 |
| Black | 33 | 35 | 31 | 37 | 29 | 26 | 24 |
| Health behaviors | |||||||
| Smoking status, never, % | |||||||
| White | 39 | 50 | 78 | 59 | 50 | 45 | 31 |
| Black | 45 | 56 | 84 | 69 | 58 | 46 | 30 |
| Leisure-time physical activity, never, % | |||||||
| White | 49 | 44 | 54 | 32 | 27 | 24 | 26 |
| Black | 67 | 51 | 62 | 41 | 42 | 45 | 52 |
| Clinical characteristics | |||||||
| BMI, kg/m2, mean ±SE | |||||||
| White | 26.7 ±0.11 | 26.8 ±0.08 | 26.2 ±0.06 | 26.2 ±0.06 | 25.4 ±0.06 | 24.5 ±0.06 | 24.2 ±0.07 |
| Black | 30.0 ±0.23 | 29.6 ±0.19 | 28.4 ±0.11 | 28.3 ±0.15 | 28.3 ±0.16 | 28.2 ±0.21 | 28.0 ±0.29 |
| Hypertension, % | |||||||
| White | 33 | 34 | 32 | 24 | 16 | 13 | 19 |
| Black | 49 | 44 | 33 | 27 | 24 | 26 | 31 |
| Health status, fair/poor, % | |||||||
| White | 22 | 20 | 18 | 9 | 6 | 4 | 6 |
| Black | 33 | 27 | 19 | 12 | 11 | 13 | 21 |
| Region of country, South, % | |||||||
| White | 34 | 36 | 47 | 30 | 29 | 28 | 29 |
| Black | 55 | 53 | 64 | 51 | 49 | 51 | 56 |
Note. BMI = body mass index; NHIS = National Health Interview Survey; unemployed = do not have a job, have actively looked for work in the previous 4 wk, and are currently available for work. Values are weighted estimates. The sample size was n = 86 887.
Consumed 0 drinks in past year.
Consumed ≥ 12 drinks in their lifetime but never ≥ 12 in a single year.
Consumed ≤ 12 drinks in life.
Sociodemographic Characteristics and Drinking Patterns
Prevalence of poor or fair health status was the same (13%) among Black and White men who never consumed alcohol. Black men who consumed 3 or more drinks on 3 to 7 days per week compared with their White counterparts were, however, much more likely to live in poverty (22% vs 7%; 95% CIs = 18%, 26% vs 6%, 9%) and to be unemployed (10% vs 4%; 95% CIs = 8%, 13% vs 3%, 5%) and less likely to both have a college education or more (8% vs 25%; 95% CIs = 6%, 10% vs. 24%, 26%) and be married (36% vs 57%; 95% CIs = 31%, 40% vs 55%, 58%). A college education or more was most prevalent among White and Black men (34% vs 18%; 95% CIs = 33%, 35% vs 16%, 20%) consuming 1 to 2 drinks on 2 or fewer days per week. Poverty level was comparable across drinking categories for White men but increased with increasing alcohol consumption among Black men. Among the heavier compared with lighter drinkers with the same frequency of consumption, both Black and White men were younger and were less likely to be married as well as to have self-reported hypertension and fair or poor health status.
Poverty level was similar across drinking categories for White women (from 6% to 7%; 95% CIs = 5%, 6% to 6%, 9%), but increased substantially with increasing alcohol consumption among Black women (from 16% to 38%; 95% CIs = 15%, 18% to 33%, 43%). Black women who consumed 2 or more drinks on 3 to 7 days per week were, compared with their White counterparts, much more likely to live in poverty (38% vs 7%; 95% CIs = 33%, 43% vs 6%, 9%) and to be unemployed (11% vs 3%; 95% CIs = 8%, 15% vs 3%, 4%). Black women were also less likely to have a college education or more (11% vs 30%; 95% CIs = 8%, 14% vs 28%, 31%) and be married (24% vs 54%; 95% CIs = 20%, 28% vs 52%, 55%).
Death Rates and Alcohol Consumption
During 9 years (median = 6; mean = 6.4) of follow-up from 1997 to 2006, corresponding to 913 506 person-years, there were 13 366 total deaths: 11 221 among Whites and 2145 among Blacks. Participants who consumed 1 to 2 drinks per day on 3 to 7 days per week had the lowest age-adjusted mortality rates (MRs) per 1000 person-years among White men (MR = 65.5; 95% CI = 51.7, 79.3); those who consumed 1 to 2 drinks per day on 2 or fewer days per week had the lowest age-adjusted MR per 1000 person-years among Black men (MR = 116.1; 95% CI = 91.3, 140.8), which was very similar to those who never consumed alcohol (MR = 128.7; 95% CI = 104.3, 153.1; Table 3). One drink per day on 3 to 7 days per week among White women (MR = 40.1; 95% CI = 27.4, 52.8) and 1 drink per day on 2 or fewer days per week in Black women (MR = 68.5; 95% CI = 50.9, 86.0]) were associated with the lowest MR. Figure 1 illustrates death rates from all-causes by amount of alcohol consumption by race and gender.
TABLE 3—
Age-Standardized All-Cause Mortality Rates (per 1000 Person-Years) and Adjusted Hazard Ratios by Usual Amount of Alcohol Consumption, Race, and Gender in 152 180 NHIS Participants at Baseline: United States, 1997–2002 Through 2006
| Former Drinkersa | Infrequent Drinkersb | Never Drinkersc | 1–2 Drinks ≤ 2 D/Wk (Men) or 1 Drink ≤ 2 D/Wk (Women) | 1–2 Drinks 3–7 D/Wk (Men) or 1 Drink 3–7 D/Wk (Women) | ≥ 3 Drinks ≤ 2 D/Wk (Men) or ≥ 2 Drinks ≤ 2 D/Wk (Women) | ≥ 3 Drinks 3–7 D/Wk (Men) or ≥ 2 Drinks 3–7 D/Wk (Women) | |
| White men (n = 55 700) | |||||||
| Deaths, no. | 1 104 | 725 | 759 | 1 006 | 172 | 886 | 559 |
| Population, no. | 5 202 | 4 018 | 6 473 | 12 740 | 3 835 | 17 969 | 5 463 |
| P-y, no. | 29 191 | 23 138 | 37 486 | 77 520 | 23 807 | 110 783 | 33 118 |
| Mortality rated per 1000 p-y (CI) | 137.9 (126.1–149.7) | 123.0 (111.5–134.6) | 86.4 (77.2–95.7) | 74.9 (68.1–81.6) | 65.5 (51.7–79.3) | 68.2 (61.8–74.6) | 114.0 (103.5–124.4) |
| Risk difference | 51.5 | 36.6 | 0 | −11.5 | −20.9 | −18.2 | 27.6 |
| Model 1 (age) | 1.45 (1.29–1.62) | 1.22 (1.09–1.37) | 1.00 (Ref) | 0.79 (0.71–0.88) | 0.67 (0.55–0.81) | 0.71 (0.63–0.80) | 1.03 (0.91–1.17) |
| Model 2 (demographics) | 1.46 (1.28–1.66) | 1.29 (1.12–1.48) | 1.00 (Ref) | 0.94 (0.83–1.06) | 0.84 (0.68–1.03) | 0.82 (0.72–0.94) | 1.19 (1.03–1.38) |
| Model 3 (health behaviors) | 1.25 (1.09–1.44) | 1.15 (0.99–1.33) | 1.00 (Ref) | 0.89 (0.78–1.02) | 0.74 (0.59–0.94) | 0.78 (0.67–0.90) | 0.99 (0.85–1.17) |
| Model 4 (clinical outcomes) | 1.17 (1.02–1.35) | 1.09 (0.94–1.27) | 1.00 (Ref) | 0.93 (0.81–1.06) | 0.81 (0.64–1.02) | 0.84 (0.72–0.97) | 1.06 (0.90–1.24) |
| Black men (n = 9 593) | |||||||
| Deaths, no. | 220 | 148 | 190 | 144 | 36 | 165 | 83 |
| Population, no. | 933 | 1 037 | 2 087 | 1 923 | 593 | 2 362 | 658 |
| P-y, no. | 5 298 | 6 156 | 12 045 | 11 668 | 3 514 | 14 428 | 3 944 |
| Mortality rated per 1000 p-y (CI) | 157.3 (129.1–185.4) | 135.7 (106.7–164.8) | 128.7 (104.3–153.1) | 116.1 (91.3–140.8) | 132.4 (80.5–184.2) | 130.8 (105.6–156.0) | 203.1 (161.9–244.4) |
| Risk difference | 28.6 | 7 | 0 | −12.6 | 3.7 | 2.1 | 74.4 |
| Model 1 (age) | 1.35 (1.10–1.66) | 1.15 (0.92–1.42) | 1.00 (Ref) | 0.88 (0.69–1.11) | 0.95 (0.65–1.38) | 0.94 (0.74–1.21) | 1.52 (1.13–2.04) |
| Model 2 (demographics) | 1.37 (1.11–1.70) | 1.23 (0.95–1.59) | 1.00 (Ref) | 1.02 (0.78–1.34) | 1.31 (0.86–2.00) | 1.17 (0.91–1.50) | 1.64 (1.21–2.22) |
| Model 3 (health behaviors) | 1.23 (0.98–1.54) | 1.24 (0.93–1.67) | 1.00 (Ref) | 0.98 (0.70–1.38) | 1.31 (0.83–2.07) | 1.06 (0.80–1.39) | 1.48 (1.05–2.08) |
| Model 4 (clinical outcomes) | 1.20 (0.95–1.50) | 1.23 (0.92–1.62) | 1.00 (Ref) | 1.02 (0.74–1.42) | 1.39 (0.87–2.20) | 1.08 (0.82–1.43) | 1.44 (1.02–2.04) |
| White women (n = 70 669) | |||||||
| Deaths, no. | 640 | 1 046 | 2 397 | 850 | 465 | 229 | 383 |
| Population, no. | 4 165 | 7 236 | 16 505 | 13 664 | 14 098 | 8 941 | 6 060 |
| P-y, no. | 24 201 | 42 391 | 94 527 | 146 624 | 24 532 | 82 198 | 10 065 |
| Mortality rated per 1000 p-y (CI) | 100.8 (88.7–112.8) | 84.4 (76.5–92.2) | 71.0 (65.4–76.7) | 47.2 (42.9–51.4) | 40.1 (27.4–52.8) | 41.7 (35.6–47.8) | 79.7 (64.5–95.0) |
| Risk difference | 29.8 | 13.4 | 0 | −23.8 | −30.9 | −29.3 | 8.7 |
| Model 1 (age) | 1.26 (1.14–1.38) | 1.08 (1.00–1.17) | 1.00 (Ref) | 0.61 (0.55–0.66) | 0.55 (0.50–0.62) | 0.47 (0.40–0.55) | 0.77 (0.69–0.87) |
| Model 2 (demographics) | 1.27 (1.14–1.41) | 1.08 (1.01–1.23) | 1.00 (Ref) | 0.70 (0.63–0.78) | 0.66 (0.58–0.75) | 0.58 (0.48–0.70) | 0.96 (0.83–1.10) |
| Model 3 (health behaviors) | 1.08 (0.96–1.21) | 0.98 (0.88–1.09) | 1.00 (Ref) | 0.70 (0.63–0.79) | 0.64 (0.55–0.74) | 0.56 (0.46–0.68) | 0.86 (0.74–1.00) |
| Model 4 (clinical outcomes) | 1.05 (0.93–1.18) | 0.97 (0.87–1.09) | 1.00 (Ref) | 0.79 (0.70–0.88) | 0.71 (0.61–0.82) | 0.62 (0.51–0.76) | 0.95 (0.81–1.10) |
| Black women (n = 16 218) | |||||||
| Deaths, no. | 144 | 207 | 552 | 92 | 89 | 34 | 41 |
| Population, no. | 921 | 2 006 | 6 569 | 2 461 | 2 328 | 1 241 | 692 |
| P-y, no. | 5 241 | 12 057 | 38 396 | 25 496 | 3 673 | 10 597 | 1 412 |
| Mortality rated per 1000 p-y (CI) | 137.7 (110.7–164.7) | 105.4 (84.0–126.7) | 87.3 (75.7–98.8) | 68.5 (50.9–86.0) | 93.8 (49.4–138.2) | 67.6 (39.5–95.7) | 141.2 (66.3–216.1) |
| Risk difference | 50.4 | 18.1 | 0 | −18.8 | 6.5 | −19.7 | 53.9 |
| Model 1 (age) | 1.39 (1.14–1.70) | 1.02 (0.82–1.27) | 1.00 (Ref) | 0.62 (0.47–0.81) | 0.89 (0.67–1.18) | 0.61 (0.41–0.91) | 0.96 (0.68–1.36) |
| Model 2 (demographics) | 1.54 (1.22–1.93) | 1.14 (0.92–1.41) | 1.00 (Ref) | 0.76 (0.55–1.07) | 1.04 (0.76–1.41) | 0.75 (0.49–1.14) | 1.08 (0.76–1.53) |
| Model 3 (health behaviors) | 1.24 (0.93–1.65) | 1.05 (0.83–1.32) | 1.00 (Ref) | 0.73 (0.52–1.03) | 0.92 (0.66–1.30) | 0.50 (0.31–0.81) | 0.95 (0.63–1.42) |
| Model 4 (clinical outcomes) | 1.16 (0.86–1.58) | 1.06 (0.83–1.34) | 1.00 (Ref) | 0.72 (0.51–1.03) | 0.98 (0.70–1.37) | 0.53 (0.33–0.85) | 0.95 (0.63–1.43) |
Note. BMI = body mass index; CI = confidence interval; HR = hazard ratio; NHIS = National Health Interview Survey; p-y = person-years. Model 1: age group. Model 2 (demographics): model 1 + marital status, education, household income, poverty status, and employment status. Model 3 (health behaviors): model 2 + leisure-time physical activity, smoking status, and visited health care professional. Model 4 (clinical outcomes): model 3 + BMI quintile, self-reported health status.
Consumed 0 drinks in past year.
Consumed ≥ 12 drinks in their lifetime but never ≥ 12 in a single year.
Consumed ≤ 12 drinks in life.
Age-standardized by the direct method with 3 age categories (35–49 years; 50–64 years; and 65–75 years) and the 2000 US Census as the standard.
FIGURE 1—
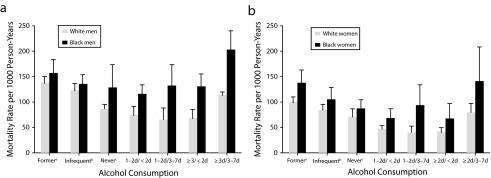
Age-adjusted all-cause mortality rates by amount of alcohol consumption in the past year for Black and White (a) men and (b) women: National Health Interview Survey, United States, 1997–2000.
Note. Standard population = 2000 US Census; 1–2d/ < 2d = 1–2 drinks per day on < 2 days per week; 1–2d/3–7d = 1–2 drinks per day on 3–7 days per week; ≥ 3d/ < 2d = ≥ 3 drinks per day on < 2 days per week; ≥ 3d/ < 2d = ≥ 3 drinks per day on 3–7 days per week; 1d/ < 2d = 1 drink per day on < 2 days per week; 1d/ < 3–7d = 1 drink per day on 3–7 days per week; ≥ 2d/ < 2d = ≥ 2 drinks per day on < 2 days per week; ≥ 2d/3–7d = ≥ 2 drinks per day on 3–7 days per week. Whiskers indicate 95% confidence intervals.
aConsumed 0 drinks in past year.
bConsumed ≥ 12 drinks in their lifetime but never ≥ 12 in a single year.
cConsumed ≤ 12 drinks in life.
Hazard Ratios and Alcohol Consumption
The lowest multivariable-adjusted relative risk of mortality was 0.81 (95% CI = 0.64, 1.02) for White men who consumed 1 to 2 drinks on 3 to 7 days per week compared with never drinkers, whereas Black men who were never drinkers had the lowest mortality risk (Table 3). Compared with women who abstained, the lowest mortality risk was among White women who had moderate alcohol consumption up to 7 days a week (HR = 0.71; 95% CI = 0.61, 0.82) and Black women who consumed 2 or more drinks on 2 or fewer days per week (HR = 0.53; 95% CI = 0.33, 0.85). Regarding interactions between race and alcohol categories, Black men who consumed 1 to 2 drinks on 3 to 7 days per week (HR = 1.82; P = .008), 3 or more drinks on 2 or fewer days per week (HR = 1.33; P = .011), and 3 or more drinks on 3 to 7 days per week (HR = 1.42; P = .024) had a significantly higher mortality risk than their White male counterparts.
On the basis of sensitivity analyses, a 2-year lag did not appreciably change the main results across race–gender groups (Table A, available as a supplement to the online version of this article at http://www.ajph.org). Analysis restricted to employed participants did not alter the results, and age did not significantly modify the alcohol–mortality relationship for any group (Table B, available as a supplement to the online version of this article at http://www.ajph.org). Last, not being socially integrated was associated with a mortality risk more than 2 times as high for men and more than 3 times as high for women. Not being socially integrated greatly increased mortality risk, but it did not have a strong interaction with alcohol that explained mortality risk (Table C, available as a supplement to the online version of this article at http://www.ajph.org).
DISCUSSION
Our results suggest that the relationship between alcohol drinking patterns and all-cause mortality varied by both race and gender. Among White men and women, moderate alcohol consumption on most days of the week was associated with lowest mortality risk, but Black men and women with similar drinking patterns did not have the same risk reduction compared with those who abstained or drank infrequently.
The contrasting findings between Whites and Blacks have led some to question whether the cardioprotective benefit of moderate alcohol consumption is real or spurious because of other (unobserved) lifestyle characteristics of moderate drinkers (e.g., more socially functional or accepted and integrated into society).10 Although moderate drinkers are more likely than abstainers to be smokers, they may have other beneficial health behaviors and environments that ultimately lower their health risks because they are less likely to be in poor or fair health, obese, of low socioeconomic status, and physically inactive.12 Investigating potential Black–White differences in lifestyle and socioeconomic characteristics by drinking patterns could provide greater insight into the overall relationship between alcohol drinking patterns and mortality. A previous study did not confirm the confounding effect of social integration on the alcohol–mortality relationship, but former and never drinkers were not analyzed separately.38 Future studies should investigate racial differences in the influence of drinking patterns as well as type of alcohol on the relationship between alcohol consumption and mortality risk.
Drinking is frequently a social activity, and activities surrounding alcohol consumption are likely to vary by race/ethnicity, which is another important area for future research. It would be particularly interesting to investigate racial/ethnic differences in reasons for consuming alcohol (e.g., youthful experimentation vs coping with hardships). Furthermore, racial differences exist in physical, chemical, and social exposures in occupational and residential environments, and the observed association for alcohol could, in part, reflect unmeasured confounding or interactions of alcohol with these unmeasured factors. Also, the rapid metabolism of alcohol among Blacks resulting from potential genetic differences could reduce cardiovascular benefits, yet we found a suggestion of benefit for light consumption among Black women, but not among Black men. The potential environmental and physiological differences by gender (e.g., stress coping strategies, occupational and other social conditions, body composition, and gastric absorption) among Blacks should be further studied. For instance, Black women who did not consume alcohol were substantially more likely to live in poverty than their Black male counterparts in addition to the Black women who did consume alcohol. While we attempted to control for poverty, the impact of residual confounding may have remained and influenced the relationship between alcohol drinking patterns and mortality risk.
This study has limitations. First, all data are based on self-report. Previous studies have found self-reported alcohol consumption provides reasonably valid and reliable data.39–43 Age, gender, and race/ethnicity have also been associated with response bias in the past,44 but the data on potential differences in self-reporting error between Blacks and Whites are very limited, especially with reference to drinking patterns. Nonetheless, computerized assessments such as the computer-assisted personal interview used in the NHIS may overcome some of the disadvantages of self- and interviewer-administered instruments. Furthermore, we had too few cases to robustly investigate, as separate outcomes, cardiovascular disease, cancer, and external causes of death (e.g., homicide, accidents, suicide), for which the benefits or risks are likely to be greatest. Last, our measure of alcohol use was based on the time period from the past year, but drinking patterns may change over time.
Despite these limitations, our study has several important strengths. For example, the prospective design allowed for risk estimations by race and gender. This is a nationally representative sample of US adults. We had access to a large sample of the US Black population, an understudied group. Blacks and Whites were included in the study cohort, and risk patterns could be directly evaluated in the same study sample with the same study design and data collection methods. We also had a sufficient sample size to examine gender differences by race. We analyzed recently collected data using well-accepted measures of alcohol consumption categorized on the basis of US dietary guidelines. An additional strength is that our data on drinking patterns were more detailed than usual. Although directly measured social integration data were unavailable in the NHIS, we were able to access racial differences between available well-established sociodemographic variables that may serve as key indicators of social integration.
Current dietary guidelines recommend moderate consumption for adult Americans who consume alcoholic beverages.45 Our study suggests that additional refinements based on race/ethnicity may be necessary, but further research is needed. Furthermore, the divergent findings between White and Black men and women in this and other US cohorts raise the unresolved question of whether the apparent cardioprotective effect of alcohol is real, differs for people of African ancestry, or is confounded by the varying lifestyle characteristics of drinkers versus nondrinkers.
Acknowledgments
F. B. Hu and C. L. Jackson were supported by TREC (1U54CA155626-01).
This work was presented, in part, as a poster presentation at the Epidemiology and Prevention Nutrition, Physical Activity, and Metabolism 2014 Scientific Sessions; March 18–21, 2014; San Francisco, CA.
Note. The funding sources were not involved in the data collection, data analysis, article writing, and publication.
Human Participant Protection
This study was approved by our institutional review board at the Harvard T. H. Chan School of Public Health, and the National Health Interview Survey received informed consent from each study participant.
References
- 1.Rehm J, Room R, Graham K, Monteiro M, Gmel G, Sempos CT. The relationship of average volume of alcohol consumption and patterns of drinking to burden of disease: an overview. Addiction. 2003;98(9):1209–1228. doi: 10.1046/j.1360-0443.2003.00467.x. [DOI] [PubMed] [Google Scholar]
- 2.Koppes LL, Dekker JM, Hendriks HF, Bouter LM, Heine RJ. Meta-analysis of the relationship between alcohol consumption and coronary heart disease and mortality in type 2 diabetic patients. Diabetologia. 2006;49(4):648–652. doi: 10.1007/s00125-005-0127-x. [DOI] [PubMed] [Google Scholar]
- 3.Thun MJ, Peto R, Lopez AD et al. Alcohol consumption and mortality among middle-aged and elderly US adults. N Engl J Med. 1997;337(24):1705–1714. doi: 10.1056/NEJM199712113372401. [DOI] [PubMed] [Google Scholar]
- 4.Danaei G, Ding EL, Mozaffarian D et al. The preventable causes of death in the United States: comparative risk assessment of dietary, lifestyle, and metabolic risk factors. PLoS Med. 2009;6(4):e1000058. doi: 10.1371/journal.pmed.1000058. [DOI] [PMC free article] [PubMed] [Google Scholar]
- 5.Di Castelnuovo A, Costanzo S, di Giuseppe R, de Gaetano G, Iacoviello L. Alcohol consumption and cardiovascular risk: mechanisms of action and epidemiologic perspectives. Future Cardiol. 2009;5(5):467–477. doi: 10.2217/fca.09.36. [DOI] [PubMed] [Google Scholar]
- 6.Berrougui H, Momo CN, Khalil A. Health benefits of high-density lipoproteins in preventing cardiovascular diseases. J Clin Lipidol. 2012;6(6):524–533. doi: 10.1016/j.jacl.2012.04.004. [DOI] [PubMed] [Google Scholar]
- 7.Brien SE, Ronksley PE, Turner BJ, Mukamal KJ, Ghali WA. Effect of alcohol consumption on biological markers associated with risk of coronary heart disease: systematic review and meta-analysis of interventional studies. BMJ. 2011;342:d636. doi: 10.1136/bmj.d636. [DOI] [PMC free article] [PubMed] [Google Scholar]
- 8.Mukamal KJ, Jensen MK, Gronbaek M et al. Drinking frequency, mediating biomarkers, and risk of myocardial infarction in women and men. Circulation. 2005;112(10):1406–1413. doi: 10.1161/CIRCULATIONAHA.105.537704. [DOI] [PubMed] [Google Scholar]
- 9.Voight BF, Peloso GM, Orho-Melander M et al. Plasma HDL cholesterol and risk of myocardial infarction: a Mendelian randomisation study. Lancet. 2012;380(9841):572–580. doi: 10.1016/S0140-6736(12)60312-2. [DOI] [PMC free article] [PubMed] [Google Scholar]
- 10.Fuchs FD, Chambless LE, Folsom AR et al. Association between alcoholic beverage consumption and incidence of coronary heart disease in Whites and Blacks: the Atherosclerosis Risk in Communities Study. Am J Epidemiol. 2004;160(5):466–474. doi: 10.1093/aje/kwh229. [DOI] [PubMed] [Google Scholar]
- 11.Fuchs FD, Chambless LE, Whelton PK, Nieto FJ, Heiss G. Alcohol consumption and the incidence of hypertension: the Atherosclerosis Risk in Communities Study. Hypertension. 2001;37(5):1242–1250. doi: 10.1161/01.hyp.37.5.1242. [DOI] [PubMed] [Google Scholar]
- 12.Mukamal KJ, Ding EL, Djousse L. Alcohol consumption, physical activity, and chronic disease risk factors: a population-based cross-sectional survey. BMC Public Health. 2006;6:118. doi: 10.1186/1471-2458-6-118. [DOI] [PMC free article] [PubMed] [Google Scholar]
- 13.Mukamal KJ, Chen CM, Rao SR, Breslow RA. Alcohol consumption and cardiovascular mortality among US adults, 1987 to 2002. J Am Coll Cardiol. 2010;55(13):1328–1335. doi: 10.1016/j.jacc.2009.10.056. [DOI] [PMC free article] [PubMed] [Google Scholar]
- 14.Sempos CT, Rehm J, Wu T, Crespo CJ, Trevisan M. Average volume of alcohol consumption and all-cause mortality in African Americans: the NHEFS cohort. Alcohol Clin Exp Res. 2003;27(1):88–92. doi: 10.1097/01.ALC.0000046597.92232.73. [DOI] [PubMed] [Google Scholar]
- 15.Rehm J, Greenfield TK, Rogers JD. Average volume of alcohol consumption, patterns of drinking, and all-cause mortality: results from the US National Alcohol Survey. Am J Epidemiol. 2001;153(1):64–71. doi: 10.1093/aje/153.1.64. [DOI] [PubMed] [Google Scholar]
- 16.Pletcher MJ, Varosy P, Kiefe CI, Lewis CE, Sidney S, Hulley SB. Alcohol consumption, binge drinking, and early coronary calcification: findings from the Coronary Artery Risk Development in Young Adults (CARDIA) Study. Am J Epidemiol. 2005;161(5):423–433. doi: 10.1093/aje/kwi062. [DOI] [PubMed] [Google Scholar]
- 17.Rehm J, Sempos CT. Alcohol consumption and all-cause mortality. Addiction. 1995;90(4):471–480. doi: 10.1046/j.1360-0443.1995.9044712.x. [DOI] [PubMed] [Google Scholar]
- 18.Kerr WC, Greenfield TK, Bond J, Ye Y, Rehm J. Racial and ethnic differences in all-cause mortality risk according to alcohol consumption patterns in the national alcohol surveys. Am J Epidemiol. 2011;174(7):769–778. doi: 10.1093/aje/kwr147. [DOI] [PMC free article] [PubMed] [Google Scholar]
- 19.Bierut LJ, Goate AM, Breslau N et al. ADH1B is associated with alcohol dependence and alcohol consumption in populations of European and African ancestry. Mol Psychiatry. 2012;17(4):445–450. doi: 10.1038/mp.2011.124. [DOI] [PMC free article] [PubMed] [Google Scholar]
- 20.Crabb DW, Matsumoto M, Chang D, You M. Overview of the role of alcohol dehydrogenase and aldehyde dehydrogenase and their variants in the genesis of alcohol-related pathology. Proc Nutr Soc. 2004;63(1):49–63. doi: 10.1079/pns2003327. [DOI] [PubMed] [Google Scholar]
- 21.McCarthy DM, Pedersen SL, Lobos EA, Todd RD, Wall TL. ADH1B*3 and response to alcohol in African-Americans. Alcohol Clin Exp Res. 2010;34(7):1274–1281. doi: 10.1111/j.1530-0277.2010.01205.x. [DOI] [PMC free article] [PubMed] [Google Scholar]
- 22.Edenberg HJ. The genetics of alcohol metabolism: role of alcohol dehydrogenase and aldehyde dehydrogenase variants. Alcohol Res Health. 2007;30(1):5–13. [PMC free article] [PubMed] [Google Scholar]
- 23.Kerr WC, Karriker-Jaffe KJ, Ye Y. Examining alcohol’s contribution to the US African-American/White cirrhosis mortality differential from 1950 to 2002. Alcohol Alcohol. 2013;48(5):605–612. doi: 10.1093/alcalc/agt031. [DOI] [PMC free article] [PubMed] [Google Scholar]
- 24.Stewart SH. Racial and ethnic differences in alcohol-associated aspartate aminotransferase and gamma-glutamyltransferase elevation. Arch Intern Med. 2002;162(19):2236–2239. doi: 10.1001/archinte.162.19.2236. [DOI] [PubMed] [Google Scholar]
- 25.Tarver-Carr ME, Powe NR, Eberhardt MS et al. Excess risk of chronic kidney disease among African-American versus White subjects in the United States: a population-based study of potential explanatory factors. J Am Soc Nephrol. 2002;13(9):2363–2370. doi: 10.1097/01.asn.0000026493.18542.6a. [DOI] [PubMed] [Google Scholar]
- 26.Steffens AA, Moreira LB, Fuchs SC, Wiehe M, Gus M, Fuchs FD. Incidence of hypertension by alcohol consumption: is it modified by race? J Hypertens. 2006;24(8):1489–1492. doi: 10.1097/01.hjh.0000239282.27938.0f. [DOI] [PubMed] [Google Scholar]
- 27.Brancati FL, Kao WH, Folsom AR, Watson RL, Szklo M. Incident type 2 diabetes mellitus in African American and White adults: the Atherosclerosis Risk in Communities Study. JAMA. 2000;283(17):2253–2259. doi: 10.1001/jama.283.17.2253. [DOI] [PubMed] [Google Scholar]
- 28.Naimi TS, Brown DW, Brewer RD et al. Cardiovascular risk factors and confounders among nondrinking and moderate-drinking US adults. Am J Prev Med. 2005;28(4):369–373. doi: 10.1016/j.amepre.2005.01.011. [DOI] [PubMed] [Google Scholar]
- 29.Slater MD, Basil MD, Maibach EW. A cluster analysis of alcohol-related attitudes and behaviors in the general population. J Stud Alcohol. 1999;60(5):667–674. doi: 10.15288/jsa.1999.60.667. [DOI] [PubMed] [Google Scholar]
- 30. National Center for Health Statistics. National Health Interview Survey Survey Description. Available at: ftp://ftp.cdc.gov/pub/Health_Statistics/NCHS/Dataset_Documentation/NHIS/2007/srvydesc.pdf. Accessed February 22, 2015.
- 31.International Classification of Diseases, 9th Revision. Geneva, Switzerland: World Health Organization; 1980. [Google Scholar]
- 32.Stampfer MJ, Willett WC, Speizer FE et al. Test of the National Death Index. Am J Epidemiol. 1984;119(5):837–839. doi: 10.1093/oxfordjournals.aje.a113804. [DOI] [PubMed] [Google Scholar]
- 33.Calle EE, Terrell DD. Utility of the National Death Index for ascertainment of mortality among Cancer Prevention Study II participants. Am J Epidemiol. 1993;137(2):235–241. doi: 10.1093/oxfordjournals.aje.a116664. [DOI] [PubMed] [Google Scholar]
- 34.Remmers JE, deGroot WJ, Sauerland EK, Anch AM. Pathogenesis of upper airway occlusion during sleep. J Appl Physiol. 1978;44(6):931–938. doi: 10.1152/jappl.1978.44.6.931. [DOI] [PubMed] [Google Scholar]
- 35. US Census Bureau. Poverty. Available at: http://www.census.gov/hhes/www/poverty/methods/definitions.html. Accessed February 22, 2015.
- 36.Rao JN, Scott AJ. A simple method for the analysis of clustered binary data. Biometrics. 1992;48(2):577–585. [PubMed] [Google Scholar]
- 37.Skog OJ. The collectivity of drinking cultures: a theory of the distribution of alcohol consumption. Br J Addict. 1985;80(1):83–99. doi: 10.1111/j.1360-0443.1985.tb05294.x. [DOI] [PubMed] [Google Scholar]
- 38.Murray RP, Rehm J, Shaten J, Connett JE. Does social integration confound the relation between alcohol consumption and mortality in the Multiple Risk Factor Intervention Trial (MRFIT)? J Stud Alcohol. 1999;60(6):740–745. doi: 10.15288/jsa.1999.60.740. [DOI] [PubMed] [Google Scholar]
- 39.Midanik LT. Validity of self-reported alcohol use: a literature review and assessment. Br J Addict. 1988;83(9):1019–1030. doi: 10.1111/j.1360-0443.1988.tb00526.x. [DOI] [PubMed] [Google Scholar]
- 40.Midanik L. The validity of self-reported alcohol consumption and alcohol problems: a literature review. Br J Addict. 1982;77(4):357–382. doi: 10.1111/j.1360-0443.1982.tb02469.x. [DOI] [PubMed] [Google Scholar]
- 41.Williams GD, Aitken SS, Malin H. Reliability of self-reported alcohol consumption in a general population survey. J Stud Alcohol. 1985;46(3):223–227. doi: 10.15288/jsa.1985.46.223. [DOI] [PubMed] [Google Scholar]
- 42.Embree BG, Whitehead PC. Validity and reliability of self-reported drinking behavior: dealing with the problem of response bias. J Stud Alcohol. 1993;54(3):334–344. doi: 10.15288/jsa.1993.54.334. [DOI] [PubMed] [Google Scholar]
- 43.Grant BF, Dawson DA, Stinson FS, Chou PS, Kay W, Pickering R. The Alcohol Use Disorder and Associated Disabilities Interview Schedule-IV (AUDADIS-IV): reliability of alcohol consumption, tobacco use, family history of depression and psychiatric diagnostic modules in a general population sample. Drug Alcohol Depend. 2003;71(1):7–16. doi: 10.1016/s0376-8716(03)00070-x. [DOI] [PubMed] [Google Scholar]
- 44.Connors GJ, Watson DW, Maisto SA. Influence of subject and interviewer characteristics on the reliability of young adults’ self-reports of drinking. J Psychopathol Behav Assess. 1985;7(4):365–374. [Google Scholar]
- 45. Office of Disease Prevention and Health Promotion. Dietary guidelines. Available at: http://www.health.gov/dietaryguidelines. Accessed February 22, 2015.