

Abstract
Background
Studies have shown associations between mortality and long-term exposure to particulate matter air pollution. Few cohort studies have estimated the effects of the elemental composition of particulate matter on mortality.
Objectives
Our aim was to study the association between natural-cause mortality and long-term exposure to elemental components of particulate matter.
Methods
Mortality and confounder data from 19 European cohort studies were used. Residential exposure to eight a priori–selected components of particulate matter (PM) was characterized following a strictly standardized protocol. Annual average concentrations of copper, iron, potassium, nickel, sulfur, silicon, vanadium, and zinc within PM size fractions ≤ 2.5 μm (PM2.5) and ≤ 10 μm (PM10) were estimated using land-use regression models. Cohort-specific statistical analyses of the associations between mortality and air pollution were conducted using Cox proportional hazards models using a common protocol followed by meta-analysis.
Results
The total study population consisted of 291,816 participants, of whom 25,466 died from a natural cause during follow-up (average time of follow-up, 14.3 years). Hazard ratios were positive for almost all elements and statistically significant for PM2.5 sulfur (1.14; 95% CI: 1.06, 1.23 per 200 ng/m3). In a two-pollutant model, the association with PM2.5 sulfur was robust to adjustment for PM2.5 mass, whereas the association with PM2.5 mass was reduced.
Conclusions
Long-term exposure to PM2.5 sulfur was associated with natural-cause mortality. This association was robust to adjustment for other pollutants and PM2.5.
Citation
Beelen R, Hoek G, Raaschou-Nielsen O, Stafoggia M, Andersen ZJ, Weinmayr G, Hoffmann B, Wolf K, Samoli E, Fischer PH, Nieuwenhuijsen MJ, Xun WW, Katsouyanni K, Dimakopoulou K, Marcon A, Vartiainen E, Lanki T, Yli-Tuomi T, Oftedal B, Schwarze PE, Nafstad P, De Faire U, Pedersen NL, Östenson C-G, Fratiglioni L, Penell J, Korek M, Pershagen G, Eriksen KT, Overvad K, Sørensen M, Eeftens M, Peeters PH, Meliefste K, Wang M, Bueno-de-Mesquita HB, Sugiri D, Krämer U, Heinrich J, de Hoogh K, Key T, Peters A, Hampel R, Concin H, Nagel G, Jaensch A, Ineichen A, Tsai MY, Schaffner E, Probst-Hensch NM, Schindler C, Ragettli MS, Vilier A, Clavel-Chapelon F, Declercq C, Ricceri F, Sacerdote C, Galassi C, Migliore E, Ranzi A, Cesaroni G, Badaloni C, Forastiere F, Katsoulis M, Trichopoulou A, Keuken M, Jedynska A, Kooter IM, Kukkonen J, Sokhi RS, Vineis P, Brunekreef B. 2015. Natural-cause mortality and long-term exposure to particle components: an analysis of 19 European cohorts within the Multi-Center ESCAPE Project. Environ Health Perspect 123:525–533; http://dx.doi.org/10.1289/ehp.1408095
Introduction
Studies have shown associations between long-term exposure to particulate matter air pollution and mortality, with exposure characterized as the mass concentration of particles ≤ 10 μm (PM10) or ≤ 2.5 μm (PM2.5) (Brook et al. 2010; Brunekreef and Holgate 2002). Although these studies have identified associations between exposure to particulate matter mass and mortality, there is still uncertainty as to which particle components are the most harmful. In addition, particulate matter effect estimates for long-term studies on mortality have differed among studies, and an explanation for this might be differences in the chemical composition of particulate matter (Hoek et al. 2013).
Particulate matter is a heterogeneous mixture varying spatially and temporally in chemical composition related to the sources from which it originates (Kelly and Fussell 2012; Stanek et al. 2011). Components for which associations with a range of health end points have been reported in epidemiological and/or toxicological studies include (transition) metals, elemental carbon, inorganic secondary aerosols (sulfate, nitrate), and organic components, but the evidence is not consistent (Kelly and Fussell 2012; Stanek et al. 2011).
Most studies that have assessed mortality in association with exposure to elemental components have been short-term exposure studies, and their results have varied considerably (Kelly and Fussell 2012; Stanek et al. 2011). Few studies have investigated mortality in relation to long-term exposure to particle components. A lack of spatially resolved elemental composition measurement data and exposure models for elemental composition partly explains this (De Hoogh et al. 2013). The U.S. Six Cities and American Cancer Society cohort studies have suggested an association between long-term exposure to sulfate and mortality (Dockery et al. 1993; Health Effects Institute 2000; Pope et al. 1995, 2002), but no other particle composition parameters have been evaluated in these studies. A cohort study, the California Teachers Study, found no statistically significant associations between all-cause mortality and long-term exposures to PM2.5 and several of its constituents, including elemental carbon, organic carbon (OC), sulfates, nitrates, iron, potassium, silicon, and zinc, although statistically significant associations were reported for more specific outcomes, especially ischemic heart disease mortality (Ostro et al. 2011).
In the framework of the multicenter ESCAPE (European Study of Cohorts for Air Pollution Effects) and TRANSPHORM (Transport related Air Pollution and Health impacts–Integrated Methodologies for Assessing Particulate Matter) projects, we added standardized exposure assessment for air pollution to mortality data from 19 ongoing cohort studies across Europe. Associations of particle mass (PM2.5, PM10, PMcoarse, and PM2.5 absorbance) and nitrogen oxides (NO2 and NOx) with natural-cause mortality in the same cohorts have been reported previously (Beelen et al. 2014). We found a statistically significant elevated hazard ratio for PM2.5 of 1.07 [95% confidence interval (CI): 1.02, 1.13] per 5 μg/m3. In this paper we report associations with particle elemental composition in 19 European cohorts to assess whether specific components are associated with natural-cause mortality. A second aim was to assess whether the previously reported association with PM2.5 mass was explained by specific elements. Associations of particle composition and cardiovascular mortality have been published separately (Wang et al. 2014).
Methods
As described earlier, the association between natural-cause mortality and particle components was analyzed in each cohort separately, following the analysis protocol of the ESCAPE study (Beelen et al. 2014). A common STATA script (StataCorp, College Station, TX, USA) was used which was explained in a training workshop for all local analysts. Cohort-specific results were sent to the coordinating institute [the Institute for Risk Assessment Sciences (IRAS), Utrecht University] for central evaluation. Cohort-specific effect estimates were combined by random-effects meta-analysis. Pooling of the cohort data was not possible due to data transfer and privacy issues.
Study populations. Nineteen cohorts from 12 countries across Europe were selected (Table 1 and Figure 1; see also Supplemental Material “Description of each cohort and study area”). The study areas of most cohorts consisted of a large city with surrounding smaller rural communities. Some cohorts included large regions of the country such as EPIC-MORGEN (European Prospective Investigation into Cancer and Nutrition– Monitoring Project on Risk Factors for Chronic Diseases) in the Netherlands, and the VHM&PP (Vorarlberg Health Monitoring & Promotion Programme) cohort in Austria. All included cohort studies were approved by the institutional medical ethics committees and undertaken in accordance with the Declaration of Helsinki. Each cohort study followed the rules for ethics and data protection set up in the country in which they were based. All participants gave consent according to national rules.
Table 1.
Description of the included cohort studies.
| Cohorta | n Totalb | n NMc | Age (years) at baseline (mean ± SD) | Baseline period | Total follow-up time in person-years (mean follow-up) | Study area description |
|---|---|---|---|---|---|---|
| See Supplemental Material, “Description of each cohort and study area,” for full names of cohorts. aOrder of cohorts is north to south gradient. bTotal study population: number of observations with complete data for all model 3 (main model) covariates. cNumber of deaths from natural-cause mortality. | ||||||
| FINRISK, Finland | 10,224 | 602 | 47.9 ± 13.2 | 1992; 1997; 2002; 2007 | 108,434 (10.6) | Greater Helsinki Area and Turku city and its rural surroundings |
| HUBRO, Norway | 18,102 | 1,182 | 48.3 ± 15.2 | 2000–2001 | 173,798 (9.6) | City of Oslo |
| SNAC-K, Sweden | 2,401 | 395 | 70.3 ± 8.1 | 2001–2004 | 15,568 (6.5) | City of Stockholm |
| SALT/Twin gene, Sweden | 5,473 | 581 | 58.0 ± 9.9 | 1998–2002 | 47,767 (8.7) | Stockholm County |
| 60-y/IMPROVE, Sweden | 3,612 | 303 | 60.4 ± 0.1 | 1997–1999 | 40,612 (11.2) | Stockholm County |
| SDPP, Sweden | 7,408 | 248 | 47.1 ± 5.0 | 1992–1998 | 102,831 (13.9) | Stockholm County |
| DCH, Denmark | 35,458 | 3,770 | 56.7 ± 4.4 | 1993–1997 | 469,571 (13.2) | City of Copenhagen and surrounding areas |
| EPIC-MORGEN, Netherlands | 16,446 | 795 | 43.9 ± 10.9 | 1993–1997 | 217,722 (13.2) | Cities of Amsterdam, Maastricht, and Doetinchem and surrounding rural areas |
| EPIC-PROSPECT, Netherlands | 15,670 | 1,269 | 57.7 ± 6.0 | 1993–1997 | 202,809 (12.9) | City of Utrecht and surrounding rural areas |
| SALIA, Germany | 4,352 | 618 | 54.5 ± 0.6 | 1985–1987; 1990–1994 | 81,093 (18.6) | Areas in the cities of Dortmund, Duisburg, Essen, Gelsenkirchen, and Herne situated in the Ruhr Area and the adjacent towns Borken and Dülmen |
| EPIC-Oxford, UK | 8,598 | 443 | 45.0 ± 13.1 | 1993–2001 | 110,097 (12.6) | Urban and rural areas in a buffer of 10 km around London–Oxford area |
| KORA, Germany | 8,399 | 673 | 49.5 ± 13.8 | 1994–1995; 1999–2001 | 88,592 (10.5) | City of Augsburg and two adjacent rural counties |
| VHM&PP, Austria | 117,824 | 13,081 | 41.9 ± 14.9 | 1985–2005 | 2,039,328 (17.3) | State of Vorarlberg, excluding high mountain areas (> 600 m) and areas within 300 m of state border |
| SAPALDIA, Switzerland | 1,250 | 65 | 42.0 ± 11.9 | 1991 | 20,294 (16.2) | City of Lugano |
| E3N, France | 10,915 | 516 | 53.0 ± 6.8 | 1993–1996 | 147,021 (13.5) | City of Paris and surrounding rural areas |
| EPIC-Turin, Italy | 7,261 | 302 | 50.4 ± 7.5 | 1993–1998 | 97,549 (13.4) | City of Turin |
| SIDRIA-Turin, Italy | 5,054 | 129 | 44.2 ± 6.2 | 1999 | 55,667 (11.0) | City of Turin |
| SIDRIA-Rome, Italy | 9,177 | 239 | 44.3 ± 6.0 | 1999 | 102,856 (11.2) | City of Rome |
| EPIC-Athens, Greece | 4,192 | 255 | 49.4 ± 11.7 | 1994–1999 | 46,852 (11.2) | Greater Athens area |
Figure 1.
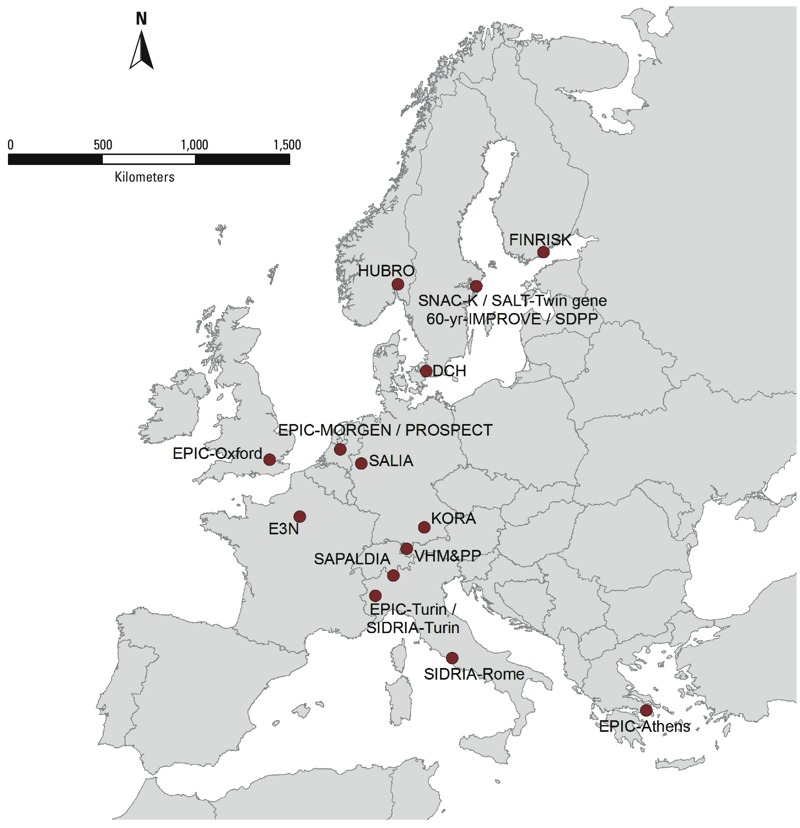
Cohort locations in which elements were measured.
Mortality outcome definition. In all cohorts, follow-up was based upon linkage to mortality registries. Natural-cause mortality was defined on the basis of the underlying cause of death recorded on death certificates as ICD-9 (International Classification of Diseases, 9th Revision) codes 001–779 and ICD-10 (10th Revision) codes A00–R99.
Exposure assessment. Particle composition concentrations at the baseline residential addresses of study participants were estimated by land use regression models following a standardized procedure described elsewhere (Beelen et al. 2013; De Hoogh et al. 2013; Eeftens et al. 2012a). Measurements of PM2.5 and PM10 were performed at 20 sites in each of the study areas. Within each study area, each of the 20 sites was measured during three 2-week periods (during summer, winter, and an intermediate season) within 1 year. The total measurement period over all study areas was between October 2008 and May 2011. PM filters were weighed before and after each measurement centrally at IRAS, Utrecht University, and were then sent to Cooper Environmental Services (Portland, OR, USA) to detect elements. All filters were analyzed for elemental composition using X-ray fluorescence (XRF) (De Hoogh et al. 2013). The three 2-week measurements were averaged, adjusting for temporal trends using data from a background monitoring site with continuous data (Cyrys et al. 2012; De Hoogh et al. 2013; Eeftens et al. 2012b).
In ESCAPE we a priori selected 8 of the 48 measured elements for further epidemiological evaluation based upon evidence of health effects (toxicity), representation of major anthropogenic sources, a high percentage of detected samples (> 75%), and good precision of measurements [coefficient of variation < 10% for all elements, except nickel (Ni) and vanadium (V) due to low concentration levels]. We selected copper (Cu), iron (Fe), and zinc (Zn) mainly for (non-tailpipe) traffic emissions; sulfur (S) for long-range transport; Ni and V for mixed oil burning/industry; silicon (Si) for crustal material; and potassium (K) for biomass burning (Viana et al. 2008). Elements may have multiple sources, so they do not necessarily represent single sources.
Predictor variables for nearby traffic intensity, population/household density, and land use were derived from geographic information systems (GIS), and were evaluated to explain spatial variation of annual average concentrations using land use regression modeling. If values of predictor variables for the cohort addresses were outside the range of values for the monitoring sites, values were truncated to the minimum and maximum values at the monitoring sites. Truncation was performed to prevent unrealistic predictions (e.g., related to too small distance to roads in GIS) and because we did not want to extrapolate the derived model beyond the range for which it was developed. Truncation has been shown to improve predictions at independent sites (Wang et al. 2012).
The results of the land use regression models were then used to estimate ambient particle composition concentration at the participants’ baseline addresses. A detailed description of the land use regression models for each of the eight elements is presented in Supplemental Material, Tables S1–S9.
Statistical analyses. Cohort-specific analyses. Cox proportional hazards models were used for the cohort specific analyses following the analysis protocol in the ESCAPE study (Beelen et al. 2014). Age was used as the time scale because of evidence of better adjustment for potential confounding by age (Thiébaut and Bénichou 2004). Censoring occurred at the time of death for non-natural causes, emigration, loss to follow-up for other reasons, or at end of follow-up, whichever came first. Air pollution exposure was analyzed as a linear time-invariant variable. Potential confounders were available from questionnaires at baseline. We specified three confounder models with increasing levels of adjustment a priori. Confounder models were selected based on previous cohort studies of air pollution and mortality and availability of data in a majority of the cohorts. The specific variables included as model covariates are listed for each cohort in Supplemental Material Tables S10–S28. Model 1 included only age (time axis), sex, and calendar time [year(s) of enrollment, continuous for baseline periods of ≤ 5 years]. Model 2 added the following individual-level variables (as available for the individual cohorts): smoking status (never/former/current), smoking intensity, smoking duration, environmental tobacco smoke, fruit intake, vegetables intake, alcohol consumption (linear and squared term), body mass index (BMI; linear and squared term), educational level (low, medium, high), occupational class (white/blue collar classification), employment status, and marital status. Model 3 added area-level socioeconomic status (SES) variables, including mean income, percentage of people with a low income, unemployment rate, and educational level or deprivation index, which were defined for most of the cohorts at the neighborhood or municipality level (see Supplemental Material, Tables S10–S28, for details).
Model 3 was selected as the main confounder model. Only subjects with complete information for model 3 variables were included in the analyses.
Two-pollutant models were conducted for each element by adjusting for particle mass (PM2.5, PM10, PMcoarse), PM2.5 absorbance, NO2, NOx, and other elements in separate models. Because two pollutants may reflect the same source, two-pollutant models representing the independent effect of two pollutants may be difficult to interpret. Therefore, each two-pollutant model was restricted to data from studies for which the correlation between the two pollutants was ≤ 0.7.
In sensitivity analyses, we added prevalent hypertension and physical activity to model 3, and additionally adjusted for the classical cardiovascular risk factors prevalent diabetes and cholesterol level. Extended confounder models were used in sensitivity analyses because some potential effects of air pollution might be mediated (e.g., hypertension) or affected (e.g, physical activity) by these factors.
All cohort-specific analyses were done in STATA versions 10–12.
Meta-analysis. Meta-analyses of cohort-specific effect estimates were conducted using the DerSimonian–Laird method with random effects (DerSimonian and Laird 1986). To keep exposure contrasts broadly comparable among pollutants, we estimated hazard ratios (HRs) and 95% CIs for fixed increments corresponding to the mean difference between the 10th and 90th percentiles of measured pollutant concentrations across all study areas. Heterogeneity among cohorts was quantified by the I2 statistic and tested by the chi-square test from Cochran’s Q-statistic (Higgins and Thompson 2002).
We tested whether effect estimates differed for cohorts for which the land use regression model cross-validation explained variance was smaller or larger than 50% by computing the chi-square test of heterogeneity. In addition, we tested whether effect estimates differed by region of Europe (North: Sweden, Norway, Finland, Denmark; West and Middle: United Kingdom, the Netherlands, Germany, France, Austria, and Switzerland; South: Italy and Greece). We did not perform effect modification analyses for individual-level variables because this paper focuses on differences in effect estimates related to elemental composition. Only sex was an effect modifier for the association between PM2.5 and natural mortality in the same cohorts (Beelen et al. 2014).
All tests were two-sided and p-values of < 0.05 were deemed statistically significant.
All meta-analyses were conducted in STATA, version 12.1.
Results
Characteristics of the study population. The total study population consisted of 291,816 participants contributing 4,168,461 person-years at risk (average time of follow-up, 14.3 years), of whom 25,466 died from a natural cause during follow-up (Table 1). Cohorts were recruited mostly in the 1990s. Cohorts differed in the number of participants, the mean baseline age, and the availability of specific covariate data (Table 2; see also Supplemental Material, Tables S10–S28). Age, sex, smoking status (current, former, or never smoker), and an area-level SES variable were available for all cohorts. Smoking intensity (average cigarettes/day) and duration (years of smoking) were available as continuous variables for all cohorts except the VHM&PP (Vorarlberg state) and E3N (Etude Epidémiologique auprès de femmes de la Mutuelle Générale de l’Education Nationale; Paris and surrounding rural areas) cohorts, for which only smoking status was available. VHM&PP had data on occupation and employment status, but not on education. On average, we had complete model 3 covariate information for > 90% of cohort participants.
Table 2.
Population characteristics of the included cohort studies at baseline.
| Cohorta | Percent women | Percent never smokers | Cigarettes/dayb | Years of smokingb | BMI (kg/m2)b | Fruit intakec | Alcohol intaked | Percent married/living with partner | Percent low educational level | Percent employed/self-employed |
|---|---|---|---|---|---|---|---|---|---|---|
| NA, not available or available with large number of missings (e.g., BMI in SALIA and smoking variables in E3N). See Supplemental Material, “Description of each cohort and study area,” for full names of cohorts. A detailed description of each cohort can be found in Supplemental Material, Tables S10–S28. aOrder of cohorts is north to south gradient. bMean ± SD. cMean ± SD (g/day) or percentage reporting daily fruit consumption. For SDPP it is percentage daily/weekly fruit consumption. dMean ± SD (g/day) or percentage reporting daily alcohol consumption. For FINRISK it is number of glasses of alcoholic drink during last week. For SDPP it number of glasses of alcoholic drinks per day. For HUBRO it is the percentage reporting weekly alcohol consumption. | ||||||||||
| FINRISK, Finland | 54 | 45 | 3.8 ± 7.8 | 8.6 ± 12.2 | 26.4 ± 4.6 | 66 | 0.9 ± 1.3 | 70 | 31 | 69 |
| HUBRO, Norway | 56 | 46 | 6.8 ± 8.4 | 11.6 ± 14.4 | 25.7 ± 4.1 | 40 | 51 | 50 | 18 | 73 |
| SNAC-K, Sweden | 60 | 44 | 7.1 ± 9.5 | 9.8 ± 15.2 | 26.0 ± 4.1 | NA | 22 | 54 | 21 | 29 |
| SALT/Twin gene, Sweden | 56 | 39 | 8.5 ± 9.7 | 16.7 ± 17.3 | 28.6 ± 4.1 | NA | NA | 68 | 22 | NA |
| 60-y/IMPROVE, Sweden | 53 | 41 | 8.0 ± 9.1 | 15.2 ± 16.4 | 26.8 ± 4.2 | 64 | 8.9 ± 9.7 | 72 | 28 | 51 |
| SDPP, Sweden | 62 | 37 | 8.5 ± 8.8 | 12.3 ± 12.4 | 25.6 ± 4.0 | 92 | 1.3 ± 1.9 | 84 | 26 | 92 |
| DCH, Denmark | 54 | 36 | 6.3 ± 10.4 | 18.7 ± 17.1 | 26.0 ± 4.1 | 183.2 ± 151.2 | 21.7 ± 22.8 | 69 | 30 | 80 |
| EPIC-MORGEN, Netherlands | 54 | 35 | 10.4 ± 11.1 | 14.3 ± 13.7 | 25.2 ± 4.0 | 171.9 ± 129.2 | 12.7 ± 18.0 | 68 | 12 | NA |
| EPIC-PROSPECT, Netherlands | 100 | 45 | 5.7 ± 7.4 | 15.2 ± 16.5 | 25.5 ± 4.1 | 231.6 ± 139.2 | 9.0 ± 12.4 | 77 | 22 | NA |
| SALIA, Germany | 100 | 75 | 2.6 ± 6.6 | 4.4 ± 10.5 | NA | NA | NA | NA | 29 | NA |
| EPIC-Oxford, UK | 75 | 60 | 5.5 ± 8.8 | 7.3 ± 11.5 | 24.3 ± 4.3 | 253.6 ± 216.5 | 10.0 ± 12.3 | 67 | 34 | 77 |
| KORA, Germany | 51 | 44 | 9.2 ± 13.3 | 12.0 ± 14.2 | 27.2 ± 4.6 | 60 | 16.3 ± 22.3 | 76 | 13 | 58 |
| VHM&PP, Austria | 56 | 70 | NA | NA | 24.8 ± 4.3 | NA | NA | 68 | NA | 69 |
| SAPALDIA, Switzerland | 56 | 45 | 11.1 ± 14.4 | 11.1 ± 13.0 | 23.8 ± 3.9 | NA | NA | 58 | 11 | 81 |
| E3N, France | 100 | 49 | NA | NA | 22.8 ± 3.3 | 236.2 ± 162.5 | 12.4 ± 15.4 | NA | 5 | NA |
| EPIC-Turin, Italy | 48 | 43 | 7.2 ± 8.2 | 17.6 ± 16.3 | 25.3 ± 3.8 | 318.2 ± 182.2 | 18.1 ± 20.3 | 86 | 44 | NA |
| SIDRIA-Turin, Italy | 52 | 38 | 9.3 ± 10.2 | 11.3 ± 10.6 | NA | NA | NA | 95 | 18 | 72 |
| SIDRIA-Rome, Italy | 53 | 35 | 10.1 ± 10.5 | 11.7 ± 10.4 | NA | NA | NA | 100 | 45 | NA |
| EPIC-Athens, Greece | 55 | 40 | 1.7 ± 15.0 | 10.8 ± 13.1 | 27.5 ± 4.5 | 402.6 ± 258.2 | 9.2 ± 14.5 | 78 | 24 | 67 |
Air pollution exposure. Substantial variations of estimated annual mean concentrations at participant addresses were observed within and between the majority of cohorts and elements [Figure 2 (for PM2.5 elemental composition concentrations); see also Supplemental Material, Figure S1 (for PM10 elemental composition concentrations)]. The largest within-cohort contrasts were found for Cu, Fe, Si, and Zn, with the largest contrasts generally found in South European study areas. The main exception was Si, for which the largest within-area contrast was found in the North European study areas (see Supplemental Material, Figure S1). The smallest within-cohort contrasts were found for S. Higher concentrations of most elements were observed in southern study areas. Estimated annual mean S in PM2.5 concentrations, for example, show a steady increasing north–south gradient with averages from 635 ng/m3 for FINRISK, Finland, to 1,626 ng/m3 for EPIC-Athens, Greece. Correlations between elements and particle mass varied considerably among elements and cohorts; average correlations between elements and mass (in the same PM size fraction) were approximately 0.5, with a range from about 0.3 to about 0.7 (see Supplemental Material, Table S29), indicating that associations with individual elements could be estimated after adjusting for PM mass in most cohorts.
Figure 2.
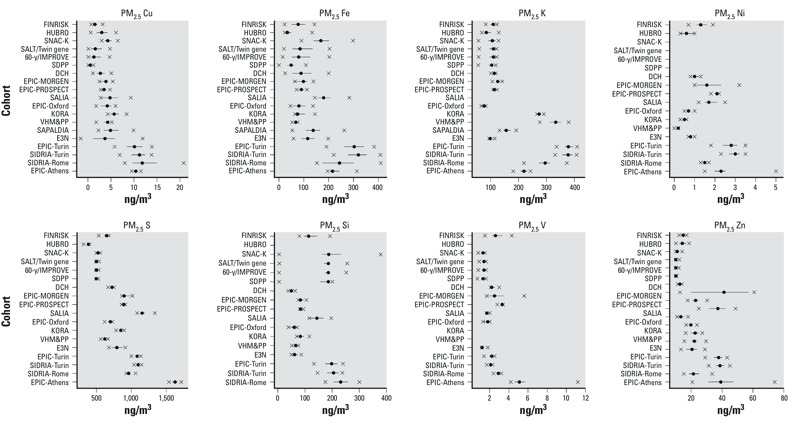
Estimated annual mean PM2.5 elemental composition concentrations (ng/μg3) at participant addresses in each cohort. The solid circle and bars shows the median and 25th and 75th percentiles of elemental composition concentrations; the x shows the 5th and 95th percentile values.
Good land use regression exposure models were developed for Cu, Fe, and Zn in both fractions (PM10 and PM2.5), as indicated by average cross-validation explained variances (R2) between 55% and 81%, although R2 values varied between areas (see Supplemental Material, Tables S1–S9). Traffic variables were the dominant predictors, reflecting non-tailpipe emissions (De Hoogh et al. 2013). In general, models for the other elements performed moderately well, with average cross-validation R2 values between about 50% and about 60%. However, for PM2.5 S the average cross-validation R2 was 30% (range, 2–67%; see Supplemental Material, Table S6), consistent with the relatively low spatial variation of S concentrations.
Single-pollutant results. Positive HRs were estimated for almost all exposures, with a statistically significant association for PM2.5 S (HR = 1.14; 95% CI: 1.06, 1.23 per 200 ng/m3) (Table 3, Figure 3; see also Supplemental Material, Figures S2–S15). Borderline statistically significant associations (p > 0.05 and ≤ 0.10) were found for PM2.5 Si (HR = 1.09; 95% CI: 0.99, 1.09 per 100 ng/m3), PM10 Ni (HR = 1.09; 95% CI: 1.00, 1.19 per 2 ng/m3), and PM10 K (HR = 1.03; 95% CI: 1.00, 1.06 per 100 ng/m3). The evidence for an association was smaller for Zn and V. Estimates did not support associations of mortality with the non-tailpipe traffic pollutants Cu and Fe. In general, HRs based on confounder model 1 (adjusted for calendar year and sex only) were the highest, whereas HRs moved closer to the null after adjustment for individual-level confounders (model 2). Sensitivity analyses showed that smoking variables especially were responsible for this decrease (Beelen et al. 2014). In contrast, additional adjustment for area-level SES variables (model 3) had relatively little influence on HRs (Table 3). Cohort-specific HRs for PM2.5 S were > 1 for all cohorts, except for SDPP (Stockholm Diabetes Prevention Program) and KORA (Cooperative Health Research in the Augsburg Region) (Figure 3). There was no statistical evidence of heterogeneity among the individual cohort effect estimates for PM2.5 S (I2 = 0, p = 0.94). Average correlation between PM2.5 S and PM10 S over the different cohorts was 0.56 with a range of 0.18–1.00 (data not shown). The HR for PM10 S was also positive (HR = 1.09; 95% CI: 0.99, 1.19 per 200 ng/m3), although not statistically significant (Figure 3).
Table 3.
Association between natural-cause mortality and exposure to elemental composition of PM: results from random-effects meta-analyses [HR (95% CI)] using main confounder models 1, 2, and 3.a
| Exposure | No. of cohorts | Model 1b | Model 2b | Model 3b | p-Value model 3 | I2 (p-value)c |
|---|---|---|---|---|---|---|
| aHRs are presented for the following increments: 5 ng/m3 PM2.5 Cu, 20 ng/m3 PM10 Cu, 100 ng/m3 PM2.5 Fe, 500 ng/m3 PM10 Fe, 10 ng/m3 PM2.5 Zn, 20 ng/m3 PM10 Zn, 200 ng/m3 PM2.5 S, 200 ng/m3 PM10 S, 1 ng/m3 PM2.5 Ni, 2 ng/m3 PM10 Ni, 2 ng/m3 PM2.5 V, 3 ng/m3 PM10 V, 100 ng/m3 PM2.5 Si, 500 ng/m3 PM10 Si, 50 ng/m3 PM2.5 K, and 100 ng/m3 PM10 K. bModel 1 was adjusted for sex and calendar time; model 2 was also adjusted for smoking status, smoking intensity, smoking duration, environmental tobacco smoke, fruit intake, vegetables intake, alcohol consumption, BMI, educational level, occupational class, employment status, marital status; and model 3 was further adjusted for area-level SES. cI2 and Cochran’s Q-test for heterogeneity for model 3. dNo modeled air pollution estimates were available for SAPALDIA. eNo modeled air pollution estimates were available for SNAC-K, SALT/Twin gene, 60-y/IMPROVE, SDPP. fNo modeled air pollution estimates were available for HUBRO, SAPALDIA. gNo modeled air pollution estimates were available for HUBRO, KORA, VHM&PP, SAPALDIA. hNo modeled air pollution estimates were available for HUBRO, SAPALDIA, EPIC-Athens. iNo modeled air pollution estimates were available for SALIA. jNo modeled air pollution estimates were available for HUBRO. | ||||||
| PM2.5 Cu | 19 | 1.08 (1.00, 1.17) | 1.00 (0.94, 1.06) | 0.98 (0.92, 1.04) | 0.54 | 16.4 (0.25) |
| PM10 Cu | 19 | 1.07 (1.00, 1.15) | 1.02 (0.95, 1.08) | 1.01 (0.95, 1.07) | 0.83 | 43.5 (0.02) |
| PM2.5 Fe | 19 | 1.12 (1.05, 1.18) | 1.04 (0.99, 1.10) | 1.03 (0.98, 1.09) | 0.20 | 10.1 (0.33) |
| PM10 Fe | 19 | 1.08 (1.02, 1.15) | 1.03 (0.97, 1.09) | 1.02 (0.97, 1.08) | 0.44 | 43.9 (0.02) |
| PM2.5 Zn | 19 | 1.07 (1.00, 1.15) | 1.04 (1.00, 1.08) | 1.03 (0.99, 1.08) | 0.17 | 21.4 (0.19) |
| PM10 Zn | 19 | 1.09 (1.01, 1.17) | 1.04 (1.00, 1.09) | 1.04 (0.99, 1.09) | 0.18 | 31.5 (0.09) |
| PM2.5 S | 18d | 1.29 (1.11, 1.50) | 1.16 (1.08, 1.25) | 1.14 (1.06, 1.23) | 0.003 | 0.0 (0.94) |
| PM10 S | 18d | 1.23 (1.07, 1.42) | 1.09 (1.00, 1.19) | 1.09 (0.99, 1.19) | 0.11 | 29.8 (0.11) |
| PM2.5 Ni | 14e | 1.12 (1.02, 1.22) | 1.05 (0.97, 1.15) | 1.05 (0.97, 1.13) | 0.27 | 20.3 (0.23) |
| PM10 Ni | 17f | 1.22 (1.05, 1.41) | 1.09 (1.00, 1.19) | 1.09 (1.00, 1.19) | 0.08 | 30.3 (0.12) |
| PM2.5 V | 15g | 1.22 (1.03, 1.44) | 1.07 (0.95, 1.20) | 1.07 (0.93, 1.23) | 0.35 | 32.5 (0.11) |
| PM10 V | 18d | 1.07 (0.93, 1.24) | 1.04 (0.96, 1.12) | 1.03 (0.95, 1.12) | 0.46 | 5.7 (0.39) |
| PM2.5 Si | 16h | 1.18 (1.03, 1.34) | 1.10 (0.99, 1.21) | 1.09 (0.99, 1.09) | 0.10 | 31.6 (0.11) |
| PM10 Si | 18d | 1.13 (1.00, 1.28) | 1.04 (0.97, 1.11) | 1.03 (0.97, 1.11) | 0.37 | 47.6 (0.01) |
| PM2.5 K | 18i | 1.06 (0.98, 1.14) | 1.05 (0.99, 1.11) | 1.07 (0.99, 1.15) | 0.12 | 28.6 (0.13) |
| PM10 K | 18j | 1.05 (0.99, 1.12) | 1.03 (1.00, 1.06) | 1.03 (1.00, 1.06) | 0.08 | 0.0 (0.74) |
Figure 3.
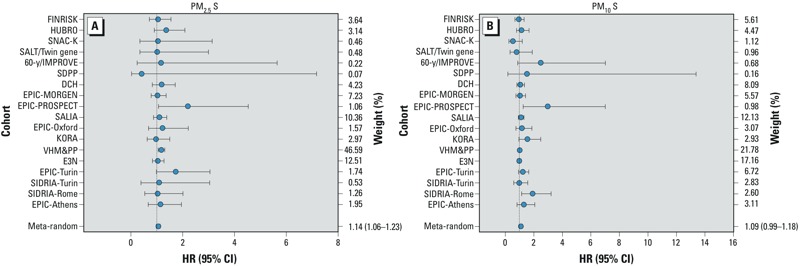
Adjusted hazard ratio (HR) between natural-cause mortality and (A) a 200-ng/m3 increment in PM2.5 S and (B) a 200-ng/m3 increment in PM10 S (using main model 3): results from cohort-specific analyses and from random-effects meta-analyses.
For the other elements there was more heterogeneity among individual cohort effect estimates, although for most elements heterogeneity was low (I2 < 25%) to moderate (I2 = 25–50%) and not statistically significant (Table 3; see also Supplemental Material, Figures S2–S15).
Two-pollutant results. Results from the two-pollutant models suggested that the associations of elements were generally robust to adjustment for other elements and pollutants (see Supplemental Material, Figures S16 and S17). We also investigated whether the previously reported association between natural-cause mortality and PM2.5 mass (Beelen et al. 2014) was robust to adjustment for PM2.5 S. The median correlation between PM2.5 and PM2.5 S over the cohorts was 0.53 (range, 0.26–0.86) (see Supplemental Material, Table S29). The combined effect estimate for PM2.5 S from the two-pollutant model adjusted for PM2.5 did not differ from the single-pollutant model estimate (Table 4). However, the HR for PM2.5 was closer to the null and statistically nonsignificant when adjusted for PM2.5 S (HR = 1.07; 95% CI: 1.02, 1.13 vs. HR = 1.02; 95% CI: 0.96, 1.09 per 5 μg/m3). In addition, Table 4 shows the two-pollutant model results for PM2.5 Si, PM10 K, and PM10 Ni because the single-pollutant associations for these elements were borderline statistically significant. After adjustment for PM2.5 S, associations with PM10 Ni (HR = 1.09; 95% CI: 0.98, 1.22 vs. HR = 1.06; 95% CI: 0.95, 1.18 per 2 ng/m3) were slightly reduced (Table 4).
Table 4.
Results from random-effects meta-analyses from single-pollutant and two-pollutant models for association with natural-cause mortality (using main model 3) [HR (95% CI)].a
| Exposure | Adjusted for | Single-pollutant | Two-pollutant |
|---|---|---|---|
| aLimited to studies for which correlation between two pollutants was < 0.7. HRs are presented for the following increments: 200 ng/m3 PM2.5 S, 5 μg/m3 PM2.5, 2 ng/m3 PM10 Ni, 100 ng/m3 PM2.5 Si, 100 ng/m3 PM10 K. bFINRISK and SAPALDIA not included. cHUBRO, SALIA, and SAPALDIA not included. dHUBRO, SAPALDIA, and EPIC-Athens not included. eFINRISK, HURBO, and SIDRIA-Rome not included. | |||
| PM2.5 Sb | PM2.5 | 1.15 (1.06, 1.24) | 1.13 (1.03, 1.24) |
| PM2.5 Sc | PM10 Ni | 1.14 (1.04, 1.25) | 1.14 (1.04, 1.25) |
| PM2.5 Sd | PM2.5 Si | 1.14 (1.05, 1.23) | 1.13 (1.04, 1.22) |
| PM2.5 Se | PM10 K | 1.16 (1.06, 1.27) | 1.15 (1.05, 1.26) |
| PM2.5b | PM2.5 S | 1.07 (1.02, 1.13) | 1.02 (0.96, 1.09) |
| PM10 Nic | PM2.5 S | 1.09 (0.98, 1.22) | 1.06 (0.95, 1.18) |
| PM2.5 Sid | PM2.5 S | 1.09 (0.98, 1.21) | 1.08 (0.97, 1.20) |
| PM10 Ke | PM2.5 S | 1.03 (0.99, 1.08) | 1.02 (0.98, 1.06) |
Sensitivity analyses. Additional adjustment for hypertension and physical activity, and for diabetes and cholesterol, had little effect on combined HRs compared with model 3 HRs (see Supplemental Material, Table S30).
Because the VHM&PP cohort had a weight of approximately 47% in the pooled PM2.5 S analyses (Figure 3), we conducted a sensitivity analyses without this cohort. Confidence intervals became slightly wider, but PM2.5 S HR remained similar after exclusion of the VHM&PP cohort (HR = 1.12; 95% CI: 1.01, 1.24 compared with HR = 1.14; 95% CI: 1.06, 1.23 before exclusion). Effect estimates for all elements were similar for the cohorts for which the land use regression model cross-validation explained variance was < 50% or > 50% (e.g., for PM2.5 S, HR = 1.12; 95% CI: 1.01, 1.25; n = 14 and HR = 1.16; 95% CI: 1.05, 1.28; n = 4, respectively) (p = 0.65). PM2.5 S effect estimates were also not statistically different between the cohorts in different regions: 1.17 (95% CI: 0.94, 1.45) for North (n = 7), 1.13 (95% CI: 1.04, 1.23) for West and Middle (n = 7), and 1.27 (95% CI: 0.92, 1.75) for South (n = 4) (p = 0.78). For the other elements also no significant differences were found between effect estimates based on validation R2 or region (data not shown).
Discussion
Long-term exposure to PM2.5 S was positively associated with natural-cause mortality, with no indication of heterogeneity among individual cohort effect estimates.
The association between PM2.5 S and mortality was robust to adjustment for co-pollutants including PM2.5 mass. The PM2.5 mass effect estimate was reduced and became statistically nonsignificant when adjusted for PM2.5 S.
Comparison of S mortality associations with previous studies. Only a few studies have estimated associations of mortality with long-term exposures to particle components. Sulfate has received the most attention in epidemiological studies. Elemental sulfur is assumed to be present as a marker for sulfate. Several cohort studies suggested an association between long-term exposure to sulfate and mortality. An association between sulfate and mortality was reported in the Harvard Six Cities study (Dockery et al. 1993). The adjusted HR comparing the cities with the highest and lowest sulfate concentrations (a contrast of 8 μg/m3) was 1.26 (95% CI: 1.08, 1.47), corresponding to an HR of 1.03 (95% CI: 1.01, 1.05) per 1 μg/m3. Within the initial American Cancer Society (ACS) study, the adjusted HR of all-cause mortality for areas with the highest and lowest concentrations of sulfate (19.9 μg/m3 contrast) was 1.15 (95% CI: 1.09, 1.22) (Pope et al. 1995), resulting in an HR of 1.01 (95% CI: 1.00, 1.01) per 1 μg/m3. Pope et al. (2002) investigated additional years of follow-up in the ACS study and estimated an HR for sulfate and natural mortality of about 1.01 (95% CI: 1.00, 1.01) per 1 μg/m3 (Pope et al. 2002). A recent analysis of the ACS cohort reported that sulfate, elemental carbon, and ozone all had positive and statistically significant associations with all-cause mortality, but sulfate had the most robust association (HR = 1.01; 95% CI: 1.00, 1.01 per 1 μg/m3) (Smith et al. 2009). In the recent National Particle Component Toxicity (NPACT) initiative, a similar risk for the association between sulfur exposure and all-cause mortality (HR = 1.09 per 200 ng/m3) was estimated using ACS cohort data (Lippmann et al. 2013). Within the NPACT initiative also data from the Women’s Health Initiative–Observational Study (WHI-OS) cohort were used to study the association with cardiovascular mortality and (fatal and nonfatal) cardiovascular events (Vedal et al. 2013). Long-term exposure to air pollutant concentrations was estimated with a national exposure spatial model. No association was found with all cardiovascular deaths and sulfur (HR = 1.01, 95% CI: 0.92, 1.12 per 0.25 μg/m3), but the association with cardiovascular events was statistically significant (HR 1.09; 95% CI: 1.05, 1.14 per 0.25 μg/m3). A cohort study of approximately 45,000 active and former female public school professionals in the California Teachers Study investigated the association between mortality and long-term exposures to PM2.5 and several of its constituents, including elemental carbon, organic carbon, sulfates, nitrates, Fe, K, Si, and Zn (Ostro et al. 2011). Participants whose residential addresses were within 8 or 30 km of a monitor collecting PM2.5 constituent data were included in the analyses. No statistically significant associations between all-cause mortality and PM2.5 mass or any of its measured constituents were reported. The HR for sulfate was 1.06 (95% CI: 0.97, 1.16) for an interquartile range contrast of 2.2 μg/m3, corresponding to an HR of 1.03 per 1 μg/m3. However, the HR for sulfate and ischemic heart disease mortality was 1.48 (95% CI: 1.20, 1.82) for an interquartile range contrast of 2.2 μg/m3.
The estimated effect of PM2.5 S on natural-cause mortality in our study population (HR = 1.14 per 0.2 μg/m3 S) corresponds to an HR of 1.24 (95% CI: 1.10, 1.41) per 1 μg/m3 sulfate, assuming all S is present as sulfate (sulfate to S ratio of 3). Our effect estimate is thus much larger than the estimate from the U.S. cohort studies that investigated total mortality. A major difference between our study and these U.S. studies is that our study was based upon contrasts within study areas, whereas the U.S. studies focused on between-area contrasts. Sulfate is mostly formed in the atmosphere by oxidation of gaseous sulfur dioxide (SO2) emissions [U.S. Environmental Protection Agency (EPA) 2004]. Sulfate is concentrated in fine particles that can be transported over long distances, resulting in a high regional background with typically small spatial variation within metropolitan areas (U.S. EPA 2004). Most of our study areas comprised a major city and smaller surrounding communities, with some cohorts covering a larger area (e.g., the Vorarlberg region). Consistently, the exposure contrast in our study was much smaller than in the U.S. studies, both for the S measurements (De Hoogh et al. 2013) and cohort exposures. Measured urban background PM2.5 S concentrations were on average 9% higher than regional background concentrations. Concentrations at traffic sites were only 2% higher than at urban background sites. Predictor variables in the land use regression models for PM2.5 S included especially traffic at various scales, population or address density, and urban green space (see Supplemental Material, Tables S1–S9). Presumably because of the small measured within-study area contrasts, the average cross-validation R2 was 30% for PM2.5 S, with a range of 7–70%. Because land use regression models were developed for each study area separately, we could not exploit between-study area variations in PM2.5 S that would have improved the model performance. In the ESCAPE study, which focuses on within-area contrasts in pollution, these models reflect a combination of variation in primary sulfate emissions and secondary sulfate formation (De Hoogh et al. 2013). Depending on meteorological conditions, SO2 to sulfate conversion rates of 1–5% per hour have been estimated (U.S. EPA 2004), implying that some conversion already occurs at scales of 10–50 km (a typical wind speed is 10 km/hr). A study in Berlin, Germany, documented measurable sulfate formation within 50 km of the source (Lammel et al. 2005).
PM2.5 mass also was associated with mortality in the three U.S. studies (Dockery et al. 1993; Pope et al. 1995, 2002). However, sulfate concentrations were highly correlated with PM2.5 mass concentrations in the U.S studies, and thus associations between mortality and sulfate may be difficult to distinguish from associations between mortality and PM2.5 mass. The median correlation between estimated PM2.5 and PM2.5 S over the 19 cohorts in our study was 0.53 (range, 0.26–0.86), which made it possible to estimate mutually adjusted associations with PM2.5 S and PM2.5 mass. The lower correlation in our study probably reflects the finer spatial resolution at which concentrations were estimated. The median correlation of measured within-area contrast in PM2.5 and S was very similar (0.6) to the median correlation within cohorts, suggesting that the moderate model R2 values for S did not artificially induce the low correlation.
Another study that reported evidence of effects of sulfur on mortality was an intervention study in Hong Kong that studied the effects of limiting the sulfur content of fuel oils used in both power plants and vehicles (Hedley et al. 2002). Initial findings indicated a decrease in sulfur dioxide that was associated with prompt and persistent reductions in mortality, suggesting that higher mortality before the limitation may have been related to sulfate and/or SO2. Subsequent analysis, however, revealed that the reduction in SO2 was highly correlated with reductions in both V and Ni derived from residual oil emissions (Hedley et al. 2006). In our study correlations between elements were smaller, suggesting that the association between PM2.5 S and mortality is not explained by exposure to other elements such as V and Ni. This is also supported by the robust HRs for PM2.5 S after adjustment for co-pollutants. However, we cannot rule out the possibility that the association with PM2.5 S may be attributable to other correlated PM components.
Interpretation of S associations. Toxicological studies have provided little support for a causal effect of sulfate, despite fairly consistent associations in epidemiological studies (Kelly and Fussell 2012). Sulfate may indirectly affect health, for example, by solubilizing metals and thereby increasing their bioavailability, and by catalyzing the formation of secondary organic PM (Kelly and Fussell 2012). We identified associations with small-scale spatial variations in S and we speculate that this may reflect an influence of primary combustion from S-containing fuels and serve as a marker of within-city air pollution differences, that is, between city centers and surrounding areas.
Associations with other elements. None of the other elements evaluated in our analysis were significantly associated with mortality, though HRs were positive for almost all elements. There was greater heterogeneity among individual cohort effect estimates for elements other than PM2.5 S, though for most elements the heterogeneity was not statistically significant. There was little evidence of associations with Cu and Fe, which were mainly selected as markers of (non-tailpipe) traffic emissions. Source apportionment studies conducted elsewhere have reported that Fe is associated mostly with road dust and brake abrasion, whereas Cu is associated with tire and brake abrasion (reviewed by Viana et al. 2008). Our land use regression models had the best fit for these elements because traffic predictors were available and traffic sites were overrepresented in the measurement campaign. Therefore, we believe that the lack of an association in our study is unlikely to be attributable to exposure measurement error. In our previous analysis of the same set of cohorts, we estimated nonsignificant positive HRs for NO2 (1.01; 95% CI: 0.99, 1.03 per 10 μg/m3), NOx (1.02; 95% CI: 1.00, 1.04 per 20 μg/m3), and PM2.5 aborbance (1.02; 95% CI: 0.97, 1.07 per 10–5/m), pollutants affected by tailpipe emissions (Beelen et al. 2014).
In single-pollutant models we found borderline statistically significant positive associations between natural-cause mortality and Si in PM2.5, but not Si in PM10, despite substantially higher Si concentrations in the coarse fraction. Source apportionment studies suggest that Si is associated primarily with crustal material in resuspended soil and road dust (Viana et al. 2008). In our previous analyses we did not find an association between mortality and coarse particles (Beelen et al. 2014).
Source apportionment studies suggest that both V and Ni are linked to crude oil and derived mainly from shipping emissions, and that K is linked to biomass burning (Viana et al. 2008). In single-pollutant models we found borderline statistically significant associations for Ni and K in PM10. General industry and port land use were the only predictor variables available for Ni and V in our exposure models. A specific predictor variable for wood smoke was not available (De Hoogh et al. 2013). The lack of more specific predictors in the V, Ni, and K exposure models may have limited our ability to detect element-specific mortality associations for these PM components.
Strengths and limitations. Our study has several strengths: large sample size, broad European coverage, adjustment for a wide range of potential (individual) confounders, and multiple elements with a high percentage of detected samples (> 75%) and good precision of measurements in all 19 cohorts (coefficient of variation < 10% for all elements, except Ni and V due to low concentration levels). An advantage compared with previous long-term studies of elemental composition that compared between-city variation and ignored within-city variation is that we could estimate spatial contrasts at much smaller spatial scales using land use regression models that were developed in a standardized way for all 19 cohorts.
We used data from measurements in 2008–2011 to develop land use regression models that were applied to addresses at baseline, mostly in the mid-1990s. Emissions of S in Europe have been reduced following a series of control measures during the last two decades (Fowler et al. 2007). However, recent studies in the Netherlands; Rome, Italy; the United Kingdom; and Vancouver, Canada, have reported that the spatial contrast of nitrogen dioxide air pollution has been stable over ≥ 10 years (Cesaroni et al. 2012; Eeftens et al. 2011; Gulliver et al. 2013; Wang et al. 2013). In addition, spatial models for black smoke and sulfur dioxide in the United Kingdom provided reasonable predictions, even going back to the 1960s, with a correlation between 1962 and 1991 concentrations of 0.53 for black smoke and 0.26 for SO2 (Gulliver et al. 2011). However, we cannot rule out the possibility that spatial contrasts for specific components may have been less stable over time.
We did not account for residential mobility during follow-up in the current analyses. In our previous analysis of natural-cause mortality in association with particulate matter and NOx in the same cohorts, HRs for participants who moved during follow-up did not differ significantly from HRs for the complete study population, though they were slightly higher (Beelen et al. 2014).
We investigated eight a priori–selected elements in both the PM2.5 and PM10 fractions, so there might be some spurious associations due to multiple comparisons. In addition, correlated elements may act as surrogates for elements that are the actual causes of increased mortality. Although for almost all elements HRs were positive, the association with PM2.5 S clearly was the strongest. In addition, the PM2.5 S mortality associations were robust to adjustment for other elements, as well as particle mass. In addition, cohort-specific PM2.5 S HRs were almost all > 1 (Figure 3), and there was no significant heterogeneity among cohort-specific PM2.5 S HRs (Table 3), indicating consistency among the cohort results. The strength of the association, its consistency among cohorts, and its robustness to adjustment decrease the likelihood that the association is a spurious finding.
Differences in the accuracy of exposure estimates could bias effect estimates and standard errors for individual elements. When the measurements of two elements are correlated, part of the association between mortality and the element with more measurement error could be shifted to the estimate of association with the element with less measurement error. Accuracy of exposure estimates may depend on both the precision of the measurements and the performance of the exposure models. The eight selected elements were detected in a large majority (> 75%) of the samples. Measurement precision was best for S, Cu, and Fe but poorer for Ni and V, especially in study areas with low concentration levels (De Hoogh et al. 2013).
Conclusion
In conclusion, long-term exposure to PM2.5 S was associated with natural-cause mortality. This association was robust to adjustment by other pollutants, including particle mass.
Editor’s Note: The Advance Publication of this article contained the wrong version of Figure 2. The correct version is included in this article. EHP regrets the error.
Supplemental Material
Acknowledgments
We thank M. Tewis, M. Oldenwening, G. Mosler, M. Cirach, A. de Nazelle, B. Anwander, M. Wallner, C. Bernhard, E. Bechter, A. Kaufmann, as well as G. Dür, P. Crosignani, J. Wickmann, D. Raffaele, M. Gilardetti, T. Kuhlbusch, U. Quass, M. Vossoughi, S. Bucci, G. Costa, L.-J.S. Liu, P. Taimisto, and A. Pennanen for their help with exposure assessment and data management within ESCAPE.
Footnotes
The research leading to these results received funding from the European Community’s Seventh Framework Program (FP7/2007–2011) projects: ESCAPE (211250) and TRANSPHORM (ENV.2009.1.2.2.1). For the Finnish part, additional funding came from the Academy of Finland (project no. 129317). Mortality, area-level socioeconomic status, and building data were provided by Statistics Finland. For HUBRO, the data collection was conducted as part of the Oslo Health Study 2000–2001 and financed by the Norwegian Institute of Public Health, the University of Oslo, and the Municipality of Oslo. Financial support for the combined work with the Stockholm studies was received from the Swedish Environmental Protection Agency, the Swedish Heart–Lung Foundation, and the Swedish Council for Working Life and Social Research. The Swedish Ministry for Higher Education financially supports the Swedish Twin Register. SALT was supported by the Swedish Council for Working Life and Social Research and a grant from the National Institutes of Health (NIH; AG-08724). TwinGene was supported by the Swedish Research Council (M-2005-1112), GenomEUtwin (EU/QLRT-2001-01254 and QLG2-CT-2002-01254), NIH DK U01-066134, The Swedish Foundation for Strategic Research (SSF), and the Heart and Lung Foundation (20070481). The EPIC-MORGEN and EPIC-PROSPECT cohorts were supported by the Dutch Ministry of Public Health, Welfare and Sports (VWS), Dutch Prevention Funds, Dutch ZON (Zorg Onderzoek Nederland), and Statistics Netherlands. The baseline study and the mortality follow-up of SALIA was funded by the Ministry of the Environment of North Rhine-Westfalia (Germany). The KORA research platform and the MONICA Augsburg studies were initiated and financed by the Helmholtz Zentrum München, German Research Center for Environmental Health, which is funded by the German Federal Ministry of Education and Research and by the State of Bavaria. The VHM&PP is supported by the State of Vorarlberg, Austria. SAPALDIA received funds from the The Swiss National Science Foundation (33CSCO-134276/1, 33CSCO-108796, 3247BO-104283, 3247BO-104288, 3247BO-104284, 3247-065896, 3100-059302, 3200-052720, 3200-042532, and 4026-028099); the Federal Office for Forest, Environment and Landscape; and several Federal and Cantonal authorities. SAPALDIA received support in mortality record linkage from the Swiss National Cohort Study (108806 and 134273). Mortality data for SAPALDIA were provided by the Swiss National Cohort Study, which performed probabilistic record linkage between anonymized SAPALDIA data, including available information on vital status and date of death, on the one hand, and census and mortality data of the Federal Office of Statistics on the other hand. The SIDRIA cohort studies were co-funded by the Italian Ministry of Health.
The authors declare they have no actual or potential competing financial interests.
References
- Beelen R, Hoek G, Vienneau D, Eeftens M, Dimakopoulou K, Pedeli X, et al. Development of NO2 and NOx land use regression models for estimating air pollution exposure in 36 study areas in Europe—the ESCAPE project. Atmos Environ. 2013;72:10–23. [Google Scholar]
- Beelen R, Raaschou-Nielsen O, Stafoggia M, Andersen ZJ, Weinmayr G, Hoffmann B, et al. Effects of long-term exposure to air pollution on natural-cause mortality: an analysis of 22 European cohorts within the multicentre ESCAPE project. Lancet. 2014;383:785–795. doi: 10.1016/S0140-6736(13)62158-3. [DOI] [PubMed] [Google Scholar]
- Brook RD, Rajagopalan S, Pope CA, III, Brook JR, Bhatnagar A, Diez-Roux AV, et al. Particulate matter air pollution and cardiovascular disease: an update to the scientific statement from the American Heart Association. Circulation. 2010;121:2331–2378. doi: 10.1161/CIR.0b013e3181dbece1. [DOI] [PubMed] [Google Scholar]
- Brunekreef B, Holgate ST. Air pollution and health. Lancet. 2002;360:1233–1242. doi: 10.1016/S0140-6736(02)11274-8. [DOI] [PubMed] [Google Scholar]
- Cesaroni G, Porta D, Badaloni C, Stafoggia M, Eeftens M, Meliefste K, et al. 2012Nitrogen dioxide levels estimated from land use regression models several years apart and association with mortality in a large cohort study. Environ Health 1148; 10.1186/1476-069X-11-48 [DOI] [PMC free article] [PubMed] [Google Scholar]
- Cyrys J, Eeftens M, Heinrich J, Ampe C, Armengaud A, Beelen R, et al. Variation of NO2 and NOx concentrations between and within 36 European study areas: results from the ESCAPE study. Atmos Environ. 2012;62:374–390. [Google Scholar]
- De Hoogh K, Wang M, Adam M, Badaloni C, Beelen R, Birk M, et al. Development of land use regression models for particle composition in twenty study areas in Europe. Environ Sci Technol. 2013;47:5778–5786. doi: 10.1021/es400156t. [DOI] [PubMed] [Google Scholar]
- DerSimonian R, Laird N.1986, Meta-analysis in clinical trials. Control Clin Trials 7177–188. [DOI] [PubMed] [Google Scholar]
- Dockery DW, Pope CA, III, Xu X, Spengler JD, Ware JH, Fay ME, et al. An association between air pollution and mortality in six U.S. cities. N Engl J Med. 1993;329:1753–1759. doi: 10.1056/NEJM199312093292401. [DOI] [PubMed] [Google Scholar]
- Eeftens M, Beelen R, De Hoogh K, Bellander T, Cesaroni G, Cirach M, et al. Development of land use regression models for PM2.5, PM2.5 absorbance, PM10 and PMcoarse in 20 European study areas; results of the ESCAPE project. Environ Sci Technol. 2012a;46:11195–11205. doi: 10.1021/es301948k. [DOI] [PubMed] [Google Scholar]
- Eeftens M, Beelen R, Fischer P, Brunekreef B, Meliefste K, Hoek G. Stability of measured and modelled spatial contrasts in NO2 over time. Occup Environ Med. 2011;68:765–770. doi: 10.1136/oem.2010.061135. [DOI] [PubMed] [Google Scholar]
- Eeftens M, Tsai MY, Ampe C, Anwander B, Beelen R, Bellander T, et al. Spatial variation of PM2.5, PM10, PM2.5 absorbance and PMcoarse concentrations between and within 20 European study areas and the relationship with NO2—results of the ESCAPE project. Atmos Environ. 2012b;62:303–317. [Google Scholar]
- Fowler D, Smith R, Muller J, Cape JN, Sutton M, Erisman JW, et al. Long term trends in sulphur and nitrogen deposition in Europe and the cause of non-linearities. Water Air Soil Poll. 2007;7:41–47. [Google Scholar]
- Gulliver J, de Hoogh K, Hansell A, Vienneau D. Development and back-extrapolation of NO2 land use regression models for historic exposure assessment in Great Britain. Environ Sci Technol. 2013;47:7804–7811. doi: 10.1021/es4008849. [DOI] [PubMed] [Google Scholar]
- Gulliver J, Morris C, Lee K, Vienneau D, Briggs D, Hansell A. Land use regression modeling to estimate historic (1962–1991) concentrations of black smoke and sulfur dioxide for Great Britain. Environ Sci Technol. 2011;45:3526–3532. doi: 10.1021/es103821y. [DOI] [PMC free article] [PubMed] [Google Scholar]
- Health Effects Institute. Cambridge MA: Health Effects Institute; 2000. Reanalysis of the Harvard Six Cities Study and the American Cancer Society Study of Particulate Air Pollution and Mortality: A Special Report of the Institute’s Particle Epidemiology Reanalysis Project. [Google Scholar]
- Hedley AJ, McGhee SM, Wong CM, Barron B, Chau PK, Chau J, et al. Hong Kong: Civic Exchange; 2006. Air Pollution: Costs and Paths to a Solution. [DOI] [PubMed] [Google Scholar]
- Hedley AJ, Wong CM, Thach TQ, Ma S, Lam TH, Anderson HR. Cardiorespiratory and all-cause mortality after restrictions on sulphur content of fuel in Hong Kong: an intervention study. Lancet. 2002;360:1646–1652. doi: 10.1016/s0140-6736(02)11612-6. [DOI] [PubMed] [Google Scholar]
- Higgins JPT, Thompson SG. Quantifying heterogeneity in a meta-analysis. Stat Med. 2002;21:1539–1558. doi: 10.1002/sim.1186. [DOI] [PubMed] [Google Scholar]
- Hoek G, Krishnan MK, Beelen R, Peters A, Ostro B, Brunekreef B, et al. 2013Long-term air pollution exposure and cardio- respiratory mortality: a review. Environ Health 1243; 10.1186/1476-069X-12-43 [DOI] [PMC free article] [PubMed] [Google Scholar]
- Kelly FJ, Fussell JC. Size, source and chemical composition as determinants of toxicity attributable to ambient particulate matter. Atmos Environ. 2012;60:504–526. [Google Scholar]
- Lammel G, Engelhardt T, Leip A, Neusüß C, Röhrl A, Wehner B, et al. Transformation of aerosol chemical properties due to transport over a city. J Atmos Chem. 2005;51:95–117. [Google Scholar]
- Lippmann M, Chen LC, Gordon T, Ito K, Thurston GD. Boston, MA: Health Effects Institute; 2013. National Particle Component Toxicity (NPACT) Initiative: Integrated Epidemiologic and Toxicologic Studies of the Health Effects of Particulate Matter Components. Research report 177. [PubMed] [Google Scholar]
- Ostro B, Reynolds P, Goldberg D, Hertz A, Burnett RT, Shin H, et al. Assessing long-term exposure in the California Teachers Study. Environ Health Perspect. 2011;119:A242–A243. [Google Scholar]
- Pope CA, III, Burnett RT, Thun MJ, Calle EE, Krewski D, Ito K, et al. Lung cancer, cardiopulmonary mortality, and long-term exposure to fine particulate air pollution. JAMA. 2002;287:1132–1141. doi: 10.1001/jama.287.9.1132. [DOI] [PMC free article] [PubMed] [Google Scholar]
- Pope CA, III, Thun MJ, Namboodiri MM, Dockery DW, Evans JS, Speizer FE, et al. Particulate air pollution as a predictor of mortality in a prospective study of U.S. adults. Am J Respir Crit Care Med. 1995;151(3 Pt 1):669–674. doi: 10.1164/ajrccm/151.3_Pt_1.669. [DOI] [PubMed] [Google Scholar]
- Smith KR, Jerrett M, Anderson HR, Burnett RT, Stone V, Derwent R, et al. Public health benefits of strategies to reduce greenhouse-gas emissions: health implications of short-lived greenhouse pollutants. Lancet. 2009;374:2091–2103. doi: 10.1016/S0140-6736(09)61716-5. [DOI] [PMC free article] [PubMed] [Google Scholar]
- Stanek LW, Sacks JD, Dutton SJ, Dubois JB. Attributing health effects to apportioned components and sources of particulate matter: an evaluation of collective results. Atmos Environ. 2011;45:5655–5663. [Google Scholar]
- Thiébaut ACM, Bénichou J. Choice of time-scale in Cox’s model analysis of epidemiologic cohort data: a simulation study. Stat Med. 2004;23:3803–3820. doi: 10.1002/sim.2098. [DOI] [PubMed] [Google Scholar]
- U.S. EPA (U.S. Environmental Protection Agency). Washington, DC: U.S. EPA; 2004. Air Quality Criteria for Particulate Matter (Final Report, October 2004). EPA 600/P-99/002aF-bF. [Google Scholar]
- Vedal S, Campen MJ, McDonald JD, Kaufman JD, Larson TD, Sampson PD, et al. Boston, MA: Health Effects Institute; 2013. National Particle Component Toxicity (NPACT) Report on Cardiovascular Effects. Research report 178. [PubMed] [Google Scholar]
- Viana M, Kuhlbusch TAJ, Querol X, Alastuey A, Harrison RM, Hopke PK, et al. Source apportionment of particulate matter in Europe: a review of methods and results. J Aerosol Sci. 2008;39:827–849. [Google Scholar]
- Wang M, Beelen R, Eeftens M, Meliefste K, Hoek G, Brunekreef B. Systematic evaluation of land use regression models for NO2. Environ Sci Technol. 2012;46:4481–4489. doi: 10.1021/es204183v. [DOI] [PubMed] [Google Scholar]
- Wang M, Beelen R, Stafoggia M, Raaschou-Nielsen O, Andersen ZJ, Hoffmann B, et al. Long-term exposure to elemental constituents of particulate matter and cardiovascular mortality in 19 European cohort studies: results from the ESCAPE and TRANSPHORM projects. Environ Int. 2014;66:97–106. doi: 10.1016/j.envint.2014.01.026. [DOI] [PubMed] [Google Scholar]
- Wang R, Henderson SB, Sbihi H, Allen RW, Brauer M. Temporal stability of land use regression models for traffic-related air pollution. Atmos Environ. 2013;64:312–319. [Google Scholar]
Associated Data
This section collects any data citations, data availability statements, or supplementary materials included in this article.