Abstract
Introduction
The increasing use of molecular imaging probes as biomarkers in oncology emphasizes the need for robust and stable methods for quantifying tracer uptake in PET imaging. The primary motivation for this research was to find an accurate method to quantify the total tumor uptake. Therefore we developed a histogram-based method to calculate the background subtracted lesion (BSL) activity and validated BSL by comparing the quantitative consistency with the total lesion glycolysis (TLG) in phantom and patient studies.
Methods
A thorax phantom and a PET-ACR quality assurance phantom were scanned with increasing FDG concentrations. Volumes of interest (VOIs) were placed over each chamber. TLG was calculated with a fixed threshold at SUV 2.5 (TLG2.5) and a relative threshold at 42% of SUVmax (TLG42%). The histogram for each VOI was built and BSL was calculated. Comparison with the total injected FDG activity (TIA) was performed using concordance correlation coefficients (CCC) and the slope (a). Fifty consecutive patients with FDG-avid lung tumors were selected under an IRB waiver. TLG42%, TLG2.5 and BSL were compared to the reference standard calculating CCC and the slope.
Results
In both phantoms, the CCC for lesions with a TIA ≤ 50ml*SUV between TIA and BSL was higher and the slope closer to 1 (CCC=0.933, a=1.189), than for TLG42% (CCC=0.350, a=0.731) or TLG2.5 (CCC=0.761, a=0.727). In 50 lung lesions BSL had a slope closer to 1 compared to the reference activity than TLG42% (a=1.084 vs 0.618 - for high activity lesions) and also closer to 1 than TLG2.5 (a=1.117 vs 0.548 - for low activity lesions).
Conclusion
The histogram based BSL correlated better with TIA in both phantom studies than TLG2.5 or TLG42%. Also in lung tumors, the BSL activity is overall more accurate in quantifying the lesion activity compared to the two most commonly applied TLG quantification methods.
Keywords: Histogram, PET quantification, tumor uptake, Phantom, total lesion glycolysis
1. Introduction
The increasing use of molecular imaging probes as biomarkers in oncologic disease emphasizes the demand for accurate methods to quantify radiotracer uptake on positron emission tomography (PET) [1-3]. The most commonly used method to quantify [18F]-Fluorodeoxyglucose (FDG) uptake on PET is the maximum standard uptake value (SUVmax) [4]. The ease of use and an excellent inter-observer reproducibility in combination with promising results for SUV as a prognostic factor lead to its wide acceptance and routine clinical use [5]. However, there are many disadvantages to the use of SUVmax, particularly the variability introduced by the high statistical noise associated with a single voxel analysis [6-8]. Alternative quantitative metrics that take into account not just the SUVmax but also the tracer uptake of the entire lesion have been proposed. One such metric is the total lesion glycolysis (TLG), defined as the metabolic tumor volume multiplied with the average SUV (SUVmean) [9]. The metabolic tumor volume is determined as the total number of voxels within a volume of interest that have uptake above a predetermined SUV threshold, though the particular threshold has not been standardized.
Different SUV thresholds have been suggested, the two most commonly used methods include all voxels above 42% of the SUVmax (TLG42%) or all voxels with an SUV over 2.5 (TLG2.5)[1, 10-12]. Increasing enthusiasm for the use of TLG is evidenced through multiple reports describing its superiority over SUVmax as a predictive and prognostic biomarker in multiple tumors of the head and neck[13], gynecological organs[12, 14], lung[15, 16] and esophagus[17]. In fact, a PubMed search revealed that 34 of the total 59 papers analyzing TLG in FDG PET were published between January and December 2012.
Despite several advantages of TLG over SUVmax, there is on ongoing debate about the optimal SUV threshold that should be used for TLG calculation [18-20]. Various relative or absolute thresholds have been suggested to calculate TLG; most cut-offs were derived from single publications and none of them have been validated with phantom data. In fact, several studies have shown that the use of relative or absolute thresholds is not accurate enough to delineate the metabolically active tumor volume for radiation therapy planning [21-23]. Some of the difficulties with absolute or relative thresholds are that they do not consider background activity. Furthermore, those methods are designed to delineate tumor edges and therefore do not include spill-out activity from the tumor, what leads to an underestimation of the total tumor activity.
The primary motivation was to find an accurate metric to quantify the total uptake in a tumor. To do this we are proposing the transposition of image data into a histogram. The preprocessing of the volume of interest into a probability density function of the tumor plus that of background provides a number of advantages: background activity can be reasonably approximated as normally distributed in a histogram, tumor activity is taken into account regardless of location and therefore motion artifacts or image noise is less crucial. Subtraction of a Gaussian fit to the background activity from a histogram would then allow calculation of a background subtracted lesion activity (BSL). BSL should incorporate the total lesion uptake including spill-out activity.
The purpose of this study was to evaluate BSL and compare it with TLG42% and TLG2.5 in 2 phantom studies and 50 patients with lung tumors. Lung tumors where chosen because they represent well-delineated tumors on unenhanced CT. Based on the tumor volume from CT recovery coefficient based metrics exist to assess total uptake beside the threshold based TLG, hence validation of BSL in patients was possible.
2. Materials and methods
Overview of phantom studies
As a first step, we compared the BSL, TLG42%, and TLG2.5 in two phantom studies with a wide range of different chamber sizes and activity concentrations. The true activities were calculated for each chamber and acquisition by multiplication of the known chamber volume with the injected FDG concentration, and were referred to as the total injected activity (TIA). TIA was the reference standard to compare the histogram based BSL with TLG2.5 and TLG42%.
Since there is no gold standard for TLG in real tumors we used the CT data to calculate a PET independent tumor volume that could be used as an alternative reference when using the recovery coefficient (RC) and the SUVmax to estimate the total tumor uptake (TLGRC). TLGRC was validated against TIA in the phantoms by multiplying the partial volume corrected maximum activity concentration and the known volume of the phantom chamber. Furthermore, the use of recovery coefficient has been shown to be accurate for small lung lesions whose volume can be measured via CT [24]. In this study the RC values were determined by a least squares fit of phantom data. Using data acquired on the GE DSTE PET/CT system with an IEC phantom these coefficients were found as a function of volume in ml, V, to be:
Based on the results of the phantom studies, surrogate references were defined for the total activity estimation in lung tumors in patients. For lesions with a high FDG activity TLG2.5 is expected to yield accurate results compared to TIA. It has been shown recently that TLG2.5 is correlating with outcome for bronchial carcinomas larger than 3 cm [25]. On the other hand, TLGRC is restricted to homogeneous lesions and therefore, in real tumors, more suitable for smaller lesions where PET images are more homogenous[26]. Therefore, both quantification metrics were validated against TIA in the two phantoms to find the appropriate cutoff point to minimize the relative error between TLG2.5 and TIA. For all lesions with a TLG below this threshold TLGRC served as reference, for the lesions above the threshold TLG2.5 was the reference standard. TLG42%, TLGRC, TLG2.5, and BSL were then compared to the surrogate reference.
BSL calculation
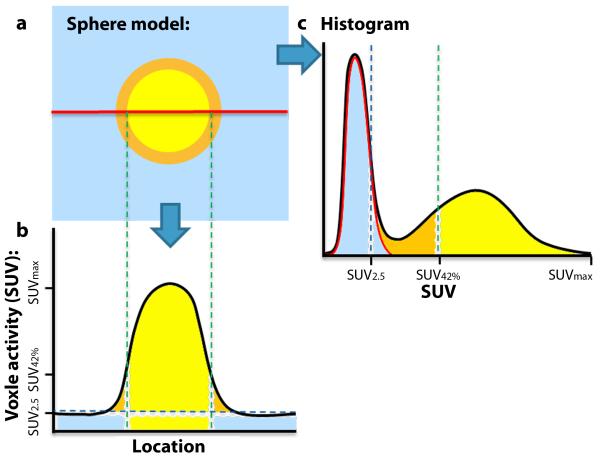
BSL is a new histogram based method to determine the tumor activity by subtraction of a Gaussian fit over the peak of the histogram from the VOI surrounding the tumor. The histograms represented the voxels of a VOI as a function of SUV and were binned via the Freedman–Diaconis rule[27]. In this case, because the activity distribution of the background region in the VOI is both large and relatively uniform, with respect to the tumor, the background forms a distinct peak in the histogram. The mean background activity of the surrounding tissue, SUVBG, was estimated by the mode of the histogram. A fitting region was then defined by the histogram bins located above the half maximum of the mode. The Gaussian fit (Fig. 1c, red line) over this region represents the background activity (Fig. 1a, b and c blue) and was subsequently subtracted from the histogram, after setting all negative values to zero. BSL was the sum of the remaining voxels (Fig. 1c, yellow and orange).
Fig. 1.
a Illustration of a sphere model with a yellow lesion, causing spillover (orange), embedded in background activity (blue). b The classical view for further segmentation illustrating that the 42% threshold will not incorporate spillover into tumor activity, since it was designed to determine the true tumor volume. c Transposition of all voxels into a histogram. Information about location is lost, but the probability of activity distribution in background leads to a peak, that can easily be determined. A Gaussian fit to the background region (red line) is calculated and delineates the background activity (blue). After subtraction of the Gaussian fit from the histogram, lesion and spillover activity remain and yield a value that correlates almost perfect with the true injected activity in phantoms with a CCC = 0.998.
Phantom Details
Two phantoms were used: the Society of Nuclear Medicine Clinical Trials Network (SNM-CTN) anthropomorphic thorax phantom, and the American College of Radiology (ACR) (flangeless Esser PET phantom™) cylindrical phantom with separately fillable cylinders. The SNM-CTN phantom was initially filled according to the SNM-CTN instructions and scanned with 555 MBq (15 mCi) entered as the injected dose, 163 cm (64 inches), and 63kg (140 lbs) for the patient height and weight (the actual activity concentrations and ratios are given in Table 1). In accordance with ACR guidelines the patient weight and injection were entered as a 70 kg patient with 444 MBq (12 mCi) injection (the actual activity concentrations and ratios are given in Table 1). The residual activities were accounted for both phantoms. In each of the four subsequent scans, the fillable chambers were drained and refilled with increasing activity concentrations (see Table 1 for the hot sphere activities and imaging times).
Table 1.
Acquisition times and activity concentrations for the SNM and ACR phantom tests.
| Scan Number | Scan Time | SNM Phantom Hot Cylinders (kBq/cc) |
Background (kBq/cc) |
Activity Ratios |
|---|---|---|---|---|
| 1 | 20:38 | 23.7 | 7.7 | 3.1 |
| 2 | 20:46 | 62.1 | 6.5 | 9.5 |
| 3 | 20:39 | 98.5 | 5.3 | 18.7 |
| 4 | 20:49 | 244.6 | 4.6 | 53.1 |
| 5 | 20:53 | 424.7 | 4.1 | 104.0 |
| Scan Number | Scan Time | ACR Phantom Hot Cylinders (kBq/cc) |
Background (kBq/cc) |
Activity Ratios |
|---|---|---|---|---|
| 1 | 19:36 | 11.4 | 5.9 | 1.9 |
| 2 | 19:57 | 32.3 | 5.2 | 6.2 |
| 3 | 20:15 | 51.0 | 4.7 | 10.9 |
| 4 | 20:32 | 94.2 | 4.2 | 22.5 |
| 5 | 20:51 | 158.6 | 3.7 | 42.8 |
Chamber volumes: 2, 4.5, 8.5, and 28.5 ml
Chamber volumes: 0.18, 3×0.52, 1.4, and 4.2 ml
Patient Selection, Preparation, and Acquisition
A waiver for informed consent requirement was granted by the Institutional Review Board. Fifty consecutive patients fulfilling the following inclusion criteria between January and March 2011 were retrospectively identified: (i) upper lobe lung tumors with FDG activity higher than background, (ii) to allow CT based volume detection lesions had to be well delineated on the low dose CT for attenuation correction, without significant abnormalities (e.g. pulmonary atelectasis or consolidation) near the tumor, (iii) FDG PET/CT scan performed in our institution using a GE DSTE PET/CT system (GE Medical Systems, Wisconsin). These criteria were required for validation purposes to use the recovery coefficient based TLGRC.
Scans were acquired approximately 1-hour post injection with a nominal 444 MBq (12 mCi) of FDG. A low-dose, attenuation correction CT scan (120–140 kV, approximately 80 mA) was acquired. This was followed by acquisition of PET emission images form the pelvis to the skull for 3 minutes per bed position with an 11-slice overlap.
Image reconstruction
The image reconstruction settings were identical for both the phantom and patient acquisitions. The images were reconstructed using our clinical settings: OSEM with 2 iterations with 20 subsets and 6.3 mm post reconstruction transaxial filtering and three-point [1 2 1] smoothing (Heavy) along the z-axis. All appropriate corrections were applied (i.e. attenuation, normalization, scatter, randoms from singles, decay, and dead-time).
Phantom data analysis
In the phantoms, a VOI was drawn around each chamber. The CT attenuation scans of the SNM-CTN phantom revealed air bubbles of varying sizes in chamber number 4; this chamber was therefore excluded from any further analysis. A total of 10 chambers were analyzed in five scans with increasing activities in the chambers. BSL, TLG42% and TLG2.5 were compared to TIA.
Patient data analysis
For 50 patients, one lesion was selected and a VOI was drawn around the tumor. Two readers followed the instructions for VOI placement as previously published [28]. In brief VOI size had to be slightly bigger than the tumor. For lesions with heterogeneous background (e.g. tumors abutting lung and mediastinal tissue) VOIs were adjusted to make sure that more of the background tissue with higher FDG activity was included (e.g. mediastinum). CT Volume of each lesion was determined using a manual volume segmentation tool from commercially available software (TeraRecon, Inc, Foster City, CA (USA)).
Statistical Analysis
The correlation of TLG42%, TLG2.5, and BSL with TIA in the phantom or the surrogate reference for the lung tumor data were calculated with several methods: A least-squares line fit with zero-intercept slope (a) was calculated for each TLG or BSL measure versus the reference value. For linearity the correlation (R2) was assessed. To test the statistical significance between the slopes for the various measures of TLG and the slope of BSL we calculated the Z-score and derived a two-tailed p-value from this score. Furthermore, the concordance correlation coefficient (CCC) [25] was calculated. For the significance of the CCC differences between the various TLG measures and BSL we performed a similar test on Z-transformed CCC estimates and their variances [29]. The inter-reader agreement for BSL was assessed using Pearson correlation coefficient as well as the method of Bland and Altman determined as the mean difference with adherent limits of agreement.
3. Results
BSL validation in phantoms
For all lesions, the correlation between TIA and BSL, TLG42% and TLG2.5 was similar, with CCCs 0.998, 0.906 and 0.996 respectively. The minimal error for TLG2.5 and TIA was for phantom chambers with an activity above 40-60 ml*SUV, we therefore selected 50 ml*SUV as cut-off for the further analysis of the lung tumors.
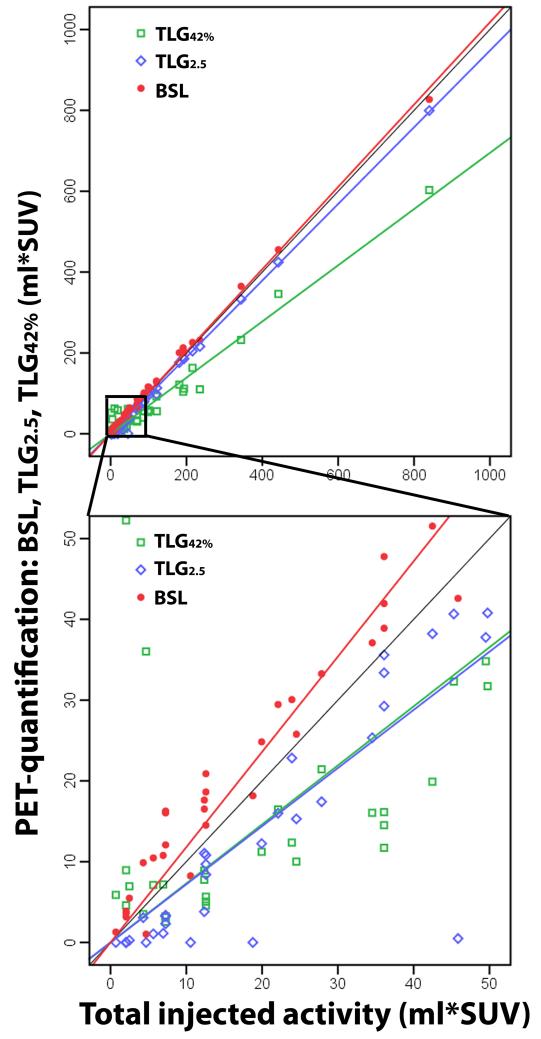
For lesions with a TIA ≤ 50 ml*SUV the correlation was excellent for BSL (CCC = 0.933) and the slope close to 1 (a = 1.189), but only good for TLG2.5 (CCC = 0.761) with a significantly lower slope (a = 0.727 versus 1.189, p < 0.001) (Table 2). TLG42% had a lower CCC for both groups TIA ≤ 50 and > 50 ml*SUV with 0.350 and 0.873, respectively. The slopes revealed a slight overestimation of BSL versus TIA for both groups with a slope of 1.015 or 1.189 (with high R2 values 0.981, 0.999), whereas TLG2.5 underestimated chambers with a TIA ≤ 50 ml*SUV (a = 0.727, R2 = 0.876), but was accurate for chambers with TIA > 50 ml*SUV (a = 0.952, R2 = 0.999). TLG42% significantly underestimated the activity in both groups with slopes of 0.694 and 0.731 (R2 values 0.0.511, 0.986, p < 0.001) (Fig. 2).
Table 2.
Correlation for the FDG-quantification measures with the total injected activity (TIA) for all phantom studies.
| Value: | TLG42% | TLG2.5 | TLGRC | BSL | |
|---|---|---|---|---|---|
| TLG2.5 ≤ 50 | Slope | 0.731 | 0.727 | 1.119 | 1.189 |
| R2 | 0.511 | 0.876 | 0.959 | 0.998 | |
| Slopes differ from BSL | p-value | <0.001 | <0.001 | 0.161 | |
| CCC | 0.350 | 0.761 | 0.931 | 0.933 | |
| CCC differs from BSL | p-value | <0.001 | 0.013 | 0.971 | |
| TLG2.5 > 50 | Slope | 0.694 | 0.952 | 1.127 | 1.015 |
| R2 | 0.986 | 0.999 | 0.991 | 0.998 | |
| Slopes differ from BSL | p-value | <0.001 | <0.001 | <0.001 | |
| CCC | 0.873 | 0.997 | 0.974 | 0.998 | |
| CCC differs from BSL | p-value | <0.001 | 0.702 | <0.001 |
TLG = Total lesion glycolysis, BSL = Background subtracted lesion activity
Fig. 2.
50 phantom chambers with three different PET quantification methods (BSL, TLG2.5 and TLG42%) compared to the total injected activity (TIA), calculated with the CT-Volume and the injected concentration. Illustrating the slopes and the excellent correlation of BSL with TIA for chambers with low (lower image: CCC 0.933) and high (upper image: CCC 0.998) activities, while TLG2.5 showed an excellent correlation for chambers with a TIA > 50 ml*SUV (CCC 0.997) and only a good to excellent correlation for chambers with TIA ≤ 50 ml*SUV (CCC 0.761).
The inter-reader variability for BSL measurements for phantom lesions was very low with a mean difference of −1.3 ± 6.1 SUV*ml; r2=0.998, p<0.001.
Recovery coefficient validation in phantoms
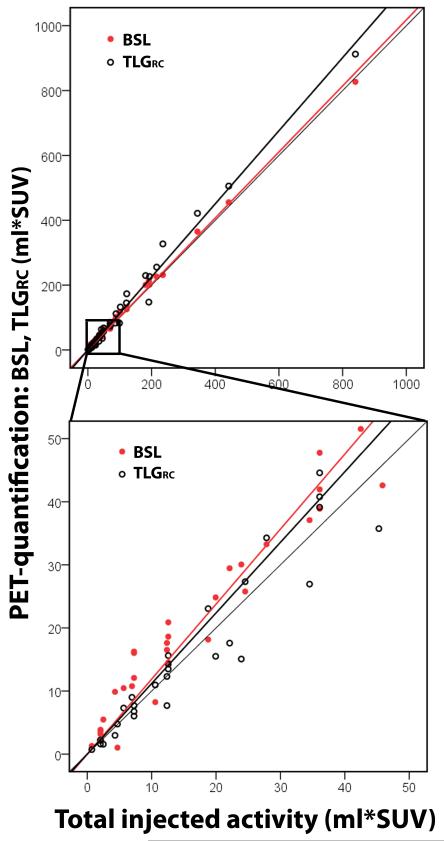
The volume and recovery coefficient corrected SUVmax based FDG quantification correlated almost perfect with TIA for both lesions with a TIA below or over 50 ml*SUV (CCC = 0.931-0.984) (Fig. 3, Table 2). The slope of TLGRC was not significantly different from BSL for lesions below 50 ml*SUV (a = 1.119 versus 1.189, p = 0.161).
Fig. 3.
50 phantom chambers with calculated TLGRC and BSL versus the total injected activity (TIA). TLGRC as a volume and SUVmax based measurement was validated as an alternative reference for lesions with FDG uptake under 50 ml*SUV. The Phantom results confirmed a high correlation of TLGRC with TIA.
Validation of BSL in lung tumors against TLGRC and TLG2.5
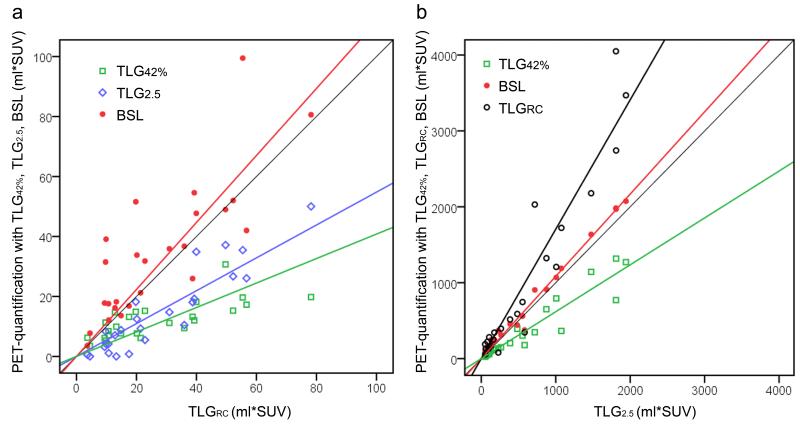
Of the 50 selected patients, 25 had a TLG2.5 ≤ 50 ml*SUV and 25 were above this threshold and were separated into two groups according to the phantom results (Figure 4). Lesion characteristics are given in Table 3. For group 1 (TLG2.5 ≤ 50 ml*SUV) the PET quantification metrics were compared with TLGRC (Fig. 5a). Both TLG2.5 and TLG42% underestimated the reference activity (a = 0.548 and 0.408, respectively), whereas BSL was very close to one (a = 1.117) and only slightly higher than TLGRC (Table 4). BSL also had the highest correlation (CCC 0.68) compared to TLGRC.
Fig. 4.
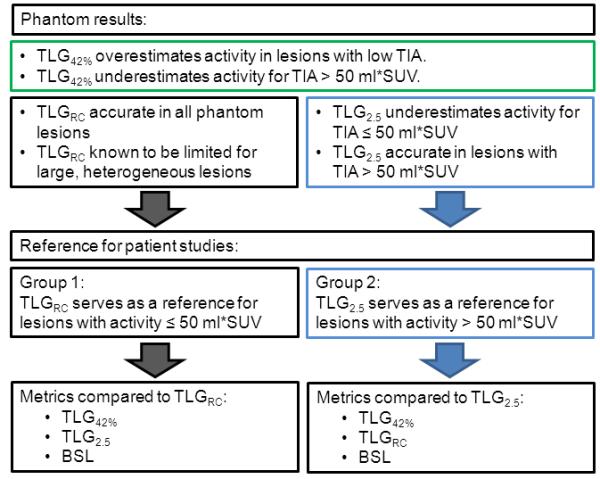
Diagram illustrating the selection of reference standards for the two patient groups based on results from the phantom study. Lesions with a total injected activity (TIA) over 50 ml*SUV were accurately quantified with TLG2.5, whereas TLG42% failed in both groups with high or low TIA.
Table 3.
50 lung tumors – lesion characteristics
| Median | Mean | SD | Range | |
|---|---|---|---|---|
| CT-Volume (cm3) | 5.9 | 31.5 | 64.4 | 0.6-385 |
| SUVmax | 10.7 | 11.3 | 6.8 | 1.5-35.7 |
| RC | 0.76 | 0.77 | 0.16 | 0.46-1 |
| TLGRC (ml*SUV) | 58.9 | 548 | 1089 | 3.6-4709 |
SD = Standard deviation, RC = Recovery coefficient, TLG = Total lesion glycolysis
Fig. 5.
a 25 lung lesions with a TLG2.5 ≤ 50 ml*SUV, compared to the reference standard TLGRC (CT volume * recovery coefficient corrected SUVmax). TLG42% and TLG2.5 underestimated the tumor activity. b 25 lung lesions with a TLG2.5 > 50 ml*SUV, where BSL and TLG42% were compared to TLG2.5. BSL had an almost perfect correlation (CCC = 0.987), while TLG42% underestimated the tumor activity.
Table 4.
Correlation for the FDG-quantification measures with the surrogate reference for the 50 lung lesions.
| Value: | TLG42% | TLG2.5 | TLGRC | BSL | |
|---|---|---|---|---|---|
| TLG2.5 ≤ 50 | Slope | 0.374 | 0.568 | 1.096 | |
| R2 | 0.850 | 0.926 | 0.860 | ||
| Slopes differ from BSL | p-value | < 0.001 | < 0.001 | ||
| CCC | 0.269 | 0.649 | 0.753 | ||
| CCC differs from BSL | p-value | 0.002 | 0.411 | ||
| TLG2.5 > 50 | Slope | 0.618 | 1.705 | 1.084 | |
| R2 | 0.942 | 0.947 | 0.993 | ||
| Slopes differ from BSL | p-value | < 0.001 | < 0.001 | ||
| CCC | 0.794 | 0.738 | 0.986 | ||
| CCC differs from BSL | p-value | < 0.001 | < 0.001 |
TLG = Total lesion glycolysis, BSL = Background subtracted lesion activity
For group 2 (TLG2.5 > 50 ml*SUV) TLG2.5 served as the reference activity, TLGRC overestimated the activities of the lesions with high activity substantially (a = 1.705), whereas TLG42% underestimated the reference activity (a = 0.618). BSL and TLG2.5 had an excellent correlation (CCC 0.987) with a slope of a = 1.084 (Fig. 5b, Table 4). An overview for all histograms with the corresponding cut off points for TLG42% (green), TLG2.5 (blue) and BSL (red) are given in Fig. 6.
Fig. 6.
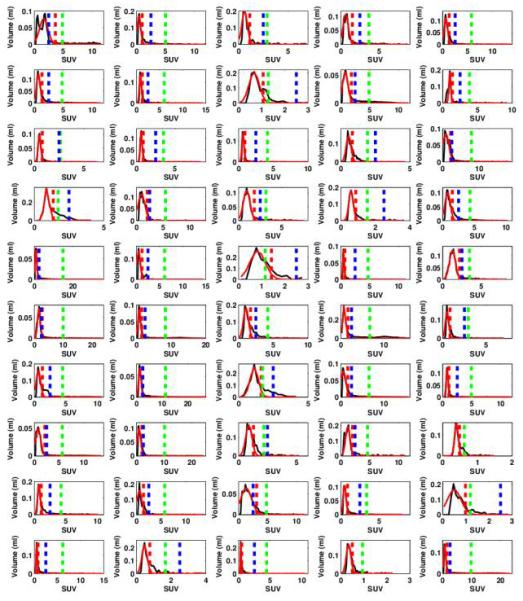
Overview for the 50 tumor VOIs drawn around the selected lung lesions, with the corresponding Histogram for each VOI with the Gaussian fit around the mode (red line) determining the BSL cut off (red dotted line). The cut off lines for TLG42% (green dotted line) and TLG2.5 (blue dotted line) are given as well.
The inter-reader variability for BSL measurements for lung tumors was very low with a mean difference of −7.6 ± 30.02 SUV*ml; r2=0.996, p<0.001.
4. Discussion
This study illustrates that the most commonly applied methods for TLG assessment, TLG2.5 and TLG42%, have a number of shortcomings relative to BSL. Below we discuss these shortcomings in more detail and highlight some of the advantages that BSL provides. Furthermore, we discuss the more practical aspects of how to use BSL, its limitations, and the potential implementations.
The results of the phantom analysis showed that BSL is significantly more accurate in assessing FDG uptake on PET images compared to the two most commonly applied TLG quantification methods in phantoms. Of note is that BSL even correlated slightly better with the true injected activity than the recovery coefficient based TLGRC in the phantom studies (p < 0.001 for the slopes and p = 0.026 for CCC).
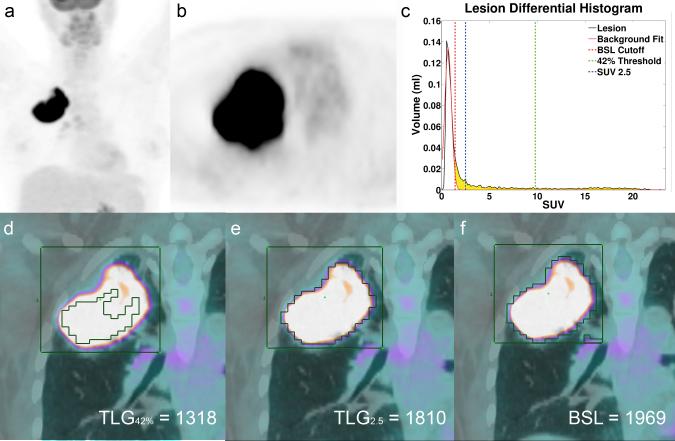
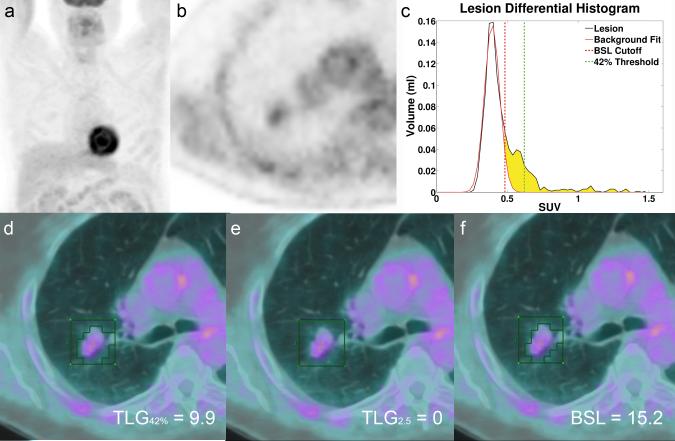
In lung tumors both TLG42% and TLG2.5 have systematic errors: TLG42% underestimates the activity in lesions with a high SUVmax (Fig. 7), and TLG2.5, underestimates the activity in lesions with relatively low FDG activity (Fig. 8),. These problems are evident in the literature. The optimal cut-off for TLG assessment has been extensively investigated in the literature. Several studies have evaluated various relative (e.g. 25 %, 50 % or 75 % of SUVmax) [20] or absolute thresholds (SUV 2.5, 3, 3.5 or 4) [18, 19]. Some of these thresholds have been shown to be superior to 42 % in certain tumor entities, however all thresholds are based on SUVmax, which in itself has been shown to have an intrinsic variability of 20 - 30 % [6-8]. In addition, physiological tracer uptake varies in different anatomical locations, and this particularly affects the use of absolute thresholds for delineating malignant from benign disease.
Fig. 7.
a MIP FDG PET image of patient 49 with a large lung tumor in the right upper lobe with SUVmax 23.3. b Axial slice of the tumor in the right upper lobe. c Histogram of the VOI illustrated in d-f, with the threshold lines for TLG42% (green), TLG2.5 (blue) and the cut off for BSL (red). BSL is represented by the sum of all yellow voxels in the histogram. d All voxels with a SUV above 42% of SUVmax representing TLG42% (1318 ml*SUV), illustrating a clear underestimation of the total tumor burden. e Represents the volume of all voxels with an SUV above 2.5, representing TLG2.5 (1810 ml*SUV) since this lesion had a TLG2.5 > 50 ml*SUV 1810 ml*SUV served as the surrogate reference standard. f Includes all voxels above background (BSL 1969 ml*SUV), overestimating TLG2.5 only by 8%.
Fig. 8.
a MIP FDG PET image of patient 39 with a small lung tumor in the right upper lobe with a low FDG activity (SUVmax 1.5) and TLG2.5 < 50 ml*SUV. b Axial slice of the tumor in the right upper lobe. c Histogram of the VOI illustrated in d-f (green box), with the threshold lines for TLG42% (green) and the cut off for BSL (red). BSL is represented by the sum of all yellow voxels in the histogram. d illustrates the volume covered by all voxels with a SUV above 42% of SUVmax representing TLG42% (9.9 ml*SUV). e TLG2.5 fails to measure any tumor activity (TLG2.5 0 ml*SUV) and f represents the activity of all voxels above background (BSL 15.2 ml*SUV), overestimating the reference activity for this lesion (TLGRC 13.3 ml*SUV) only by 14%.
Prior studies have suggested histogram analysis may be useful for separating different parts of a tumor into variable categories[30]. However, to use a histogram based analysis to calculate the background subtracted lesion activity, as an equivalent to TLG, has not been reported.
The idea of subtracting a Gaussian fit around the mode of a histogram to determine BSL was the central concept in this study. To determine the robustness of the method for different tumor to background ratios or lesion dimensions, we performed two phantom studies with increasing tumor activities and various chamber sizes. We performed the analysis with two independent readers and reached a low variability with a mean difference of −7.6 ml*SUV for the lung tumors. Furthermore we could show in a separate study that the histogram based determination of the background activity is equivalent to the mean background activity[28].
Only for phantom studies there is a true gold standard for the total uptake in form of the TIA. However, the crucial question for any PET segmentation method is the accuracy in patients, where the activity distribution is more heterogeneous and the lesion to background boundaries less well defined. There is no true gold standard for total tumor uptake in FDG PET-CT for patients. According to our phantom data we concluded that TLG2.5 is accurate for lesions with an absolute TLG over 50 ml*SUV, and a background activity under SUV 2.5. This led us to the conclusion that TLG2.5 could serve as a surrogate reference standard in lung lesions with a TLG > 50 ml*SUV.
For lesions with low FDG uptake, and a volume definable by CT, we used TLGRC as a reference standard, since our phantom data showed a good correlation with TIA. Small lesions are more likely to have a homogeneous FDG uptake on imaging due to the scanners resolution masking the true heterogeneity. Therefore, we assume that TLGRC can be considered as a reasonable approximation of the total FDG uptake in small lesions, provided the volume can be well defined on CT. For large lesions however, the heterogeneity of the tumor, with large areas of lower activity than the measured SUVmax will lead to an overestimation of the total tumor burden with TLGRC. We therefore used two different surrogate references for total tumor burden in patients.
The need for considering the background tracer uptake when quantifying tracer uptake in tumor lesions has also been previously mentioned and different solutions were suggested: either by incorporating a standardized background activity for each anatomical region (i.e. bone, soft tissue) [31] or by placing separate VOI over undiseased tissue adjacent to tumors [22, 32]. The latter is probably an accurate approach; however placing an additional “background” VOI for every tumor VOI would substantially increase workload, particularly in patients with extensive disease. Additionally, the selection of a background VOI is very subjective and can lead to further interreader variability.
With the histogram based BSL segmentation, we developed an accurate method to subtract background activity from the tumor VOI without any further measurements or assumptions; this reduces the workload and interreader variability.
Furthermore, since the segmentation is not based on the hottest area of the tumor, or any arbitrary selected edge value it is less vulnerable to tumor heterogeneity and absolute SUVmax values. We therefore yielded accurate results in small lesions with very low activity (min: SUVmax 1.5) as well as large, heterogeneous lesions with very high activity (max: SUVmax 35.7).
The resulting BSL does not correspond to an anatomical volume, but instead represents the total tumor uptake including also activity measured outside the actual tumor border from tumor spill-out. Furthermore, the subtraction of the Gaussian fit in the histogram means that there is no sharp threshold to distinguish, which specific voxels are counted and which are not, surely a requirement of any segmentation of an actual anatomical volume.
We focused on the total uptake measurement over delineation of the true tumor volume. Therefore, no spillover correction was applied, with the assumption that this activity originated from the lesion itself. Indeed the simple, background subtracted lesion activity correlated significantly better with the known injected amount of FDG activity in both phantom studies when compared to the two most commonly used SUV threshold based methods to determine TLG and even when compared to TLGRC.
There are limitations we have to acknowledge. First, it is difficult to validate any method for tumor quantification against the published TLG due to the lack of a true gold standard. As an alternative the use of two different surrogate references may seem methodically suboptimal, however when looking at our phantom results we can conclude that TLGRC is a suitable reference for homogeneous lesions with a known volume and furthermore we confirmed that TLG2.5 serves as an accurate reference for lesions with a TLG above 50 ml*SUV.
Furthermore, the idea of a recovery coefficient correction to estimate the true activity in lung nodules has been proposed already 17 years ago [24]. This value however depends on scanner specific properties such as spatial resolution [26]. For our analysis, we used an RC value that has been determined on the scanners used in our department. Doing the same calculation with published RC values for older scanner generations or different venders would impair the results; therefore, we decided to use our one value.
We also note that some care is necessary in drawing the VOI surrounding the tumor. In regions with more than one type of background areas present (e.g. lung and mediastinum), the VOI has do be drawn to emphasize the background with higher uptake (e.g. Mediastinum). The resulting histograms provide feedback that help guide VOI selection illustrating immediately if the lower activity background is yielding the mode of the histogram and therefore the Gaussian fit is not placed over the relevant background.
Finally, we purposefully did not incorporate outcome into this proof of concept. To do this would have required a larger cohort with more standardized clinical parameters such as treatment regimen, follow up periods, and histology; clearly this is beyond the scope of a proof of concept study. To obtain patients with well-delineated lesions in the upper lobes, without adjacent atelectasis or pneumonia, which could be measured accurately on CT would require patients within a clinical protocol. Based on the strength of the results in this study, this will be the next step. In support of this step, we have incorporated BSL estimation in the open source Matlab toolkit Computational Environment for Radiation Research (CERR) [33].
In summary our novel proposed BSL method to quantify tumor uptake with simple histogram analysis proved to be significantly more accurate for FDG uptake quantification in both phantom studies and 50 lung tumors compared to TLG42% and TLG2.5. Looking at the increasing use of TLG in the literature, this could become an important step to increase the consistency of tumor uptake quantification.
Advances in Knowledge: A background based tumor segmentation using the histogram of a tumor volume of interest is feasible and yields more accurate results in phantoms and lung tumors.
Implications for patient care: Total lesion glycolysis is gaining significance in the assessment of oncological patients. The improved consistency of the total tumor uptake might increase the value of PET quantification as a predictive biomarker.
Acknowledments
Irene A. Burger was financially supported by the Prof. Dr. Max Cloëtta Foundation (Switzerland) and the Swiss Society of Nuclear Medicine. In addition, the authors thank Assen S. Kirov for his ideas and insights into PET segmentation. Furthermore we thank the nuclear pharmacy, the technologists, and the administrative staff at Memorial Sloan-Kettering Cancer Center for their help in acquiring the data and freeing up resources. Specifically, we thank Dr Rashid Ghani, Robert Awadallah, Dr Angelina H Kim, Dr George Kourlas, and Heather Koehler from the nuclear pharmacy, Jean Aime, Polina Khersonskya, Reggie Jennings, Olivia Squire, Insang Cho, Osei Akoto, and Alex Gyau from the clinic.
Footnotes
Conflicts of interest There is no potential conflict of interest relevant to this article.
References
- [1].Chang KP, Tsang NM, Liao CT, Hsu CL, Chung MJ, Lo CW, et al. Prognostic significance of 18F-FDG PET parameters and plasma Epstein-Barr virus DNA load in patients with nasopharyngeal carcinoma. Journal of nuclear medicine: official publication, Society of Nuclear Medicine. 2012;53:21–8. doi: 10.2967/jnumed.111.090696. [DOI] [PubMed] [Google Scholar]
- [2].Groves AM, Shastry M, Rodriguez-Justo M, Malhotra A, Endozo R, Davidson T, et al. (1)(8)F-FDG PET and biomarkers for tumour angiogenesis in early breast cancer. European journal of nuclear medicine and molecular imaging. 2011;38:46–52. doi: 10.1007/s00259-010-1590-2. [DOI] [PubMed] [Google Scholar]
- [3].Weber WA, Figlin R. Monitoring cancer treatment with PET/CT: Does it make a difference? Journal of Nuclear Medicine. 2007;48:36s–44s. [PubMed] [Google Scholar]
- [4].Wahl RL, Jacene H, Kasamon Y, Lodge MA. From RECIST to PERCIST: Evolving Considerations for PET response criteria in solid tumors. Journal of nuclear medicine: official publication, Society of Nuclear Medicine. 2009;50(Suppl 1):122S–50S. doi: 10.2967/jnumed.108.057307. [DOI] [PMC free article] [PubMed] [Google Scholar]
- [5].Boellaard R, O’Doherty MJ, Weber WA, Mottaghy FM, Lonsdale MN, Stroobants SG, et al. FDG PET and PET/CT: EANM procedure guidelines for tumour PET imaging: version 1.0. Eur J Nucl Med Mol Imaging. 2010;37:181–200. doi: 10.1007/s00259-009-1297-4. [DOI] [PMC free article] [PubMed] [Google Scholar]
- [6].Burger IA, Huser DM, von Schulthess GK, Trinckauf J, Burger C, Buck A. Repeatability of FDG quantification in tumor imaging: averaged SUVs are superior to SUVmax. Nuclear medicine and biology. 2012 doi: 10.1016/j.nucmedbio.2011.11.002. In press. [DOI] [PubMed] [Google Scholar]
- [7].de Langen AJ, Vincent A, Velasquez LM, van Tinteren H, Boellaard R, Shankar LK, et al. Repeatability of 18F-FDG uptake measurements in tumors: a metaanalysis. J Nucl Med. 2012;53:701–8. doi: 10.2967/jnumed.111.095299. [DOI] [PubMed] [Google Scholar]
- [8].Schwartz J, Humm JL, Gonen M, Kalaigian H, Schoder H, Larson SM, et al. Repeatability of SUV measurements in serial PET. Medical physics. 2011;38:2629–38. doi: 10.1118/1.3578604. [DOI] [PMC free article] [PubMed] [Google Scholar]
- [9].Larson SM, Erdi Y, Akhurst T, Mazumdar M, Macapinlac HA, Finn RD, et al. Tumor Treatment Response Based on Visual and Quantitative Changes in Global Tumor Glycolysis Using PET-FDG Imaging. The Visual Response Score and the Change in Total Lesion Glycolysis. Clinical positron imaging: official journal of the Institute for Clinical P.E.T. 1999;2:159–71. doi: 10.1016/s1095-0397(99)00016-3. [DOI] [PubMed] [Google Scholar]
- [10].Seol YM, Kwon BR, Song MK, Choi YJ, Shin HJ, Chung JS, et al. Measurement of tumor volume by PET to evaluate prognosis in patients with head and neck cancer treated by chemo-radiation therapy. Acta oncologica. 2010;49:201–8. doi: 10.3109/02841860903440270. [DOI] [PubMed] [Google Scholar]
- [11].Chung HH, Kim JW, Han KH, Eo JS, Kang KW, Park NH, et al. Prognostic value of metabolic tumor volume measured by FDG-PET/CT in patients with cervical cancer. Gynecol Oncol. 2011;120:270–4. doi: 10.1016/j.ygyno.2010.11.002. [DOI] [PubMed] [Google Scholar]
- [12].Chung HH, Kwon HW, Kang KW, Park NH, Song YS, Chung JK, et al. Prognostic value of preoperative metabolic tumor volume and total lesion glycolysis in patients with epithelial ovarian cancer. Ann Surg Oncol. 2012;19:1966–72. doi: 10.1245/s10434-011-2153-x. [DOI] [PubMed] [Google Scholar]
- [13].Lim R, Eaton A, Lee NY, Setton J, Ohri N, Rao S, et al. 18F-FDG PET/CT Metabolic Tumor Volume and Total Lesion Glycolysis Predict Outcome in Oropharyngeal Squamous Cell Carcinoma. J Nucl Med. 2012;53:1506–13. doi: 10.2967/jnumed.111.101402. [DOI] [PubMed] [Google Scholar]
- [14].Liu FY, Chao A, Lai CH, Chou HH, Yen TC. Metabolic tumor volume by 18F-FDG PET/CT is prognostic for stage IVB endometrial carcinoma. Gynecol Oncol. 2012;125:566–71. doi: 10.1016/j.ygyno.2012.03.021. [DOI] [PubMed] [Google Scholar]
- [15].Liao S, Penney BC, Wroblewski K, Zhang H, Simon CA, Kampalath R, et al. Prognostic value of metabolic tumor burden on 18F-FDG PET in nonsurgical patients with non-small cell lung cancer. Eur J Nucl Med Mol Imaging. 2012;39:27–38. doi: 10.1007/s00259-011-1934-6. [DOI] [PubMed] [Google Scholar]
- [16].Chen HH, Chiu NT, Su WC, Guo HR, Lee BF. Prognostic value of whole-body total lesion glycolysis at pretreatment FDG PET/CT in non-small cell lung cancer. Radiology. 2012;264:559–66. doi: 10.1148/radiol.12111148. [DOI] [PubMed] [Google Scholar]
- [17].Hyun SH, Choi JY, Shim YM, Kim K, Lee SJ, Cho YS, et al. Prognostic value of metabolic tumor volume measured by 18F-fluorodeoxyglucose positron emission tomography in patients with esophageal carcinoma. Ann Surg Oncol. 2010;17:115–22. doi: 10.1245/s10434-009-0719-7. [DOI] [PubMed] [Google Scholar]
- [18].Lee SJ, Choi JY, Lee HJ, Baek CH, Son YI, Hyun SH, et al. Prognostic Value of Volume-Based (18)F-Fluorodeoxyglucose PET/CT Parameters in Patients with Clinically Node-Negative Oral Tongue Squamous Cell Carcinoma. Korean J Radiol. 2012;13:752–9. doi: 10.3348/kjr.2012.13.6.752. [DOI] [PMC free article] [PubMed] [Google Scholar]
- [19].Abd El-Hafez YG, Moustafa HM, Khalil HF, Liao CT, Yen TC. Total lesion glycolysis: A possible new prognostic parameter in oral cavity squamous cell carcinoma. Oral Oncol. 2012 doi: 10.1016/j.oraloncology.2012.09.005. [DOI] [PubMed] [Google Scholar]
- [20].Kim TM, Paeng JC, Chun IK, Keam B, Jeon YK, Lee SH, et al. Total lesion glycolysis in positron emission tomography is a better predictor of outcome than the International Prognostic Index for patients with diffuse large B cell lymphoma. Cancer. 2012 doi: 10.1002/cncr.27855. [DOI] [PubMed] [Google Scholar]
- [21].Tylski P, Stute S, Grotus N, Doyeux K, Hapdey S, Gardin I, et al. Comparative assessment of methods for estimating tumor volume and standardized uptake value in (18)F-FDG PET. Journal of nuclear medicine: official publication, Society of Nuclear Medicine. 2010;51:268–76. doi: 10.2967/jnumed.109.066241. [DOI] [PubMed] [Google Scholar]
- [22].Nestle U, Kremp S, Schaefer-Schuler A, Sebastian-Welsch C, Hellwig D, Rube C, et al. Comparison of different methods for delineation of 18F-FDG PET-positive tissue for target volume definition in radiotherapy of patients with non-Small cell lung cancer. J Nucl Med. 2005;46:1342–8. [PubMed] [Google Scholar]
- [23].Biehl KJ, Kong FM, Dehdashti F, Jin JY, Mutic S, El Naqa I, et al. 18F-FDG PET definition of gross tumor volume for radiotherapy of non-small cell lung cancer: is a single standardized uptake value threshold approach appropriate? Journal of nuclear medicine: official publication, Society of Nuclear Medicine. 2006;47:1808–12. [PubMed] [Google Scholar]
- [24].Hoffman EJ, Huang SC, Phelps ME. Quantitation in positron emission computed tomography: 1. Effect of object size. Journal of computer assisted tomography. 1979;3:299–308. doi: 10.1097/00004728-197906000-00001. [DOI] [PubMed] [Google Scholar]
- [25].Satoh Y, Onishi H, Nambu A, Araki T. Volume-based Parameters Measured by Using FDG PET/CT in Patients with Stage I NSCLC Treated with Stereotactic Body Radiation Therapy: Prognostic Value. Radiology. 2013 doi: 10.1148/radiol.13130652. [DOI] [PubMed] [Google Scholar]
- [26].Soret M, Bacharach SL, Buvat I. Partial-volume effect in PET tumor imaging. Journal of nuclear medicine: official publication, Society of Nuclear Medicine. 2007;48:932–45. doi: 10.2967/jnumed.106.035774. [DOI] [PubMed] [Google Scholar]
- [27].Freedman D, Diaconis P. On the Histogram as a Density Estimator - L2 Theory. Z Wahrscheinlichkeit. 1981;57:453–76. [Google Scholar]
- [28].Burger IA, Vargas HA, Beattie BJ, Goldman DA, Zheng J, Larson SM, et al. How to assess background activity: introducing a histogram-based analysis as a first step for accurate one-step PET quantification. Nuclear medicine communications. 2013 doi: 10.1097/MNM.0000000000000045. [DOI] [PubMed] [Google Scholar]
- [29].Lin LI. A Concordance Correlation-Coefficient to Evaluate Reproducibility. Biometrics. 1989;45:255–68. [PubMed] [Google Scholar]
- [30].Aristophanous M, Penney BC, Martel MK, Pelizzari CA. A Gaussian mixture model for definition of lung tumor volumes in positron emission tomography. Med Phys. 2007;34:4223–35. doi: 10.1118/1.2791035. [DOI] [PubMed] [Google Scholar]
- [31].Fox JJ, Autran-Blanc E, Morris MJ, Gavane S, Nehmeh S, Van Nuffel A, et al. Practical approach for comparative analysis of multilesion molecular imaging using a semiautomated program for PET/CT. J Nucl Med. 2011;52:1727–32. doi: 10.2967/jnumed.111.089326. [DOI] [PMC free article] [PubMed] [Google Scholar]
- [32].Nehmeh SA, El-Zeftawy H, Greco C, Schwartz J, Erdi YE, Kirov A, et al. An iterative technique to segment PET lesions using a Monte Carlo based mathematical model. Med Phys. 2009;36:4803–9. doi: 10.1118/1.3222732. [DOI] [PubMed] [Google Scholar]
- [33].Deasy JO, Blanco AI, Clark VH. CERR: a computational environment for radiotherapy research. Medical physics. 2003;30:979–85. doi: 10.1118/1.1568978. [DOI] [PubMed] [Google Scholar]


