

Abstract
Human cultural traits typically result from a gradual process that has been described as analogous to biological evolution. This observation has led pioneering scholars to draw inspiration from population genetics to develop a rigorous and successful theoretical framework of cultural evolution. Social learning, the mechanism allowing information to be transmitted between individuals, has thus been described as a simple replication mechanism. Although useful, the extent to which this idealization appropriately describes the actual social learning events has not been carefully assessed. Here, we used a specifically developed computer task to evaluate (i) the extent to which social learning leads to the replication of an observed behaviour and (ii) the consequences it has for fitness landscape exploration. Our results show that social learning does not lead to a dichotomous choice between disregarding and replicating social information. Rather, it appeared that individuals combine and transform information coming from multiple sources to produce new solutions. As a consequence, landscape exploration was promoted by the use of social information. These results invite us to rethink the way social learning is commonly modelled and could question the validity of predictions coming from models considering this process as replicative.
Keywords: social learning, cumulative culture, cultural evolution, Roger's paradox, innovation
1. Introduction
Human cultural traits typically result from the gradual accumulation of many successive modifications [1–3]. For instance, contemporary complex technologies, such as spacecraft, have not been produced in a single step, but have arisen across time, through a scaffolding process by which new innovations are added to simpler, pre-existing ones. This cumulative process has been described as analogous to the gradual evolutionary change that Darwin termed ‘descent with modification’. Based on these observations, pioneering scholars have drawn inspiration from population genetics to develop a rigorous theoretical framework, which has led to major advances in the field of cultural evolution [4,5]. Yet, the dissimilarities between biological and cultural evolution are as obvious as their similarities [6,7]. For example, contrary to biological mutations, which are random, cultural mutations are expected to be, at least sometimes, guided by the intentional actions of people trying to solve a particular problem [8]. While some have argued that these differences should prevent scholars from studying culture within a Darwinian framework, others have stressed the fact that culture exhibits the key Darwinian properties, which are variation, competition and inheritance [9]. Far from neglecting these differences, proponents of this Darwinian framework have also constantly adjusted their models in order to take them into account (e.g. [10]). Nevertheless, important simplifications are commonly made when it comes to the study of a phenomenon as complex as culture. Simple assumptions are obviously necessary in order to gain clarity, but these assumptions can sometimes lead to persistent idealizations of processes that are at the very core of cultural evolution. Among these persistent idealizations are the basic learning processes that are thought to originate and maintain cultural innovations: individual and social learning.
Individual learning is commonly described as a random, or sometimes guided, process by which individuals produce new behaviours, i.e. innovations, that they will possibly retain depending on how these innovations benefit them. By contrast, social learning is a process by which individuals gather information by the observation of others [11], thus allowing them to acquire relevant information without paying the cost associated with exploratory behaviours. Within this framework, innovations mainly result from individual learning events, while social learning events lead to the replication of a pre-existing behaviour and do not contribute to the production of new information, or only as the result of unfaithful social learning mechanisms.
Many criticisms have been made about this common view of learning processes. For instance, it has been claimed that social learning is not properly described as a simple replicative event [6,12]. Indeed, since the first pioneering transmission chain studies, experimental results have suggested that, far from faithfully reproducing social information, social learners tend to transform information, making it more coherent and consistent with their own pre-existing knowledge [13]. More recently, Griffiths et al. [14] demonstrated that socially learned information is affected by inductive biases, i.e. the constraints on learning and memory, while other experiments suggested that individuals are able to aggregate information from multiple sources [15–18]. More generally, it has been argued that individual and social learning should not be considered as two distinct and alternative learning processes [11,19]. In fact, both individual and social learning are likely to involve cue-based inferences about what is the best behaviour to exhibit in the current environment [20]. It means that, except in the case where people exclusively use social information, social learners should benefit from additional information compared with pure individual leaners.
The question then is what should people do with this additional amount of information? Should this information necessarily lead them to replicate a pre-existing behaviour? Or should they use this information to produce new solutions? There is no doubt that, under specific conditions, social learning can lead an individual to adopt an observed behaviour. For example, when asking an individual to choose between two types of resources on the basis of social information, individuals are likely to adopt the behaviour they observed among their conspecifics, thus replicating it [21]. Yet, it does not mean that social learning is a simple replicative event. In fact, the output of a social learning event most likely should depend on the entire range of task-related potential behaviours. Within a binary choice framework, social learning necessarily lead to the adoption of an existing solution, hence preventing social learners from contributing to the production of innovations. However, cumulative culture, as the result of an evolutionary process, is associated with a virtually endless range of possible outputs: people constantly combine technologies or knowledge to produce novelties [22]. Within a cumulative framework, the output of social learning events could be very different from what it looks like in a non-cumulative setting. It is obvious that, when trying to individually solve a problem, people do not necessarily generate random variations. Rather they are likely to use previously acquired information to mentally simulate actions and their consequences, before selecting what they think to be the best possible solution [23]. There is no reason to think that this kind of mental simulations should only be based on individually acquired information. Thus, social learning, by providing individuals with additional information, could allow individuals to make more accurate inferences, which ultimately should lead them to contribute further to the fitness landscape exploration than individuals who do not benefit from social information.
Here, we aimed to evaluate this assumption by comparing individuals' exploratory behaviour in a computer game specifically designed to measure cultural variation using an objective morphometric method (elliptic Fourier analysis (EFA)). Over successive trials, individuals, placed in groups of four, had to carve a two-dimensional virtual block of stone to produce arrowheads. In order to make our task ecologically relevant, arrowhead performances were calculated according to multiple and interacting parameters [23]. Three experimental conditions were run: individual learning (no information), social learning (other group members' arrowheads performances were visible and players could choose to see the shape of one of them) and performance cue (only other group members' arrowheads performances were visible). This latter treatment allowed us to disentangle the effect of landscape information, which is known to positively affect individuals' exploratory behaviour [24], from the effect of arrowhead shape information, which, according our assumption, should further increase individuals' exploratory behaviour. Crucially, social learners were constrained to observe only one arrowhead at a time, so that we were also able to assess the replicative nature of social learning by measuring the similarity between the tool the individuals observed and the tools that they produced both before and after benefiting from social information.
2. Material and methods
(a). Game
(i). Participants
A total of 300 male participants were randomly selected from a database managed by the Laboratory of Experimental Economics of Montpellier (LEEM) and recruited by e-mail from various universities in the Montpellier area (southern France). The subjects ranged in age from 16 to 49 years (mean = 23.34, s.d. = 4.02). Each participant was randomly assigned to one of the three conditions of the experiment. The participants received travel fees according to the LEEM operating rules (2 € for local students and 6 € for the others).
(ii). Procedure
The experiment took place in a computer room at the LEEM. For each session, 20 players sat at physically separated and networked computers and were randomly assigned to a group (four players per group, five groups per session). The players were instructed that communication was not allowed, they could not see each other and were blind with regard to the purpose of the experiment and to who belonged to their group. At the beginning of the game, the participants read instructions on their screens about the rewards and the goal of the game, and they were requested to enter their date of birth. At the end of the game, each participant received a reward according to his performance (10 € on average).
(iii). Principle
The participants played a computer game (programmed in Object Pascal with Delphi 7) during which they had to achieve a complex virtual task. The participants were asked to carve an arrowhead from a two-dimensional virtual block of stone, and their performance on this was then evaluated in a ‘virtual environment’. The cultural fitness landscape associated with our task was complex (see §2a(v)) to reflect the complexity of actual cultural artefacts, which are usually highly multidimensional traits ([23]). Over successive trials, the participants had to increase their cumulative performance (defined as the sum of the performance of all their arrowheads). No information on this landscape, including the highest possible performance, was communicated to the players. Each trial was followed by an information period, whose content varied according to each treatment (see §2(vi)).
(iv). Construction period
The construction period was limited to 180 s. At the start of each trial, the players were given a new block of stone, represented by a grey square surface on a white background (with a grid pattern). The players shaped their arrowheads by cutting edges in the block to remove flakes. To do so, the players moved two red squares on the screen through a drag-and-drop procedure. When at a desired position, the players cut a line between the squares using the ‘Knap’ button. By repeatedly using this procedure, the players were able to detach flakes from the block to create their arrowhead (a flake was detached when no contact points persisted between the flake and the main block). The use of the knap procedure was unlimited; therefore, players could virtually produce an infinity of possible shapes and explore a very large fitness landscape.
(v). Performance calculation
The performance of an arrowhead depended on its shape and the procedure to build it. Multiple parameters were considered to provide a wide and complex fitness landscape. The effect of each parameter was arbitrarily chosen but was based on logical thinking as much as possible. The programme evaluated each arrowhead using the formula as follows:
Functionality depended on three binary characteristics as follows: ‘pointed tip’, ‘lateral teeth’ and ‘highest width in the arrowhead lower part’. These characteristics, when present, provided respectively 200, 300 and 500 points. Arrowheads without a pointed tip were considered non-functional and were given a global performance of 0. Functional arrowheads were further analysed. Efficiency was evaluated according to five parameters as follows: ‘perimeter of the arrowhead’, ‘angle of the tip’, ‘number of teeth’, ‘average tooth angle’ and ‘average tooth orientation’. Parameters were maximized when the difference with an optimal value was minimized. For the first two parameters, the optimal value was a function of the arrowhead surface. For the other three parameters, the optimal values did not interact with the arrowhead's properties. Efficiency provided a theoretical maximum of 7500. Symmetry was calculated as the proportion of symmetric pixels between the left and the right parts of the arrowhead. Process ranged between 0 and 0.3 and depended on two flaking rules as follows: (i) the size of the removed flakes should decrease over time and (ii) the ratio between the total number of detached flakes and the number of uses of the knap procedure should be as high as possible. It is worthy of note that none of these dimensions were multimodal, so that, theoretically, all positions in the landscape led to a single global optimum. However, owing to the interactions between multiple parameters, reaching this optimum was only possible by covarying several parameters in the right way. Optimal values were constant throughout the game so that individuals experienced a stable environment.
(vi). Information period
After each trial, information was displayed to the players for 30 s, and the content varied according to each treatment. In the individual learning treatment, the players only had access to their own last trial and to cumulative performances. The performances of their other group members were displayed as ‘X’, to remind the players that they were in a competition. In the performance cue treatment, the players could see their own last trial and cumulative performances and those of their other group members. In addition, the players from the social learning treatment could select one of their group members' arrowheads as a cultural model. The players who had chosen a cultural model were provided with a picture of the model arrowhead during the subsequent construction period (in parallel with their own block of stone).
(b). Arrowhead analysis
(i). Picture manipulation
Before performing the analysis, each arrowhead was centred in a new picture and converted to a PNM format (portable anymap) using ImageMagick v. 6.8.7. All subsequent operations were performed using R v. 3.0.1 [25]. Each picture was converted to a binary format using the pixmap package [26], and the outlines (i.e. the x and y coordinates of each pixel describing the shape) were extracted using the Conte function from Claude [27].
(ii). Elliptic Fourier analysis
We analysed the arrowheads using the EFA [28]. EFA is a method commonly used in morphometric analysis and is particularly appropriate for characterizing two-dimensional outlines [27,29,30]. EFA uses the decomposition of a curve into a sum of harmonically related ellipses; the position of any point on this curve is approximated by the net displacement of a point travelling around a series of superimposed and successively smaller ellipses. The x and y coordinates can be characterized as a function of the curvilinear abscissa t (the net distance on the outline from the starting point), and these functions can be decomposed according to the Fourier series expansions as follows:
and
For any particular harmonic, these equations define an ellipse in the xy-plane. The parameters a0 and c0 define the coordinates of the centroid of the outline, and T corresponds to the outline perimeter. For each harmonic rank (n), four elliptic Fourier descriptors (EFDs), an, bn, cn and dn, parametrize the corresponding ellipse. These ellipses become progressively smaller as they describe the outline in greater detail, with the maximal harmonic rank (N) used to define the degree of the precision of the outline approximation.
(iii). Calculation of the number of harmonics
The maximum number of harmonics that can be computed for any outline is limited to half of the total number of outline coordinates Nmax [29]. For any number of harmonics computed N < Nmax, some of the shape information is lost (figure 1). However, the shape information contained in the neglected harmonics (N + 1 to Nmax) decreases with N. The amount of shape information for any harmonic rank is given by the Fourier power spectrum [27]. For any harmonic rank n, the harmonic power Pn can be computed as follows:
and the relative power of the harmonic ranks up to N is estimated as follows:
 |
From our global dataset, we computed the harmonic ranks that corresponded to the reconstructed outlines that reached an average power of 99.99% of the total power (N = 37, figure 1). The EFDs were computed using the efourier function from Claude [27].
Figure 1.

The elliptic Fourier analysis has been used to describe each arrowhead and to provide a straight description of the fitness landscape exploration. As the number of harmonics increases, the ellipses become progressively smaller and describe the outline of an arrowhead (in grey) in greater detail (black curve).
(c). Statistical models
(i). Social influence
For each player's observation event (i.e. when a player had chosen to observe an arrowhead), we computed two Euclidian distances using the EFDs [31]: the distance between the observed arrowhead and the arrowhead produced by the focal player (d1), and the distance between the produced arrowhead and the previously produced arrowhead of the focal player (d2). The ratio d1/(d1 + d2) was used as a measure of social influence and introduced into a linear mixed model as a response variable. The performance of the observed arrowhead PerfObs and the performance of the previously produced arrowhead PerfPrev were used to calculate the ratio PerfObs/(PerfObs + PerfPrev). This ratio (designed as performance difference), and the age of the player, were introduced into the model as dependent variables. The identity of the player was introduced as random effect.
(ii). Global exploration
The EFDs were averaged to generate a barycentre (i.e. an ‘average shape’) for a given population of arrowheads ([29]; figure 2). For each group, the barycentre was determined from 60 arrowheads (15 arrowheads × 4 individuals), and all of the Euclidian distances among these arrowheads and the barycentre were computed. A linear mixed model was used with the log-transformed distance as a response variable. The treatment and the age of the player were introduced as dependent variables and the identity of the player as a random effect.
Figure 2.

Elliptic Fourier descriptors were averaged to generate an ‘average shape’ (i.e. a barycenter) for a given population of arrowheads. In this example, four arrowheads (light grey) are used to build a barycentric arrowhead (black line), which is then compared with the four subsequently built arrowheads of the group (dark grey). In parentheses are the computed distances between each arrowhead built at t + 1 and the barycentric arrowhead. This virtual example illustrates calculation of distances that were used in our individual exploration analysis at trial 2. At trial 3, the same analysis would involve eight arrowheads to build the barycentric arrowhead (16 at trial 4, and so on).
(iii). Conservatism
For all players, all possible distances between two successive arrowheads for the 15 trials were computed (N = 14 per individual). A linear mixed model was used with the log-transformed distance as a response variable. The treatment, the age and the rank of the player and the interaction between rank and treatment were introduced as dependent variables, with the identity of the player as a random effect.
(iv). Individual exploration
All of the arrowheads were compared to the current group barycentric arrowhead (figure 2). For example, an arrowhead built at the 6th trial was compared with the average shape computed from all of the arrowheads coming from the same group built until the 5th trial (4 × 5 arrowheads). The log-transformed distance between the arrowheads and their respective barycentric arrowhead was analysed using a linear mixed model. The treatment and the age and the rank of the player were introduced as dependent variables. The identity of the player was introduced as a random effect.
(v). Performance
Arrowhead performance at the last trial was analysed using a linear mixed model. The response variable was the arrowhead performance, and the dependent variables were the treatment and the age of the players. The identity of the group was introduced as a random effect.
All statistical analyses were conducted using R v. 3.0.1 [25]. Mixed models and post hoc comparisons were performed using the lme4 [32] and phia [33] packages, respectively.
3. Results
In total, 300 men (mean age = 23.3 years, s.d. = 4.0) participated in a game composed of 15 successive trials, so that 4500 arrowheads were generated (4484 could be described using the EFA).
Social learning. The arrowheads produced by the players following a social learning event were, on average, equally influenced by individual and social information (social influence measure [0, 1]: mean = 0.49, s.d. = 0.16). The performance difference between the arrowhead they had designed previously and the one they observed modulated the influence of the social information; the more their own arrowhead was outperformed by the arrowhead they observed, the higher the influence (χ2 = 33.4, d.f. = 1, p < 0.0001). The age of the player had no effect on the way individuals used information (χ2 = 0.93, d.f. = 1, p = 0.33). Social learning events were usually directed towards the best alternative source of information, as players ranked other than first observed the best-performing individual in 85% of cases, the latter observing the second best ranked individual in 67% of cases (while observing their own arrowhead in 22% of cases).
Global exploration. The treatments had a significant effect on the exploration of the fitness landscape (χ2 = 8.24, d.f. = 2, p = 0.02). The social learners explored more than the individual learners (χ2 = 3.78, d.f. = 1, p = 0.05) and the players with the performance cues (χ2 = 7.71, d.f. = 1, p = 0.005; figure 3). No difference was observed between the individual learners and the players from the performance cue treatment (χ2 = 0.70, d.f. = 1, p = 0.40). The age of the player had no significant effect on the exploration of the fitness landscape (χ2 = 2.03, d.f. = 1, p = 0.15).
Figure 3.

Social learning promoted the exploration of the fitness landscape. No difference was observed between the individual learners and the individuals who benefited from the performance cues. The error bars show the standard error of the mean.
Conservatism. Individual conservatism—the propensity to reproduce a previous solution rather than producing a different one—was affected by the treatments (χ2 = 11.1, d.f. = 2, p = 0.004) and by the rank of the player within his group (χ2 = 19.1, d.f. = 1, p < 0.0001; figure 4). The interaction between a player's rank and treatment was also significant (χ2 = 13.3, d.f. = 2, p = 0.001). The post hoc comparisons revealed that the social learners were less conservative than the individual learners (χ2 = 5.27, d.f. = 1, p = 0.02) and the individuals benefiting from performance cues (χ2 = 10.5, d.f. = 1, p = 0.001). No difference was observed between the individual learners and the players from the performance cue treatment (χ2 = 0.89, d.f. = 1, p = 0.35). Compared with the individual learners, the positive effect of the player's rank was stronger for the social learners and the players benefiting from performance cues (χ2 = 12.9, d.f. = 1, p = 0.0003 and χ2 = 6.33, d.f. = 1, p = 0.01, respectively) but did not differ between them (χ2 = 1.23, d.f. = 1, p = 0.27).
Figure 4.

The social learners were less conservative than the individuals from the other treatments. The positive effect of the player's rank was stronger when individuals benefited from the performance cues only or in addition to arrowhead shape information. The error bars show the standard error of the mean.
Individual exploration. An individual's exploration was affected by the treatments (χ2 = 14.5, d.f. = 2, p = 0.0007). The social learners explored more than either the individual learners (χ2 = 7.07, d.f. = 1, p = 0.009) or the individuals from the performance cue treatment (χ2 = 13.6, d.f. = 1, p = 0.0002; figure 5). No difference was observed between the individual learners and the individuals from the performance cue treatment (χ2 = 1.07, d.f. = 1, p = 0.30). A player's rank had no significant effect on individual exploration (χ2 = 0.93, d.f. = 1, p = 0.34), whereas older players explored more (χ2 = 8.31, d.f. = 1, p = 0.004).
Figure 5.
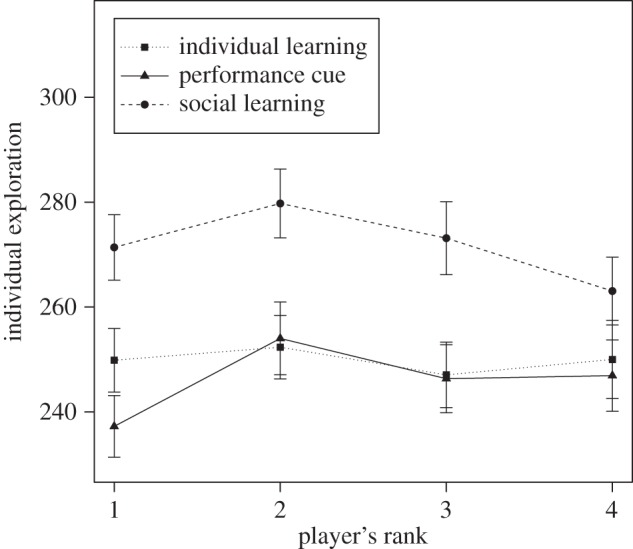
The social learners explored further compared with the individuals from the other treatments. The player's rank had no significant effect in any treatment. The error bars show the standard error of the mean.
Performance. The arrowhead performance at the end of the experiment was significantly different between the treatments (χ2 = 7.15, d.f. = 2, p = 0.03). The social learners outperformed the individual learners (χ2 = 5.67, d.f. = 1, p = 0.02) and the players from the performance cue treatment (χ2 = 5.02, d.f. = 1, p = 0.03), whereas no difference was observed between these latter and the individual learners (χ2 = 0.02, d.f. = 1, p = 0.89). The age of the player had no significant effect on the arrowhead performance (χ2 = 1.62, d.f. = 1, p = 0.21).
4. Discussion
In this experiment, we investigated (i) the extent to which the use of social information results in the replication of an observed tool and (ii) the consequences of the use of social information for the fitness landscape exploration. Our results clearly demonstrate that social learning does not lead to a dichotomous choice between disregarding or replicating social information. Most of the time, individuals were influenced to some degree by social information, and the strength of this influence depended on the relative performance of their design compared with alternative solutions: the more their own arrowhead was outperformed by the arrowhead they observed, the stronger the influence. Consequently, when the observed arrowhead was roughly as efficient as the player's own solution, individuals were equally influenced by both sources of information. It is noteworthy that this does not necessarily mean that individuals created true intermediate solutions by blending both designs. If this were the only process at work, individuals would produce increasingly similar solutions over time, and within-group cultural variation would be quickly reduced [4,5]. Here, it appeared that the participants aggregated social and individual information to produce new solutions. By doing so, social learners were able to further explore the fitness landscape than individual learners.
It is worthy of note that this increased exploration could be explained by different mechanisms, not necessarily related to an increased ability to produce innovation on the basis of socially acquired information. For example, it has been shown that landscape information can promote individuals' exploratory behaviours [24]. Indeed, many scholars have stressed the fact that exploration is risky because individuals face a trade-off between collecting resources in a safe way (repeatedly performing their previous behaviour) and producing a new solution associated with a hypothetical and unknown benefit [34,35]. Therefore, an individual's propensity to produce new solutions should depend on how that individual perceives the cost/benefit ratio associated with the production of new information. When the fitness landscape associated with a task is simple (e.g. smooth and one- or two-dimensional), individuals are likely to produce new solutions (e.g. [36,37]) because they are able to readily refine and improve their own solutions. However, when the complexity of the fitness landscape increases, it becomes increasingly hard for individuals to figure out how to improve their previous solutions [23,36,37]. Under those conditions, individuals without access to others' performance information have very few incentives towards exploration because they benefit only from the information they generate themselves and have no idea of the potential benefits associated with the risky exploration. Conversely, when provided with landscape information, individuals are aware that exploratory behaviours can be rewarded, which, as shown by Toelch et al. [24], can lead to an upsurge of exploration. Thus, in our experiment, the higher exploratory behaviour of social learners (which were provided with others' performance information) could potentially be owing to this effect. However, the comparison between our social learning and performance cue treatments allows us to reject this explanation. Here, contrary to what Toelch et al. [24] observed, individuals from the performance cue treatment did not generate higher arrowhead diversity than individual learners. It is noteworthy that in the Toelch et al. [24] study, the participants played alone and were simply informed about the possibility of getting high scores. As a consequence, individuals always had positive incentives towards exploration (because of the knowledge that exploration can be strongly rewarded). In our study, individuals were integrated within a social group, therefore, less successful players were aware that more successful solutions existed, whereas the best performers were informed that worse solutions also existed. Consequently, the worst performers were less conservative than average (in accordance with the Toelch et al. [24] study), but the best performers were more conservative (figure 4). Compared with the individual learning treatment, this rank-dependent effect did not affect the average conservatism because the exact opposite effects were observed when individuals were informed about the possibility to perform better or to perform worse. It is also noteworthy that the non-conservative behaviour of the less successful individuals did not generate new information at the group level (figure 5), suggesting that these individuals converged towards (simple) solutions that had already been exploited by other group members. A similar rank-dependent effect on conservatism was observed when the individuals were allowed to learn socially, but these individuals were on average less conservative than the individuals from other treatments.
A second possibility that could be proposed to explain our results is the vagueness of social learning. Indeed, although most of the theoretical models assume that social learning leads to reasonably accurate copying, it has been argued that copying abilities are generally imperfect [38]. Copying errors, more likely to be observed with complex artefacts [38,39], could thus act as an important source of cultural innovation [38,40,41]. However, if copying errors were the main source of cultural innovation, then the higher exploration should be primarily owing to less conservative and efficient social learners (those who tried to regularly copy more efficient solutions). Our data do not support this explanation because all of the social learners explored the fitness landscape equally, regardless of their rank (figure 5). It is still likely that copying errors contribute substantially to the production of new information, but this is clearly not the only mechanism operating.
Thus, the higher exploration of social learners seems to be better explained as resulting from a voluntary exploratory behaviour, which was promoted by the use of social information. This is well supported by our data, as the highest-ranked players from the social learning treatment participated in the production of new information as much as less successful individuals. This suggests that all of the individuals from the social learning treatment, including the best ones, were able to use social information, including less efficient solutions, to refine their own solutions. The combination of information coming from multiple sources, which has been previously documented in various experimental studies [15–18], seems widely implicated in this process. However, it raises interesting questions about how individuals process social information. This behaviour can indeed be easily explained when the requirement of the task is to combine discrete units in an appropriate way [15,17,18], but is much more surprising with the type of task required in our game. Do individuals make accurate inferences about what discrete properties are contributing to arrowhead efficiency? Do they copy discrete properties? Transmission chain experiments, involving various types of material (e.g. descriptions of sporting events), have demonstrated that individuals tend to preserve only the gist of a story and make it more coherent and consistent with their own pre-existing knowledge [13]. Interestingly, there are some indications that a similar process could operate in our technological evolution setting. For example, the variance in the number of teeth of the arrowheads was higher among the individuals who integrated this property after the observation of a toothed arrowhead compared with individuals adding teeth without any previous observations (Levene's test: F1,98 = 4.27, p = 0.04). This suggests that individuals could simply reproduce ‘the idea of teeth’ during the making of arrowheads with an unrelated number of teeth. According to this view, the individuals would focus on some specific arrowhead properties, which are then enriched or modified to fit with other properties coming from their own arrowhead. More generally, this also suggests that a process similar to that of parsing, by which individuals learning language transform a continuous stream of information into meaningful units [42], might be involved in the cognitive treatment of social information.
The way by which individuals used social information in our experiment may seem surprising because several theoretical works have argued that faithful copying mechanisms are pivotal for both individuals [43] and cumulative culture [44]. However, our results show that individuals were able to completely disregard their own information under certain circumstances (when fellow group members heavily outperformed them), thus producing quite faithful replication of social information. Furthermore, it is still possible that social learning is replicative in some way, for example, if individuals copy discrete properties. Thus, depending on the scale at which we look at cultural evolution, social learning events could look like replicative events or not. In any case, the social learners' propensity to explore did not break down cultural heritability entirely because their arrowheads outperformed the ones the individual learners produced.
It is worthy of note that previous experiments have demonstrated that social learners were more likely to outperform individual learners in complex and multimodal environments, because the latter got stuck on low-fitness local optima, while the former were able to leap from low- to higher-fitness peaks by using social information [36,37]. Here, this mechanism cannot explain our results, as none of the arrowhead dimensions was multimodal. However, the multiple and interacting parameters involved in the fitness function made it probably hard for individuals to improve their designs, which could explain the individual learners' conservatism. This suggests that the use of social information is not only useful to escape a local optimum, but also to open new pathways within complex landscapes.
Further experiments will be necessary to understand more precisely how individuals use social information, but in any case, our experiment demonstrates that social learning is not a passive replicative process. Individuals used social information in a combinatorial and transformative way, which led them to produce new and more efficient tools. Thus, in our experimental setting, the extensive use of social information promoted the exploration of the fitness landscape rather than inhibiting it, as it has been suggested in previous studies based on both a replicative view of social learning and a limited and discrete choice framework [45–49]. In the light of our results, we suggest that individual and social learning should not be modelled as two mutually exclusive behaviours, but as a single inferential process relying on different amounts and/or sources of information. We propose that the use of social information encourages and facilitates the production of inferences, ultimately making individuals more likely to produce innovations (although limiting the risk associated with exploration). This could explain why several studies have shown that individuals, when given the opportunity to observe several others, do not focus only on the best source of information but screen a large number of sources [16,50]. According to our assumption, this strategy could help individuals in two main ways: (i) by providing them with more information to make more accurate inferences and (ii) by allowing them to test their inferences mentally rather than physically (by comparing their predictions with social information).
Finally, we would like to stress the fact that the probability of observing these kinds of social information-induced exploratory behaviours should depend on the individuals' inferential abilities and how risky it is to test them. In the case where the fitness landscape is so complex that individuals are not able to figure out how to improve their behaviour, or in the case where the landscape is so rugged that a slight behavioural variation can strongly reduce payoffs, individuals could exhibit strong social learning biases (such as conformism) and more replicative-like behaviours. In these cases, cultural variation resulting from copying errors could be a more important source of innovation than in the present experiment.
Acknowledgements
We would like to thank K. Belkhir for his help in the establishment of the SQL database, D. Dubois for recruiting students and organizing the experimental session, J. Claude, A. Courtiol and F. Laroche for their helpful advice with the EFA, and all of the people who helped test the computer game. We also wish to thank two anonymous reviewers for their useful comments on a previous version of this article. This publication is the contribution ISEM 2015-067 of the Institut des Sciences de l'Evolution de Montpellier.
Ethics
This study followed the recommendation of the French National Committee of Information and Liberty (CNIL). Each participant agreed to participate before being included in the database managed by the Laboratory of Experimental Economics of Montpellier.
Data Accessibility
The data underlying this study are available on Dryad: doi:10.5061/dryad.1425c.
Authors' Contributions
M.D., R.F., B.G. and M.R. designed the study. R.F. collected data. M.D. and R.F. analysed the data. M.D. wrote the paper. All authors commented on the manuscript.
Competing Interests
The authors have no competing interests.
Funding
This work was partially supported by the John Templeton Foundation grant no. 48952 to the ASU Institute of Human Origins' Evolutionary Foundations of Human Uniqueness research programme (M.D.).
References
- 1.Richerson PJ, Boyd R. 2005. Not by genes alone. Chicago, IL: University of Chicago Press. [Google Scholar]
- 2.Mesoudi A. 2011. Cultural evolution: how Darwinian theory can explain human culture and synthesize the social sciences. Chicago, IL: University of Chicago Press. [Google Scholar]
- 3.Tennie C, Call J, Tomasello M. 2009. Ratcheting up the ratchet: on the evolution of cumulative culture. Phil. Trans. R. Soc. B 364, 2405–2415. ( 10.1098/rstb.2009.0052) [DOI] [PMC free article] [PubMed] [Google Scholar]
- 4.Boyd R, Richerson PJ. 1985. Culture and the evolutionary process. Chicago, IL: University of Chicago Press. [Google Scholar]
- 5.Cavalli-Sforza LL, Feldman MW. 1981. Cultural transmission and evolution: a quantitative approach. Princeton, NJ: Princeton University Press. [PubMed] [Google Scholar]
- 6.Sperber D. 1996. Explaining culture: a naturalistic approach. Oxford, UK: Blackwell. [Google Scholar]
- 7.Claidière N, André J-B. 2012. The transmission of genes and culture: a questionable analogy. Evol. Biol. 39, 12–24. ( 10.1007/s11692-011-9141-8) [DOI] [Google Scholar]
- 8.Kronfeldner M. 2007. Is cultural evolution Lamarckian? Biol. Philos. 22, 493–512. ( 10.1007/s10539-006-9037-7) [DOI] [Google Scholar]
- 9.Mesoudi A, Whiten A, Laland KN. 2004. Is human cultural evolution Darwinian? Evidence reviewed from the perspective of The origin of species. Evolution 58, 1–11. ( 10.1554/03-212) [DOI] [PubMed] [Google Scholar]
- 10.Henrich J, Boyd R. 2002. On modeling cognition and culture. J. Cogn. Cult. 2, 87–112. ( 10.1163/156853702320281836) [DOI] [Google Scholar]
- 11.Heyes CM. 1994. Social learning in animals—categories and mechanisms. Biol. Rev. Camb. Philos. Soc. 69, 207–231. ( 10.1111/j.1469-185X.1994.tb01506.x) [DOI] [PubMed] [Google Scholar]
- 12.Claidière N, Scott-Phillips TC, Sperber D. 2014. How Darwinian is cultural evolution? Phil. Trans. R. Soc. B 369, 20130368 ( 10.1098/rstb.2013.0368) [DOI] [PMC free article] [PubMed] [Google Scholar]
- 13.Bartlett FC. 1932. Remembering. Oxford, UK: Macmillan. [Google Scholar]
- 14.Griffiths TL, Kalish ML, Lewandowsky S. 2008. Theoretical and empirical evidence for the impact of inductive biases on cultural evolution. Phil. Trans. R. Soc. B 363, 3503–3514. ( 10.1098/rstb.2008.0146) [DOI] [PMC free article] [PubMed] [Google Scholar]
- 15.Kempe M, Mesoudi A. 2014. An experimental demonstration of the effect of group size on cultural accumulation. Evol. Hum. Behav. 35, 285–290. ( 10.1016/j.evolhumbehav.2014.02.009) [DOI] [Google Scholar]
- 16.Muthukrishna M, Shulman BW, Vasilescu V, Henrich J. 2013. Sociality influences cultural complexity. Proc. R. Soc. B 281, 20132511 ( 10.1098/rspb.2013.2511) [DOI] [PMC free article] [PubMed] [Google Scholar]
- 17.Wisdom TN, Goldstone RL. 2010. Social learning and cumulative mutual improvement in a networked group. In Proc. 32nd Annual Conf. of the Cognitive Science Society, pp. 1405–1410. [Google Scholar]
- 18.Wisdom TN, Song X, Goldstone RL. 2013. Social learning strategies in networked groups. Cogn. Sci. 37, 1383–1425. ( 10.1111/cogs.12052) [DOI] [PubMed] [Google Scholar]
- 19.Galef JBG. 1995. Why behaviour patterns that animals learn socially are locally adaptive. Anim. Behav. 49, 1325–1334. ( 10.1006/anbe.1995.0164) [DOI] [Google Scholar]
- 20.Perreault C, Moya C, Boyd R. 2012. A Bayesian approach to the evolution of social learning. Evol. Hum. Behav. 33, 449–459. ( 10.1016/j.evolhumbehav.2011.12.007) [DOI] [Google Scholar]
- 21.Galef BG, Whiskin EE. 2008. ‘Conformity’ in Norway rats? Anim. Behav. 75, 2035–2039. ( 10.1016/j.anbehav.2007.11.012) [DOI] [Google Scholar]
- 22.Basalla G. 1988. The evolution of technology. Cambridge, UK: Cambridge University Press. [Google Scholar]
- 23.Lehmann L, Wakano JY. 2013. The handaxe and the microscope: individual and social learning in a multidimensional model of adaptation. Evol. Hum. Behav. 34, 109–117. ( 10.1016/j.evolhumbehav.2012.11.001) [DOI] [Google Scholar]
- 24.Toelch U, Bruce MJ, Meeus MTH, Reader SM. 2011. Social performance cues induce behavioral flexibility in humans. Front. Psychol. 2, 160 ( 10.3389/fpsyg.2011.00160) [DOI] [PMC free article] [PubMed] [Google Scholar]
- 25.Team RDC. 2011. R: a language and environment for statistical computing. Vienna, Austria: R Foundation for Statistical Computing. [Google Scholar]
- 26.Bivand R, Leisch F, Maechler M. 2011. pixmap: bitmap images (‘pixel maps’). Retrieved from http://cran.r-project.org/web/packages/pixmap/.
- 27.Claude J. 2008. Morphometrics with R. New York, NY: Springer. [Google Scholar]
- 28.Kuhl FP, Giardina CR. 1982. Elliptic Fourier features of a closed contour. Comp. Vis. Graph 18, 236–258. ( 10.1016/0146-664X(82)90034-X) [DOI] [Google Scholar]
- 29.Crampton JS. 1995. Elliptic Fourier shape analysis of fossil bivalves: some practical considerations. Lethaia 28, 179–186. ( 10.1111/j.1502-3931.1995.tb01611.x) [DOI] [Google Scholar]
- 30.Courtiol A, Ferdy JB, Godelle B, Raymond M, Claude J. 2010. Height and body mass influence on human body outlines: a quantitative approach using an elliptic Fourier analysis. Am. J. Phys. Anthropol. 142, 22–29. [DOI] [PubMed] [Google Scholar]
- 31.Zhang D, Lu G. 2003. A comparative study on shape retrieval using Fourier descriptors with different shape signatures. J. Vis. Communication Image Representation 14, 41–60. ( 10.1016/S1047-3203(03)00003-8) [DOI] [Google Scholar]
- 32.Bates D, Maechler M, Bolker B, Walker S. 2014. lme4: linear mixed-effects models using Eigen and S4. Retrieved from http://cran.r-project.org/web/packages/lme4/.
- 33.De Rosario-Martinez H. 2013. phia: post-hoc interaction analysis. Retrieved from http://cran.r-project.org/web/packages/phia/.
- 34.Reader SM, Laland KN. 2003. Animal innovation. Oxford, UK: Oxford University Press. [Google Scholar]
- 35.Rogers EM. 2003. Diffusion of innovations. New York, NY: Free Press. [Google Scholar]
- 36.Mesoudi A, O'Brien MJ. 2008. The cultural transmission of Great Basin projectile-point technology I: an experimental simulation. Am. Antiq. 73, 3–28. ( 10.2307/25470456) [DOI] [Google Scholar]
- 37.Mesoudi A. 2008. An experimental simulation of the ‘copy-successful-individuals’ cultural learning strategy: adaptive landscapes, producer–scrounger dynamics, and informational access costs. Evol. Hum. Behav. 29, 350–363. ( 10.1016/j.evolhumbehav.2008.04.005) [DOI] [Google Scholar]
- 38.Henrich J. 2004. Demography and cultural evolution: how adaptive cultural processes can produce maladaptive losses—the Tasmanian case. Am. Antiq. 69, 197–214. ( 10.2307/4128416) [DOI] [Google Scholar]
- 39.Derex M, Beugin M-P, Godelle B, Raymond M. 2013. Experimental evidence for the influence of group size on cultural complexity. Nature 503, 389–391. ( 10.1038/nature12774) [DOI] [PubMed] [Google Scholar]
- 40.Rendell L, et al. 2010. Why copy others? Insights from the Social Learning Strategies Tournament. Science 328, 208–213. ( 10.1126/science.1184719) [DOI] [PMC free article] [PubMed] [Google Scholar]
- 41.Rendell L, Boyd R, Enquist M, Feldman MW, Fogarty L, Laland KN. 2011. How copying affects the amount, evenness and persistence of cultural knowledge: insights from the social learning strategies tournament. Phil. Trans. R. Soc. B 366, 1118–1128. ( 10.1098/rstb.2010.0376) [DOI] [PMC free article] [PubMed] [Google Scholar]
- 42.Saffran JR, Senghas A, Trueswell JC. 2001. The acquisition of language by children. Proc. Natl Acad. Sci. USA 98, 12 874–12 875. ( 10.1073/pnas.231498898) [DOI] [PMC free article] [PubMed] [Google Scholar]
- 43.Enquist M, Eriksson K, Ghirlanda S. 2007. Critical social learning: a solution to Rogers's paradox of nonadaptive culture. Am. Anthropol. 109, 727–734. ( 10.1525/aa.2007.109.4.727) [DOI] [Google Scholar]
- 44.Lewis HM, Laland KN. 2012. Transmission fidelity is the key to the build-up of cumulative culture. Phil. Trans. R. Soc. B 367, 2171–2180. ( 10.1098/rstb.2012.0119) [DOI] [PMC free article] [PubMed] [Google Scholar]
- 45.Rogers AR. 1988. Does biology constrain culture? Am. Anthropol. 90, 819–831. ( 10.1525/aa.1988.90.4.02a00030) [DOI] [Google Scholar]
- 46.Rendell L, Fogarty L, Laland KN. 2010. Rogers’ paradox recast and resolved: population structure and the evolution of social learning strategies. Evolution 64, 534–548. ( 10.1111/j.1558-5646.2009.00817.x) [DOI] [PubMed] [Google Scholar]
- 47.Feldman MW, Aoki K, Kumm J. 1996. Individual versus social learning: evolutionary analysis in a fluctuating environment. Anthropol. Sci. 104, 209–231. ( 10.1537/ase.104.209) [DOI] [Google Scholar]
- 48.Wakano JY, Aoki K, Feldman MW. 2004. Evolution of social learning: a mathematical analysis. Theor. Popul. Biol. 66, 249–258. ( 10.1016/j.tpb.2004.06.005) [DOI] [PubMed] [Google Scholar]
- 49.Kameda T, Nakanishi D. 2002. Cost–benefit analysis of social/cultural learning in a nonstationary uncertain environment—an evolutionary simulation and an experiment with human subjects. Evol. Hum. Behav. 23, 373–393. ( 10.1016/S1090-5138(02)00101-0) [DOI] [Google Scholar]
- 50.Derex M, Godelle B, Raymond M. 2013. Social learners require process information to outperform individual learners. Evolution 67, 688–697. ( 10.1111/j.1558-5646.2012.01804.x) [DOI] [PubMed] [Google Scholar]
Associated Data
This section collects any data citations, data availability statements, or supplementary materials included in this article.
Data Availability Statement
The data underlying this study are available on Dryad: doi:10.5061/dryad.1425c.