Abstract
Physics-based potentials have been developed for the interactions between proteins and DNA for simulations with the UNRES+NARES-2P force field. The mean-field interactions between a protein and a DNA molecule can be divided into eight categories: (1) nonpolar side chain-DNA base, (2) polar uncharged side chain-DNA base, (3) charged side chain-DNA base, (4) peptide group-phosphate group, (5) peptide group-DNA base, (6) nonpolar side chain-phosphate group, (7) polar uncharged side chain-phosphate group, and (8) charged side chain-phosphate group. Umbrella-sampling molecular dynamics simulations in explicit TIP3P water using the AMBER force field were carried out to determine the potentials of mean force (PMF) for all 105 pairs of interacting components. Approximate analytical expressions for the mean-field interaction energy of each pair of kinds of interacting molecules were then fitted to the PMFs to obtain the parameters of the analytical expressions. These analytical expressions can reproduce satisfactorily the PMF curves corresponding to different orientations of the interacting molecules. The results suggest that the physics-based mean-field potentials of amino acid-nucleotide interactions presented here can be used in coarse-grained simulation of protein-DNA interactions.
1. Introduction
Protein-DNA interactions are crucial in many biological processes, such as DNA transcription,1 DNA replication2, and DNA packaging.3 For instance, in order to activate DNA transcription, a transcription factor protein recognizes the specific DNA sequence and binds to it.1 DNA-binding proteins recognize their DNA binding sites 102–103 times faster than the rate estimated for a diffusion-controlled process.4 In order to recognize the specific DNA binding sites, a protein first searches for its DNA-binding sites through non-specific binding.5 After the protein locates its DNA binding sites, it binds specifically to DNA. Experimental studies show that specific binding is governed by hydrogen bonding between the DNA bases and the protein side chains, and nonspecific binding is dominated by the electrostatic interactions between the phosphate group on the DNA backbone and the protein side chains.6 Little is known about the transition between nonspecific binding and specific binding. It is very difficult to investigate this transition from nonspecific to specific binding by experiments, because the complex of protein and nonspecific DNA is usually not stable, and the transition from nonspecific to specific binding is transient. Moreover, interruption of protein-DNA binding results in human diseases.7–9 It has been found that mutations in transcription-factor proteins cause various diseases, including cancer,10 developmental disorders,11 diabetes,12 cardiovascular disease13 and many other malfunctions.7–9 It is suggested that these mutations may affect the interactions between the transcription factors and their DNA-binding partners.7–9 Therefore, understanding protein-DNA binding interactions is the key to understanding the mechanism of protein-DNA recognition and a full understanding of those disease mechanisms.
The binding of a protein and DNA involves very large molecules and it is, therefore, computationally expensive to study them by means of all-atom simulations. Even with ANTON,14 a supercomputer designed for all-atom molecular dynamics simulations, the number of atoms in the system including solvent cannot exceed 120,000. Moreover, the access to ANTON is limited.
For such large systems, use of a coarse-grained representation, in which several atoms are merged into a single interaction site, is a reasonable way to run real-time simulations. A number of coarse-grained models have been developed to carry out simulations of proteins15–18 and nucleic acids.19–21 One of the examples is the 3SPN model for DNA, with three interaction sites for phosphate, sugar, and base, respectively, developed by de Pablo and coworkers19, which reproduces experimental melting curves of DNA. Gō -like22 potentials were used to describe the base-base interactions in the 3SPN model. Another example is the model developed by Ouldridge et al.20, with one interaction site for the backbone and two interaction sites for the base, that reproduces the experimental properties of base stacking, double-strand DNA melting, and DNA hairpin formation. Finally, the DNA model developed by Maciejczyk et al.21, with two interaction sites per backbone unit and 4–6 interaction sites for the base, depending on the type of the base, folds DNA double helices from separated strands and predicts the mechanism of double-strand DNA hybridization. There are also other DNA models that are under development such as, e.g., the Martini DNA model.23
There are also coarse-grained models for the simulations of protein-nucleic acid interactions24–26, some of which are knowledge based24, and some of which are physics-based.25,26 The recent physics-based protein-DNA models25–26 emphasize the electrostatic interaction to protein-DNA interactions. Their results25,26 from molecular dynamics (MD) simulations suggest that the sliding motion of a protein along DNA is governed by electrostatic interactions between a protein and a DNA molecule. However, in order to investigate the transition between specific binding and nonspecific binding, besides the role of electrostatic interactions, the van de Waals interaction and the effect of solvent must also be taken into consideration. The knowledge-based protein-DNA models,24 on the other hand, can be used to produce the structure of protein-nucleic acid complexes and the free energy of binding, but their use in the simulation of the dynamics of protein-nucleic acid complexes is limited.
In this paper, we develop a physics-based coarse-grained model for protein-DNA interactions, which is intended to be used with the physics-based UNited RESidue (UNRES) model27–35 for proteins developed in our laboratory, and with the Nucleic Acid united RESidue model36 (NARES-2P) with 2 interaction sites per nucleotide developed recently in our laboratory. Both models share a similar description of the biopolymer chains, and of the derivation of the effective energy function. They are, therefore, good candidates with which to construct a model to treat protein-DNA complexes. UNRES scored substantial success in protein structure predictions,37–39 including the recent CASP10 exercise,38 while NARES-2P produced the correct double-helix structure of small DNA and RNA molecules and reproduced DNA hybridization thermodynamics reasonably well.36 For instance, for 7 out of 18 systems, the calculated melting temperatures agree with the experimental values within about 6 degrees; for 2 systems, they differ from the experimental values by about 50 degrees; and the remaining 9 systems are in between.36 NARES-2P also reproduces internal loop (bubble) formation in AT-pair-rich DNA structures.
2. Theory
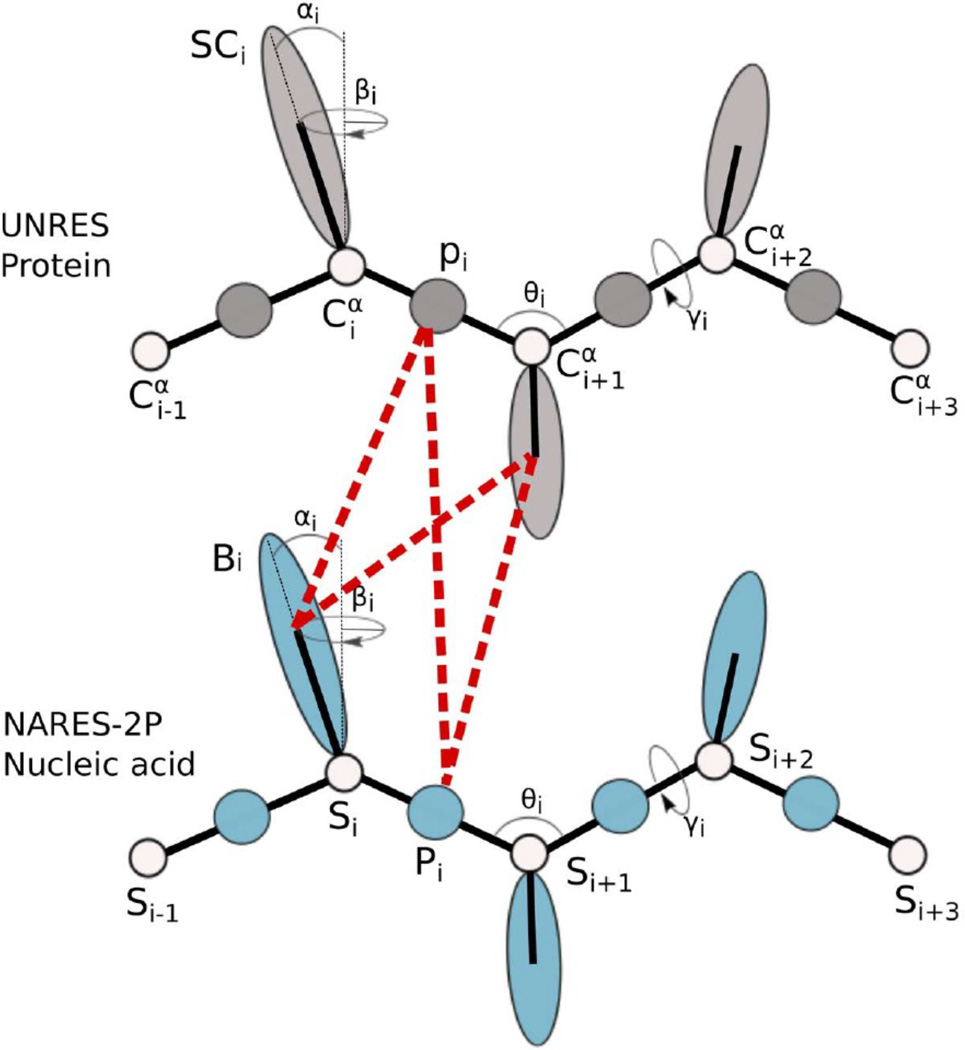
In the UNRES and NARES-2P models, the potential terms are all potentials of mean force; in what follows the term “potential” is, therefore, understood as “potential of mean force”. In the UNRES model27–35 (Figure 1), a polypeptide chain is represented by a sequence of α -carbon (Cα) atoms linked by virtual bonds, with united peptide groups (p) and united side chains (SC). Each united peptide group is located in the middle between two neighboring α -carbons. Only united peptide groups and the centers of mass of the united side chains serve as interaction sites. The α -carbons serve only to define the backbone of the chain. The energy function of the virtual-bond chain in the UNRES model is expressed by Eq. 1
| (1) |
with the temperature dependent factor expressed by Eq. 2.
| (2) |
The respective terms in Eq. 1 represent side chain-side chain interaction potentials, side chain-peptide group interaction potentials, peptide group-peptide group interaction potentials, torsional potentials, double-torsional potentials, virtual bond-angle bending potentials, side-chain rotamer potentials, virtual-bond-deformation potentials, multibody (correlation) interaction potentials, turn contributions, formation of disulfide bonds, and side-chain backbone correlation potentials, respectively. More details of the theoretical basis of the UNRES force field is described in our previous work.27–35
Figure 1.
Illustration of the coarse-grained models of polypeptide and nucleotide chains, UNRES and NARES-2P, respectively. In UNRES, the interacting sites are peptide groups (shaded spheres labeled p) and side chains (shaded ellipsoids labeled SC). The white spheres represent α carbon atoms (labeled Cα), which are introduced to define the geometry of the backbone. In NARES-2P, the interacting sites are phosphate groups (blue spheres labeled P) and nucleic-acid bases (blue ellipsoids labeled B). A white sphere represents the sugar ring (labeled S); P and S are used to define the geometry of the backbone. The components of the protein-nucleic acid mean-field interaction in the UNRES+NARES-2P representation are also shown as red dashed lines.
In the NARES-2P model (Figure 1), a polynucleotide chain is represented by a sequence of virtual sugar atoms (S), located at the geometrical centers of the sugar rings, linked by virtual bonds with united phosphate groups (P) located in the middle between two consecutive S centers, and united sugar-bases (B). The center of mass of a united sugar-base and of the united phosphate group serve as coarse-grained interaction sites, while the S centers serve only to define the backbone (see Figure 1 of ref. 36 for details). The energy function of the virtual-bond chain in the NARES-2P model is expressed by Eq. 3
| (3) |
where f2 (T) is expressed by Eq. 2. The respective terms in Eq. 3 represent base-base van der Waals interaction potentials [expressed by the GB (Gay-Berne) functional form40], base dipole-base dipole mean-field interaction potentials, phosphate group-phosphate group mean-field interaction potentials, phosphate group-base interaction potentials, virtual-bond stretching potentials, bond-angle bending potentials, torsional potentials, sugar-base rotamer potentials (illustrated in Fig. 1 of ref. 36), and restraint on the distance between the 5′ end of one chain and the 3′ end of the other chain interactions, respectively, to be less than dmax, where dmax depends on the concentration of the single chains. More details of the theoretical basis of the NARES-2P force field are described in our previous work.36
In UNRES, NARES-2P, and in the protein-DNA potentials developed in this work, water is implicit, i.e., its presence is accounted for by the respective terms of the effective potentials; and by the cavity potential term and the solvent-polarization term in this work. In other words, the solvent degrees of freedom are averaged out. The advantage of this treatment is a tremendous speed-up of simulations; the total speed-up of UNRES amounts to 3–4 orders of magnitude compared to all-atom simulations with explicit water41. The absence of explicit water does not seem to reduce the ability of UNRES to predict protein structure or NARES-2P to predict the structure and thermodynamics of DNA molecules to a significant extent.
As shown in Figure 1, the protein-DNA interactions consist of the peptide group-phosphate group interaction potential, the peptide group-base interaction potential, the side chain-phosphate group interaction potential, and the side chain-base interaction potential.
Based on their physical properties, the side chains of proteins can be divided further into three categories: (1) nonpolar side chains, (2) polar uncharged side chains, and (3) charged side chains. Therefore, the pairs of interacting sites between proteins and DNA can then be divided into eight groups, which are (1) nonpolar side chain-base, (2) polar uncharged side chain-base, (3) charged side chain-base, (4) peptide group-phosphate group, (5) peptide group-base, (6) nonpolar side chain-phosphate group, (7) polar uncharged side chain-phosphate group, and (8) charged side chain-phosphate group. The complete coarse-grained energy function to describe protein-DNA interactions is given by Eq. 4
| (4) |
where UP is the effective energy function of a protein expressed by Eq. 1, UN is the effective energy function of a nucleic acid expressed by Eq. 3, and UPN is the effective energy function of a protein-nucleic acid system expressed by Eq. 5.
| (5) |
where NSC, PSC, and CSC denote the nonpolar, polar, and charged side chains, respectively, p denotes a peptide group, P denotes a phosphate group, UAi-Bj denotes the energy of interactions between the ith site of type A and the jth site of type B, and w is the weight for each of the eight corresponding interaction potential terms.
The components of the energy expression given by Eq. 5 are described in detail in section 1 in the Supporting Information (SI).
3. Methods
3.1 Determination of the potentials of mean force
All pairs of interacting side chains and bases were simulated using the AMBER42 package with the AMBER ff10 force field and TIP3P water. Given 20 amino acid side chain and 4 DNA base types, 80 side chain-base pairs, 1 peptide group-phosphate group pair, 4 base-peptide group pairs, and 20 side chain-phosphate group pairs were treated. A 20 Å layer of TIP3P water43 was placed around each side of each pair of interacting components. The charges on the atoms of each solute molecule were determined by using the Antechamber44 utility program of the AMBER package. For charged systems, Cl− or Na+ counter ions were added to neutralize the system. The peptide group, the DNA phosphate group, the amino acid side chains, and the DNA bases were terminally blocked with methyl groups. The Cα atoms were considered as part of the side chains and the sugar ring was kept with the bases (it should be kept in mind that the NARES-2P model uses the united sugar-base centers36). The partial charges of the terminally blocked peptide group, the phosphate group, and those of the glutamine side chain, and the cytosine nucleoside, which serve as examples of an amino-acid side chain and a nucleoside, respectively, are shown in Figure 2.
Figure 2.
Partial atomic charges of terminally-blocked peptide group (a), phosphate group (b), glutamine side chain (c), and cytosine nucleoside with sugar ring and base (d). Both ends of the peptide group (a) and phosphate group (b) are blocked by methyl groups. Only the left end of the glutamine side chain (c) and the cytosine nucleoside (d) are blocked by a methyl group. The right end of the glutamine side chain and the cytosine nucleoside are free.
Energy minimization was carried out first for each system before running MD simulations. Then equilibration MD simulations were run at T = 300K for 100 ps (picoseconds) with a time step of 2fs under constant pressure and temperature for partial equilibration. Then, production MD simulations were run at 300K for 10 ns (nanoseconds) with a time step of 2 fs under constant volume and temperature.45 A cutoff of 9 Å was applied to van der Waals interaction energies. Electrostatic-interaction energy was calculated by using the Particle Mesh Ewald (PME) method.46 To evaluate how the cutoff of van der Waals interactions affects the PMF, simulations with different cutoff at 9 Å, 10 Å, and 11 Å were run for the arginine side chain and adenine base pair.
For each system, a series of 10 umbrella-sampling simulations with different restraints for each simulation was run with harmonic-restraint potentials imposed on the different distances between the atoms closest to the center of mass of each of the molecules, as shown by Eq. 6,
| (6) |
where k is the force constant [set to 2 kcal/(mol × Å2)], as it provides good sampling32,33, r is the distance between two specified atoms with restraints, and is the center of the restraint on these two atoms in the ith window. The values of r0 were 4, 5, 6, 7, 8, 9, 10, 11, 12, and 13 Å. For each window, a total of 50,000 snapshots were collected.
The PMF of each interacting pair was calculated from all the snapshots from each window by using the weighted histogram analysis method (WHAM).47,48 For a given side-chain/base pair, the PMF can be constructed in rij, and φij. The ranges and bin sizes were: distance 4.0Å ≤ rij ≤ 13.0 Å with bin size of 0.2 Å for the rij, angles with bin size of 60° for the angle, angles with bin size of 60° for the angle, and angles −180° ≤ φij ≤ 180° with bin size of 60° for the φij angle. Hence, for every side-chain/base pair, there are 3, 3, and 6 bins for , φij, respectively, or a total of 54 orientations. To assess the convergence of the simulations, we used the arginine-adenine system, which is composed of the largest amino-acid side chain and the largest nucleic-acid base, respectively; therefore, the most significant convergence problems can be expected for this system. For this system, we compared the PMF calculated using the first 5 ns (25,000 snapshots) of the simulation and the last 5 ns of simulations.
3.2 Fitting analytical expressions to the potentials of mean force
The analytical expressions presented in the section 1 in the Supporting Information were fitted to the PMFs from the MD simulations by minimizing the sum of the squares of the differences (Φ) between the PMF values calculated from the analytical potential functions and the PMF from the MD simulations by using the Marquardt method.49 Φ is defined by Eq. 7
| (7) |
where is the PMF value determined from the MD simulations for distance rij and orientation is the PMF value calculated by using the analytical potential functions at distance rij and orientation calculated with parameters given by the vector y⃑, (whose components are the adjustable parameters), of equations in the section 1 in the Supporting Information. The weight of the ith data point wi is defined by Eq. 8.
| (8) |
where Wmin is the minimum PMF obtained in the simulations for a given system, R is the gas constant, and T = 300K is the absolute temperature. Each data point was weighted with the Boltzmann defined by Eq. 8. Weighting the data points by the Boltzmann factor (Eq. 8) assigns greater importance to low-energy regions of the free-energy surface.
Except for , ai, and εout (we set εout = 80), all the other parameters were determined by least-squares fitting of the analytical expressions for the PMFs of the nonpolar side chains and bases (Eq. S1), the polar uncharged side chain and base (Eq. S13), and the charged side chain and base (Eq. S20), peptide group and phosphate group (Eq. S24), base and peptide group (Eq. S28), nonpolar side chain and peptide group (Eq. S29), polar uncharged side chain and peptide group (Eq. S34), and charged side chain and peptide group (Eq. S36) in water, to the corresponding PMFs determined from the MD simulations. The value of the parameter is fixed in each least-squares fitting. By manually trying different values of in each fitting, the value of is finally determined by the minimum value of Φ presented in Eq. 7.
4. Results and Discussion
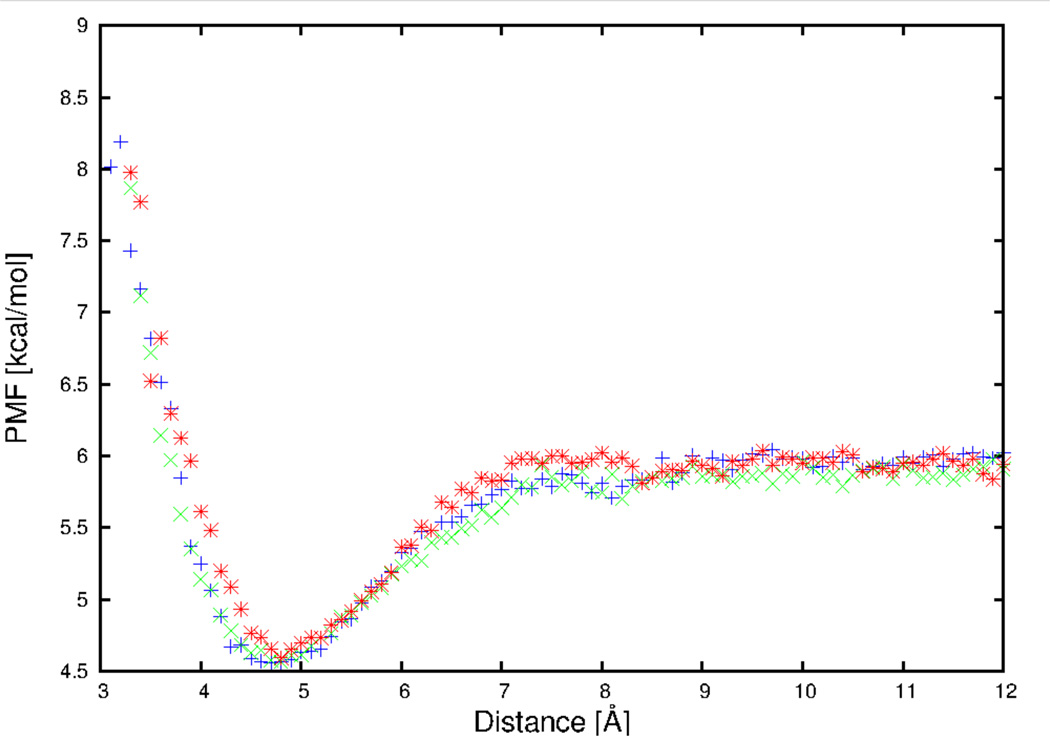
In previous work on the deviation of side chain-side chain potentials,32–33 9 Å cutoff for van der Waals interaction with the PME method was used. To evaluate if the use of cutoff affects the PMF, simulations were also carried out with cutoffs of 10 Å and 11 Å for the arginine side chain and adenine base pair. The PMF curves for arginine side chain-adenine base pair with different cutoffs, for a selected orientation , and φij = 0°, are presented in Figure 3. It can be seen from Figure 3 that the PMF curves obtained using different cutoffs overlap very well. Thus, with the use of the PME method to calculate electrostatic interactions, different cutoff values do not affect the PMF. For the arginine side chain and adenine base pair, the root-mean-square deviation (RMSD) between PMFs of 9 Å and 10 Å is 0.24 kcal/mol, the RMSD between PMFs of 9 Å and 11 Å is 0.23 kcal/mol, and the RMSD between PMFs of 10 Å and 11 Å is 0.25 kcal/mol. The resulting deviation is due to the fluctuations of the obtained PMFs.
Figure 3.
The PMF curves for arginine side chain and adenine base pair, with cutoffs of 9 Å (blue plus symbols), 10 Å (green cross symbols), and 11 Å (red asterisk symbols), for a selected orientation , and φij = 0.
Figure S10 in the SI displays the PMF curves from the first half (blue cross symbols) and the second half (red circle symbols) of trajectories, for the arginine side chain - adenine base pair, for orientation , and φij = 0°, as an example. It can be seen that the difference between the PMF curves from the two consecutive slices of trajectories is contained within the noise. The RMSD of the PMFs calculated from the first and the second half of the trajectory, respectively, calculated over the distances of the centers of the interacting objects up to 12 Å and over all orientations, is 0.34 kcal/mol. It can, therefore, be concluded that the simulation converged. It should be noted that the arginine-adenine pair contains the largest side chain and the largest base, respectively; therefore, convergence is a more significant issue with this pair compared to other pairs.
4.1 Nonpolar side chain-base interaction potentials
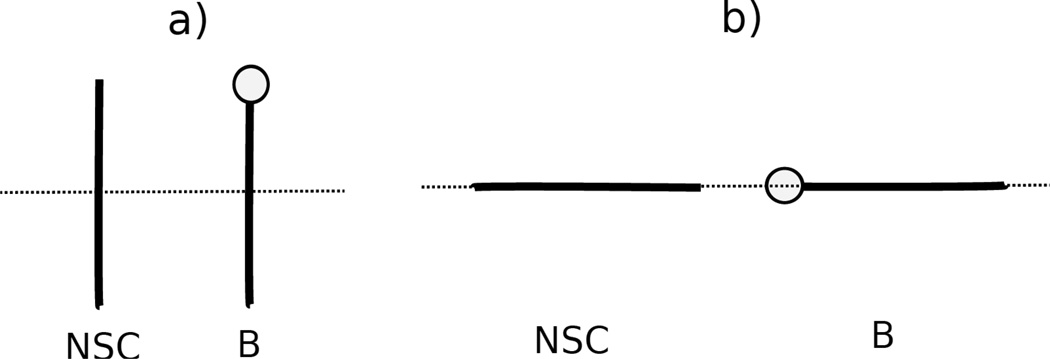
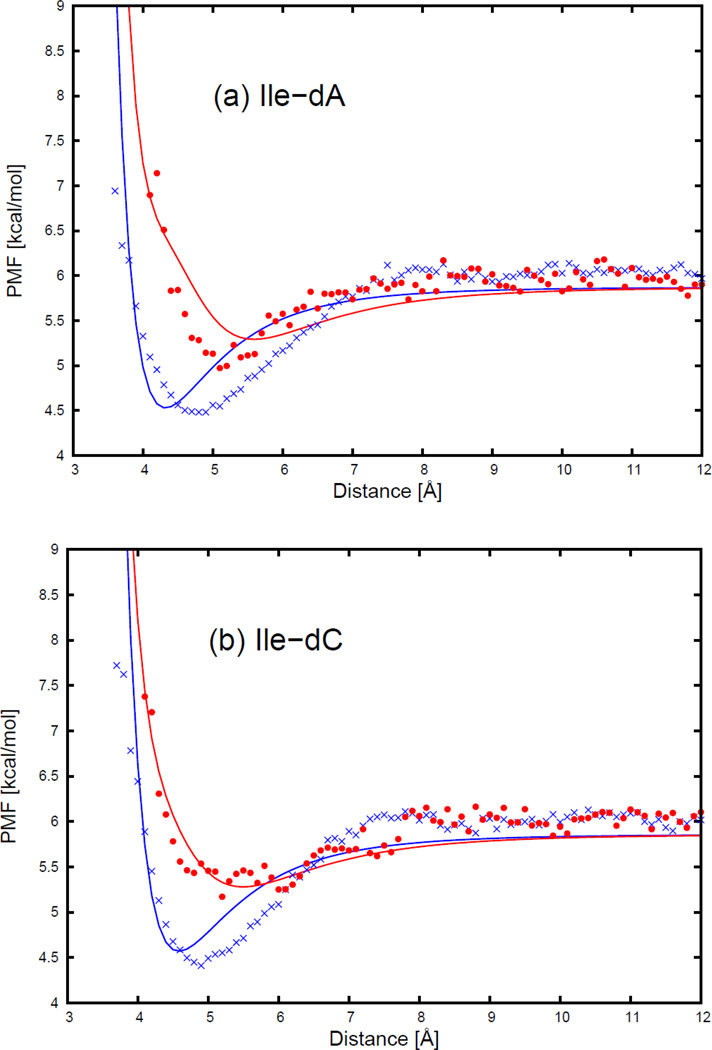
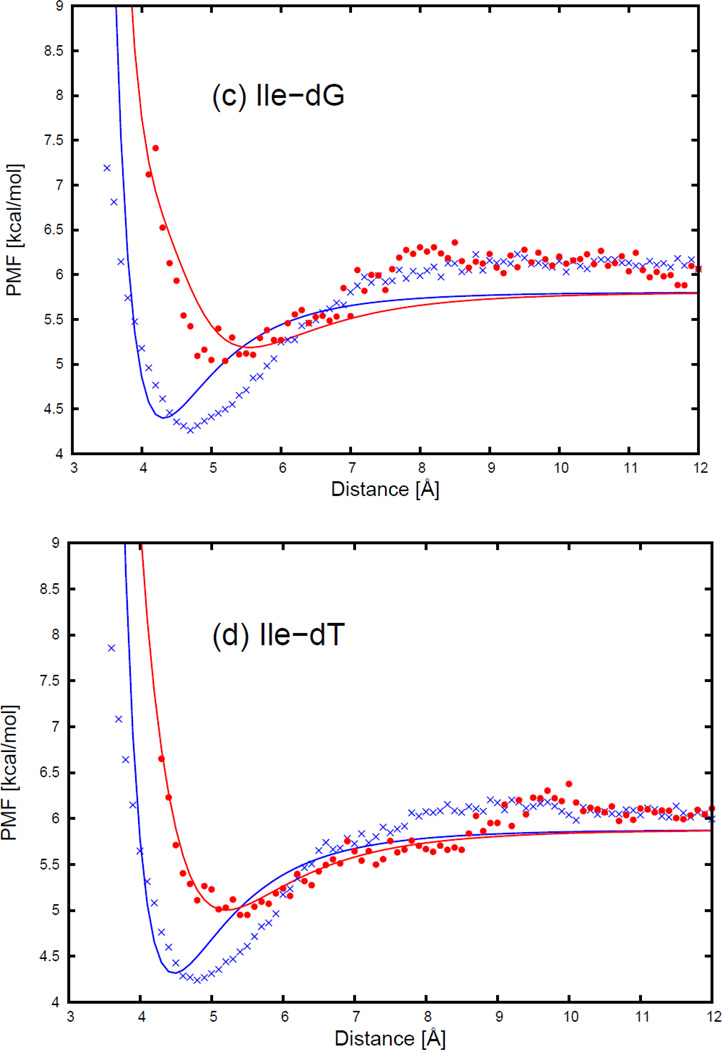
As an example of two selected orientations (Figure 4) for a nonpolar side chain (NSC) with respect to the four DNA bases, Figure 5 displays the sections of the PMF corresponding to different orientations as functions of distance, with fitted curves calculated from Eq. S1, for two selected orientations for pairs composed of the isoleucine side chain and all four base types. The two selected orientations are (a) , and φij = 0° (side-to-side); (b) , and φij undefined (edge-to-head; when and r̂ij overlap, the plane, defined by the vector and the vector r̂ij, no longer exits, and φij becomes undefined.), as shown in Figure 5. 54 orientations of all nonpolar side chains (Ala, Val, Ile, Leu, Met, Phe, Tyr, Trp, His, Cys, Gly, and Pro) and the 4 DNA bases were used in the fitting, but the results are shown here, as an example for only two particular orientations (side-to-side and edge-to-head, as illustrated in Figure 5) for the isoleucine side chain and the four DNA bases. The fitting results for the remaining nonpolar side chains for the side-to-side and the edge-to-head orientations are shown in panels (a1)–(k4) of Figure S11 in the Supporting Information.
Figure 4.
Illustration of two orientations of nonpolar side chain (NSC) and DNA base for (a) , and φij = 0 (side-to-side); (b) , and φij undefined (edge-to-head). The lines represent the long axis of the ellipsoid. The circle at one end of the particle represents the dipole on the ellipsoid.
Figure 5.
The PMF curves for (a) isoleucine side chain-adenine base, (b) isoleucine side chain-cytosine base, (c) isoleucine side chain-guanine base, and (d) isoleucine side chain-thymine base. The blue cross and red circle symbols correspond to PMFs determined from the MD simulations for the side-to-side (Figure 11.a) and the edge-to-head (Figure 11.b) orientations, respectively. The blue and red solid lines correspond to the analytical approximation (Eq. 6) to the PMFs for the side-to-side and the edge-to-head orientations, with parameters determined by least-squares fitting of the analytical expression to the PMF determined by the MD simulations.
As shown in Figure 5, the PMF curves for the isoleucine side chain and four DNA bases have only one deep minimum, which is referred to as the contact minimum. The position of this minimum depends on the size and the orientations of the interacting molecules. The minimum occurs at the shortest distances for the side-to-side orientation (blue cross symbols in Figure 5), and the longest distance for the edge-to-head orientation (red circle symbols in Figure 5). The position of the contact minimum occurs between 4 and 6 Å, depending on the orientation of the interacting molecules. This minimum is deeper and narrower for the side-to-side orientation (blue cross symbols in Figure 5), and shallower and broader for the edge-to-head orientation (red circle symbols in Figure 5). It can be seen from Figure 5 that, for all nonpolar side chain-base pairs, the analytical potential functions (Eq. S1) fit satisfactorily to the PMF determined from the AMBER simulations and reproduce the order of the PMF curves corresponding to different orientations. The fitted parameters of the expressions for EGBerne (Eq. S2) and ΔFcav (Eq. S10) for all the nonpolar side chains and DNA bases are collected in Tables S1–S12 in the Supporting Information. It should be noted that, because the nonpolar part of glycine is spherical in the UNRES representation, the PMFs of the glycine side chain-base interactions depend only on the orientation of the long axis of the base with respect to the line linking the centers of the two interacting sites. Except for glycine, all the other nonpolar side chains have very similar contact patterns as with isoleucine, but the minima of the PMF curves grow deeper as the size of the side chain gets larger.
4.2 Polar uncharged side chain-base interaction potentials
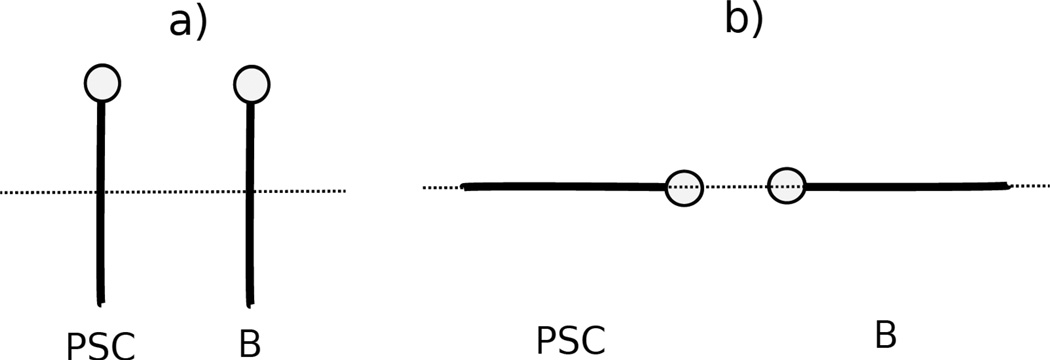
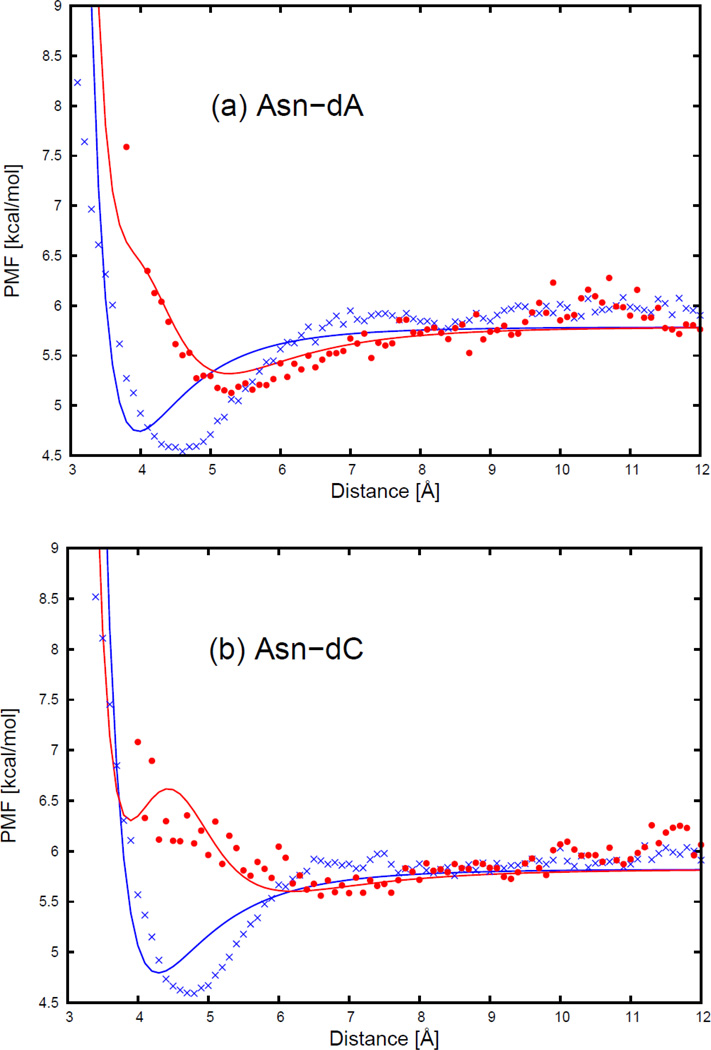
As an example, the PMFs of the asparagine side chain and the four DNA bases, with fitted curves calculated from analytical potential functions using Eq. S13, are plotted, for two selected orientations in Figure 6, as functions of the distance between the centers of the interacting molecule in Figure 7. The two selected orientations in Figure 7 are (a) , and φij = 0 (side-to-side); (b) , and φij undefined (head-to-head). It should be noted that, 54 orientations for all polar uncharged side chains (Ser, Thr, Asn, and Gln) and the 4 DNA bases were used in the fitting, but only the side-to-side and the head-to-head orientation illustrated in Figure 7 for the asparagine side chain and four DNA bases are displayed to show the fitting results here. The fitting results for the remaining polar uncharged side chains for the side-to-side and the head-to-head orientations are presented in panels (l1)–(n4) of Figure S11 in the Supporting Information.
Figure 6.
Illustration of two orientations of polar uncharged side chain (PSC) and DNA base for (a) , and φij = 0 (side-to-side); (b) , and φij undefined (head-to-head). The lines represent the long axis of the ellipsoid. The circle at one end of the particle represents the dipole on the ellipsoid.
Figure 7.
The PMF curves for (a) asparagine side chain-adenine base, (b) asparagine side chain-cytosine base, (c) asparagine side chain-guanine base, and (d) asparagine side chain-thymine base. The blue cross and red circle symbols correspond to PMFs determined from the MD simulations for the side-to-side (Figure 13.a) and the head-to-head (Figure 13.b) orientations, respectively. The blue and red solid lines correspond to the analytical approximation (Eq. 18) to the PMFs for the side-to-side and the head-to-head orientations, with parameters determined by least-squares fitting of the analytical expression to the PMF determined by the MD simulations.
Figure 7 shows that the PMF curves of the asparagine side chain and four DNA bases have only one deep contact minimum. The position of the contact minimum occurs between 4 and 6 Å, depending on the orientation of the interacting molecule. This minimum is deeper and narrower for the side-to-side orientation (blue cross symbols in Figure 7), and shallower and broader for the head-to-head orientation (red circle symbols in Figure 7). The PMF curves for the head-to-head orientation (red circle symbols in Figure 7) are not smooth, because the number of simulation data to determine the PMF was the smallest for the head-to-head orientation. Figure 7 also shows that, for all polar uncharged side chain-base pairs, the analytical potential functions (Eq. S13) fit satisfactorily to the PMF determined from the AMBER simulations and reproduce the order of the PMF curves corresponding to different orientations. The fitted parameters for all polar uncharged side chains and DNA bases are collected in Tables S13–S16 in the Supporting Information. All the other polar uncharged side chains have very similar contact patterns as with asparagine, but the minimum of the PMF curves becomes deeper as the size of the side chain gets larger. In Figure 7b for the asparagine side chain and cytosine base, the fitting curve has a double minimum separated by a maximum between 4 and 5 Å for the head-to-head orientation (red solid line). This maximum may be caused by the strong repulsion between the two dipoles on the asparagine side chain and the cytosine base, when the dipoles approach each other closely by in the head-to-head orientation.
4.3 Charged side chain-base interaction potentials
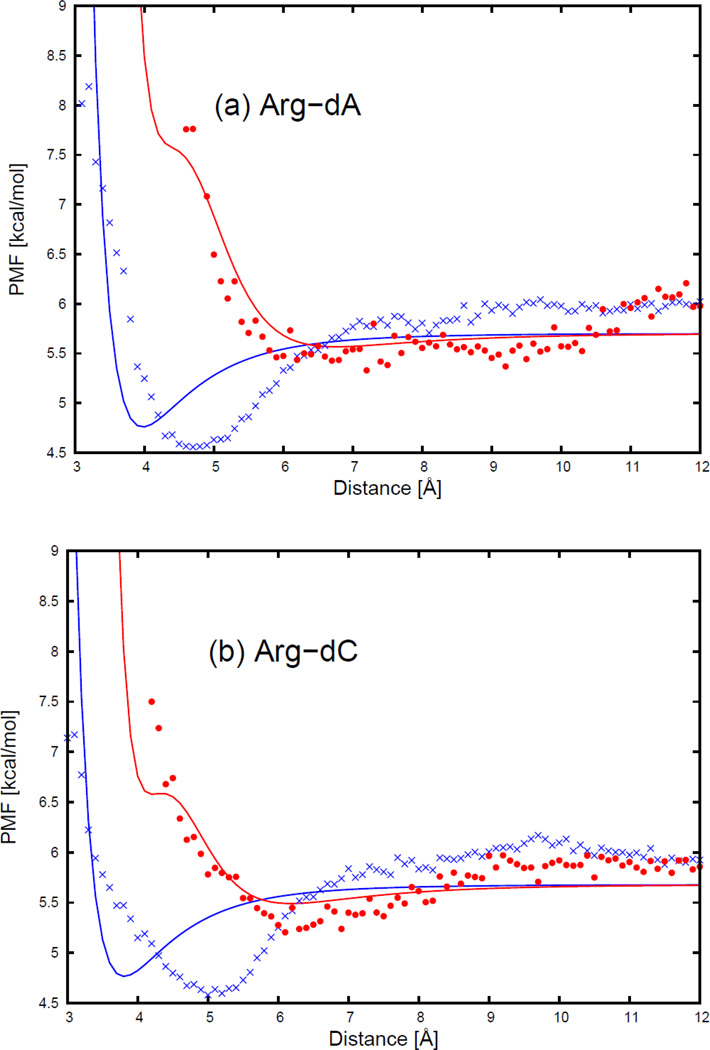
The PMFs of the arginine side chain and the four DNA bases, with fitted curves calculated from analytical expression (Eq. S20), are plotted, for two selected orientations in Figure 8, as functions of distance between the centers of the interacting molecule in Figure 9. The two selected orientations in Figure 8 are (a) , and φij = 0 (side-to-side); (b) , and φij undefined (head-to-head). Although 54 orientations for all charged side chains (Arg, Lys, Asp, and Glu) and the 4 DNA bases were used in the fitting, only the side-to-side and head-to-head orientations illustrated in Figure 8 for the arginine side chain and four DNA bases are selected to show the fitting results in the main text. The fitting results for the remaining charged side chains are presented in panels (o1)–(q4) of Figure S11 in the Supporting Information.
Figure 8.
Illustration of two orientations of charged side chain (CSC) and DNA base for (a) , and φij = 0 (side-to-side); (b) , and φij undefined (head-to-head). The filled circle at one end of the particle represents the charged head group on the side-chain ellipsoid.
Figure 9.
The PMF curves for (a) arginine side chain-adenine base, (b) arginine side chain-cytosine base, (c) arginine side chain-guanine base, and (d) arginine side chain-thymine base. The blue cross and red circle symbols correspond to PMFs determined from the MD simulations for the side-to-side (Figure 15.a) and the head-to-head (Figure 15.b) orientations, respectively. The blue and red solid lines correspond to the analytical approximation (Eq. 25) to the PMFs for the side-to-side and the head-to-head orientations, with parameters determined by least-squares fitting of the analytical expression to the PMF determined by the MD simulations.
It can be seen from Figure 9 that the position of the deepest contact minimum occurs between 3 and 6 Å depending on the orientation of the interacting molecules. This minimum occurs at the shortest distance for the side-to-side orientation (blue cross symbols in Figure 9), and at the longest distance for the head-to-head orientation (red circle symbols in Figure 9). The PMF curves for the head-to-head orientation are not smooth, because the number of simulation data to determine the PMF was the smallest for the head-to-head orientation. Figure 9 also shows that, for all charged side chain-base pairs, the analytical potential functions (Eq. S20) fit satisfactorily to the PMF determined from the AMBER simulation and reproduce the order of the PMF curves corresponding to different orientations. The fitted parameters of the analytical expression for the effective interaction energy for all charged side chains and the DNA bases are collected in Tables S17–S20 in the Supporting Information. As shown in panels (o1)–(q4) of Figure S11 in the Supporting Information, the negatively charged side chains (aspartic acid and glutamic acid) have different contact patterns than the positively charged side chains (arginine and lysine). The PMF curves for the negatively charged side chains have two minima separated by a desolvation maximum. For negatively charged side chains, the highest maximum occurs for head-to-head orientations.
4.4 Peptide group-phosphate group interaction potentials
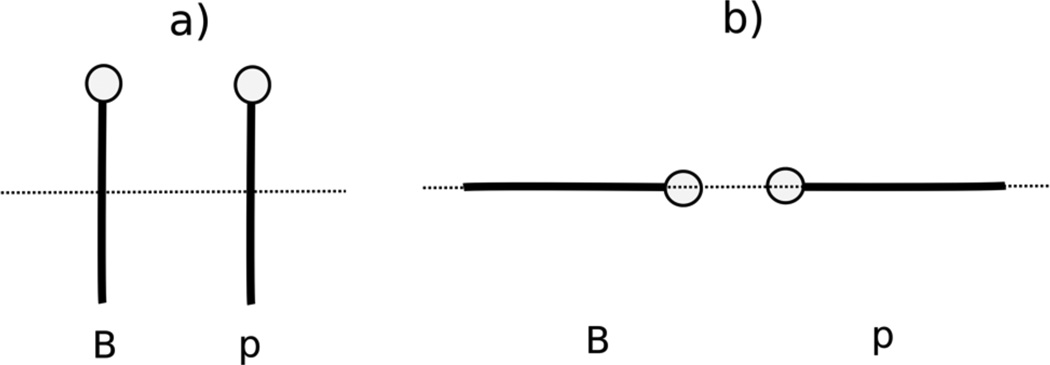
The PMF curves for peptide group-phosphate group interactions, were fitted with the analytical potential functions (Eq. S24 of the Supporting Information), for three orientations in Figure 10, and are plotted as functions of distance between the centers of the interacting molecules in Figure 11. The three orientations are (a) (head-to-phosphate), (b) (side-to-phosphate), and (c) (edge-to-phosphate), respectively, as shown in Figure 10.
Figure 10.
Illustration of three orientations of peptide group-phosphate group interactions for (a) (head-to-phosphate), (b) (side-to-phosphate), and (c) (tail-to-phosphate), respectively. The solid line represents the long axis of the peptide group. The circle at one end of the solid line represents the dipole on the peptide group (p). The black circle represents the phosphate group (P).
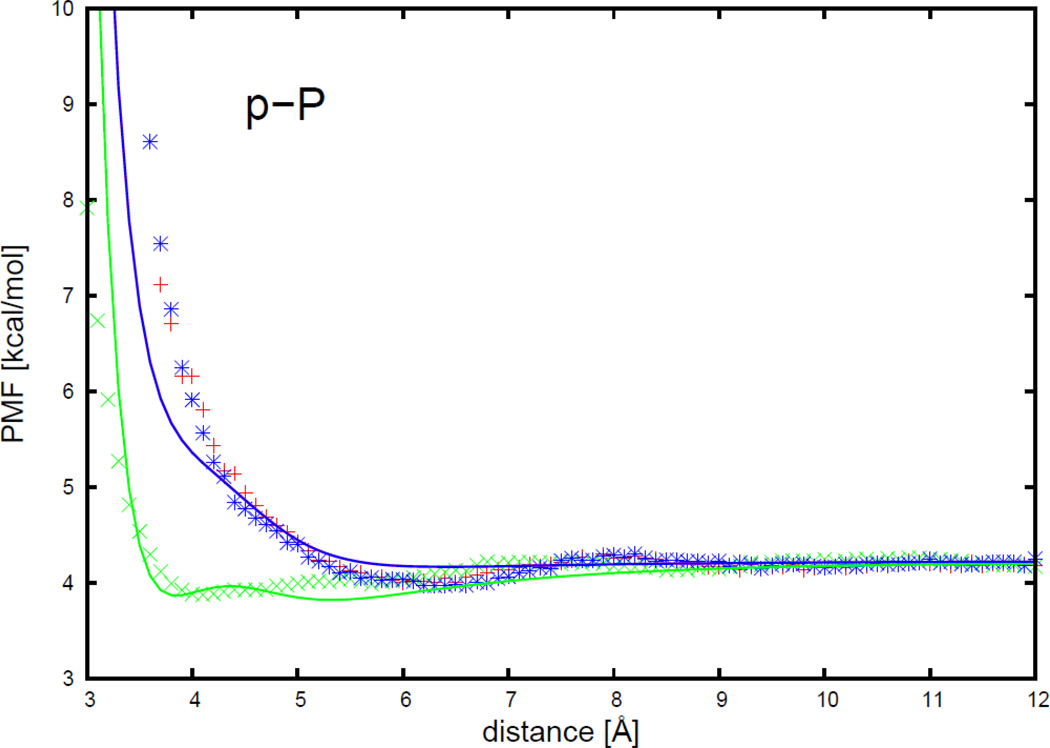
Figure 11.
The PMF curves for peptide group-phosphate group interactions. The red-plus, green-cross, and blue-asterisk symbols correspond to the PMFs determined from MD simulations for orientations (a) (head-to-phosphate), (b) (side-to-phosphate), and (c) (tail-to-phosphate), respectively. The red, green, and blue solid lines correspond to the analytical approximation (Eq. 29) to the PMFs for orientations a, b, and c of Figure 17 respectively, with parameters determined by least-squares fitting of the analytical expression to the PMF determined by the MD simulations.
As shown in Figure 11, the PMF curves for the peptide group-phosphate group interactions for the head-to-phosphate orientation (red plus symbols) and the edge-to-phosphate orientation (blue asterisk symbols) overlap. The peptide group-phosphate group PMF curves have only one broad minimum, which is referred to as the contact minimum. The minimum occurs at longer distances for the head-to-phosphate orientation and the edge-to-phosphate orientation, and shorter distance for the side-to-phosphate orientation (green cross symbols). The positions of the contact minimum occurs at about 4 Å for the side-to-phosphate orientation and, between 6 and 7 Å for the head-to-phosphate orientation and the tail-to-phosphate orientation. The depth of the minimum is about the same for all three orientations. It can be seen from Figure 11 that, for peptide group-phosphate group pair, the analytical potential functions (Eq. S24) fit satisfactorily to the PMFs determined from the AMBER simulations and reproduce the order of the minima of the PMF curves corresponding to different orientations. The fitted parameters of the analytical expressions for the effective peptide group-phosphate group interaction energies are presented in Table S21 in the Supporting Information. It can be seen from Table S21 that the parameter w‖ for the mean-field dipole-charge interaction potential (Eq. S21) is 4 orders of magnitude less than w⊥. This shows that, when the angle α in Eq. S21 is close to 0° (see Figure S9), the major part of the dipole-charge interaction potential comes from the perpendicular contribution. When the angle α in Eq. S21 is close to 90°, the contributions of the perpendicular and parallel composition of the dipole-charge interaction potential are closer to each other.
4.5 Peptide-base interaction potentials
The PMF curves for peptide group interactions with four DNA bases, with the fitted curves calculated from analytical potential functions using Eq. S28, for two selected orientations in Figure 12, are plotted as functions of distance between the centers of the interacting molecules in Figure 13. The two selected orientations are (a) , and φij = 0° (side-to-side) and (b) , and φij undefined (head-to-head), respectively, as shown in Figure 12. Although 54 orientations of four DNA bases and a peptide group are considered in the fitting, only these two orientations are selected to show the fitting results in Figure 13.
Figure 12.
Illustration of two orientations of DNA base-peptide group interactions for (a) , and φij = 0 (side-to-side); (b) , and φij undefined (head-to-head). The solid lines represent the long axis of the base (B) and peptide group (p). The circle at one end of the solid line represents the dipole.
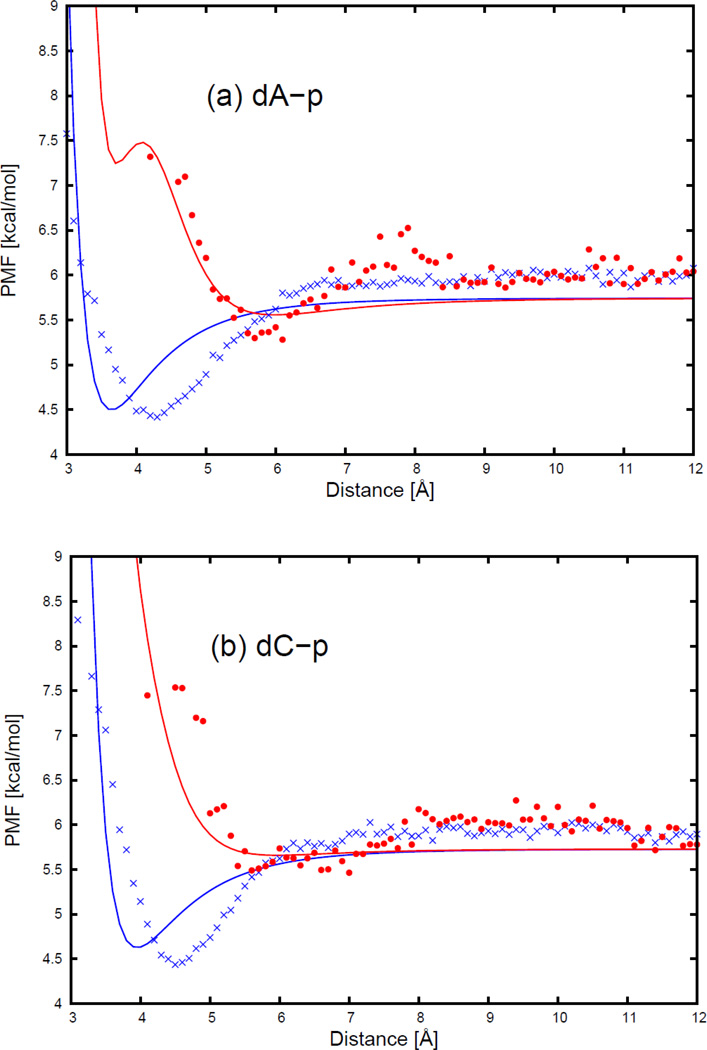
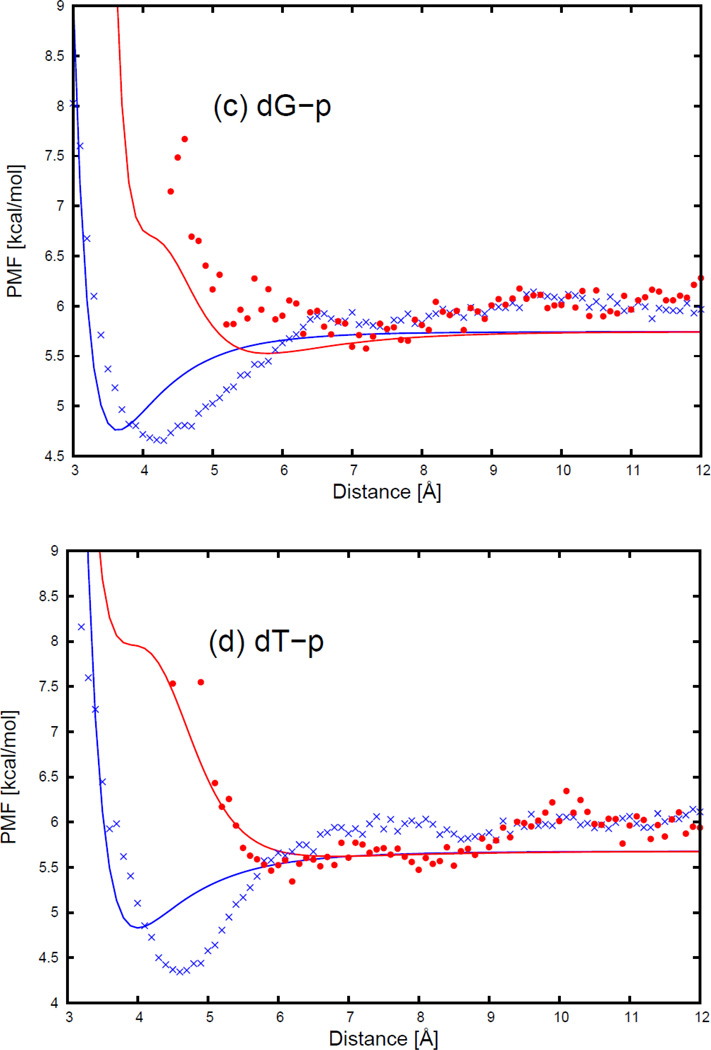
Figure 13.
The PMF curves for (a) adenine base-peptide group, (b) cytosine base-peptide group, (c) guanine base-peptide group, and (d) thymine base-peptide group interactions. The blue-cross and red-circle symbols correspond to PMFs determined from the MD simulations for orientation (a) , and φij = 0° (side-to-side); (b) , and φij undefined (head-to-head), respectively. The blue and red solid lines correspond to the analytical approximation (Eq. 33) to the PMFs for side-to-side and head-to-head orientations of Figure 19, with parameters determined by least-squares fitting of the analytical expression to the PMF determined by the MD simulations.
In Figure 13 (a), the PMF curves for the adenine base-peptide group interactions have one deep contact minimum. The contact minimum is the deepest for the side-to-side orientation (blue cross symbols), and the shallowest for the head-to-head orientation (red circle symbols). The contact minimum occurs at a shorter distance for the side-to-side orientation and at a longer distance for the head-to-head orientation. Panels (b), (c), and (d) in Figure 13 show that the cytosine, guanine, and thymine bases have contact patterns with a phosphate group, as similar as the adenine-phosphate contact pattern. Figure 13 (a) also shows a maximum for the head-to-head orientation at about 4 Å. This maximum occurs because of the strong repulsion between the two dipoles on the base and peptide group, when the base and peptide group are close to each other. It can be seen from Figure 13 that, for all peptide group-base pairs, the analytical potential functions (Eq. S28) fit satisfactorily to the PMFs determined from the AMBER simulations, and reproduce the order of the minima of the PMF curves corresponding to different orientations. The fitted parameters for four DNA bases and a peptide group are collected in Table S22 of the Supporting Information. It can been seen from Table S22 that there is a significant difference between the anisotropies of purines and pyrimidines.
4.6 Nonpolar side chain-phosphate group interaction potentials
The PMF curves of 11 nonpolar side chains (Ala, Cys, Gly, Val, Ile, Leu, Met, Phe, Pro, Trp, and Tyr) and a phosphate group, with fitted curves calculated from the analytical potential functions by using Eq. S29, for three orientations in Figure 14, are plotted as functions of distance between the centers of the interacting molecules in Figure 15. The three selected orientations are (a) (edge-to-phosphate), (b) (side-to-phosphate), and (c) (edge-to-phosphate), respectively, as shown in Figure 14.
Figure 14.
Illustration of three orientations of nonpolar side chain-phosphate group interactions for (a) (edge-to-phosphate), (b) (side-to-phosphate), and (c) (edge-to-phosphate), respectively. The solid line represents the long axis of the nonpolar side chain (NSC). The black circle represents phosphate group (P).
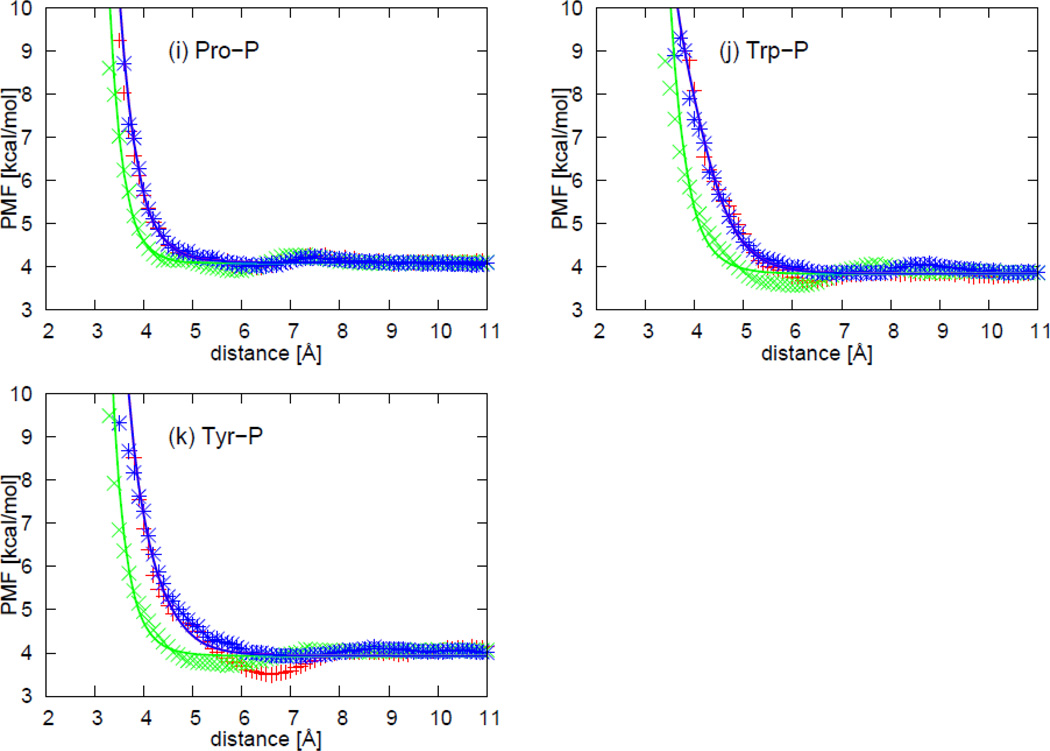
Figure 15.
The PMF curves for 11 nonpolar side chains-phosphate group interactions: (a) alanine side chain-phosphate group, (b) cysteine side chain-phosphate group, (c) glycine side chain-phosphate group, (d) valine side chain-phosphate group, (e) isoleucine side chain-phosphate group, (f) leucine side chain-phosphate group, (g) methionine side chain-phosphate group, (h) phenylalanine side chain-phosphate group, (i) proline side chain-phosphate group, (j) tryptophan side chain-phosphate group, and (k) tyrosine side chain-phosphate group. The red-plus, green-cross, and blue-asterisk symbols correspond to PMFs determined from the MD simulations for orientation (a) (edge-to-phosphate), (b) (side-to-phosphate), and (c) (edge-to-phosphate), respectively. The red, green, and blue solid lines correspond to the analytical approximation (Eq. 34) to the PMFs for orientation a, b, and c of Figure 21, with parameters determined by least-squares fitting of the analytical expression to the PMF determined by the MD simulations.
As shown in Figure 15, each of the PMF curves for nonpolar side chains-phosphate group interaction has one broad minimum. The minimum occurs at longer distances for the edge-to-phosphate orientations (, red plus symbols; , blue asterisk symbols), and shorter distances for the side-to-phosphate orientation (, green cross symbols). The PMF curves for orientation a (, red plus symbols) and orientation c (, blue asterisk symbols) almost overlap, because, for all nonpolar side chains, orientations a and c are identical in space. For the glycine CαΗ2-phosphate group interaction (Figure 15 (c)), the PMFs for all three orientations overlap, this is because the side chain of glycine is isotropic in geometry. It can be seen from Figure 15 that, for all nonpolar side chain-phosphate group pairs, the analytical potential functions (Eq. S29) fit satisfactorily to the PMF determined from the AMBER simulations and reproduce the order of the minima of the PMF curves corresponding to different orientations. The fitted parameters of the expressions for 11 nonpolar side chains and phosphate group interactions are collected in Table S23 in the Supporting Information. It can be seen from Table S23 that alanine and glycine side chains are more polarized in the interactions with a phosphate group. This results from the small sizes of alanine and glycine side chains.
4.7 Polar uncharged side chain-phosphate group interaction potentials
The PMF curves of 5 polar uncharged side chains (Ser, Thr, Asn, Gln, and His) and a phosphate group, with fitted curves calculated from analytical potential functions using Eq. S34, for three selected orientations in Figure 16, are plotted as functions of distance between the centers of the interacting molecules in Figure 17. The three orientations are (a) (head-to-phosphate), (b) (side-to-phosphate), and (c) (tail-to-phosphate), respectively, as shown in Figure 16. The property of the histidine side chain is strongly influenced by the environment. For the side chain-base interaction, histidine was treated as a nonpolar side chain. However, in the presence of a point charge in the phosphate group, histidine behaves as a polar uncharged side chain with a dipole on the histidine side chain induced by the point charge.
Figure 16.
Illustration of three orientations of polar uncharged side chain-phosphate group interactions for (a) (head-to-phosphate), (b) (side-to-phosphate), and (c) (tail-to-phosphate), respectively. The solid line represents the long axis of the polar uncharged side chain. The circle at one end of the solid line represents the dipole on the polar uncharged side chain (PSC). The black circle represents phosphate group (P).
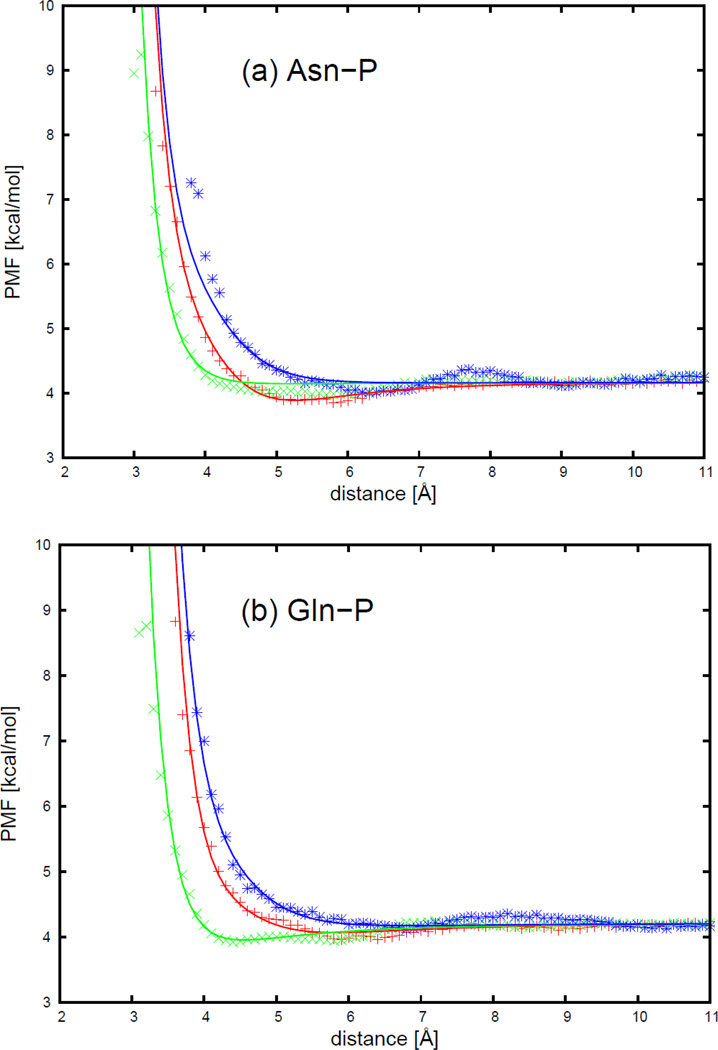
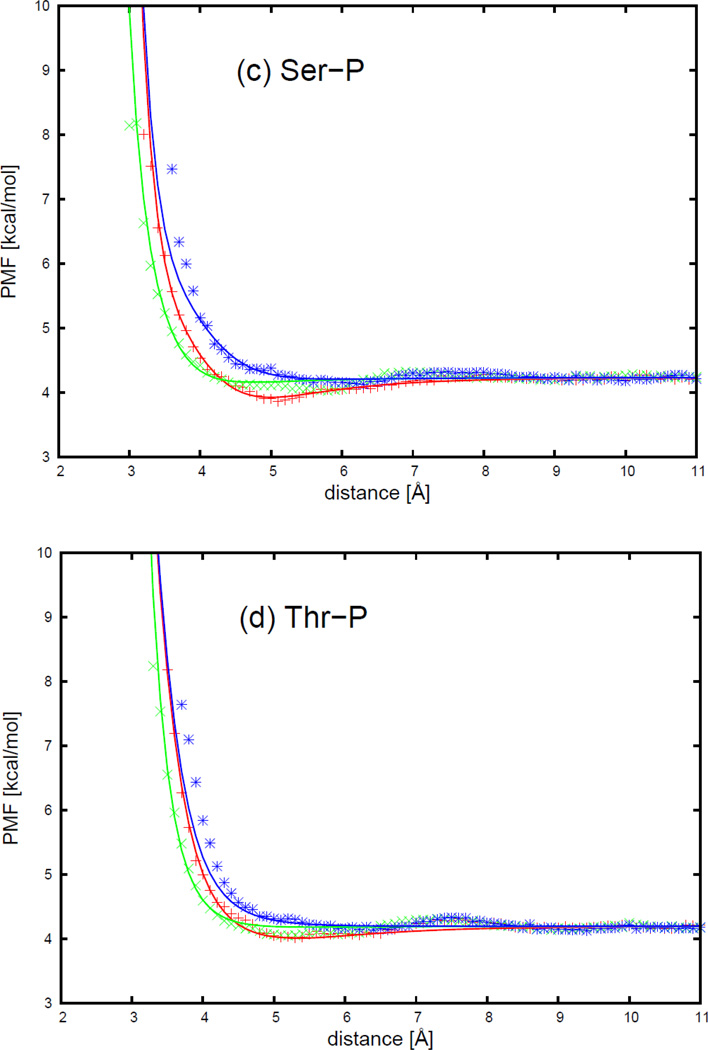
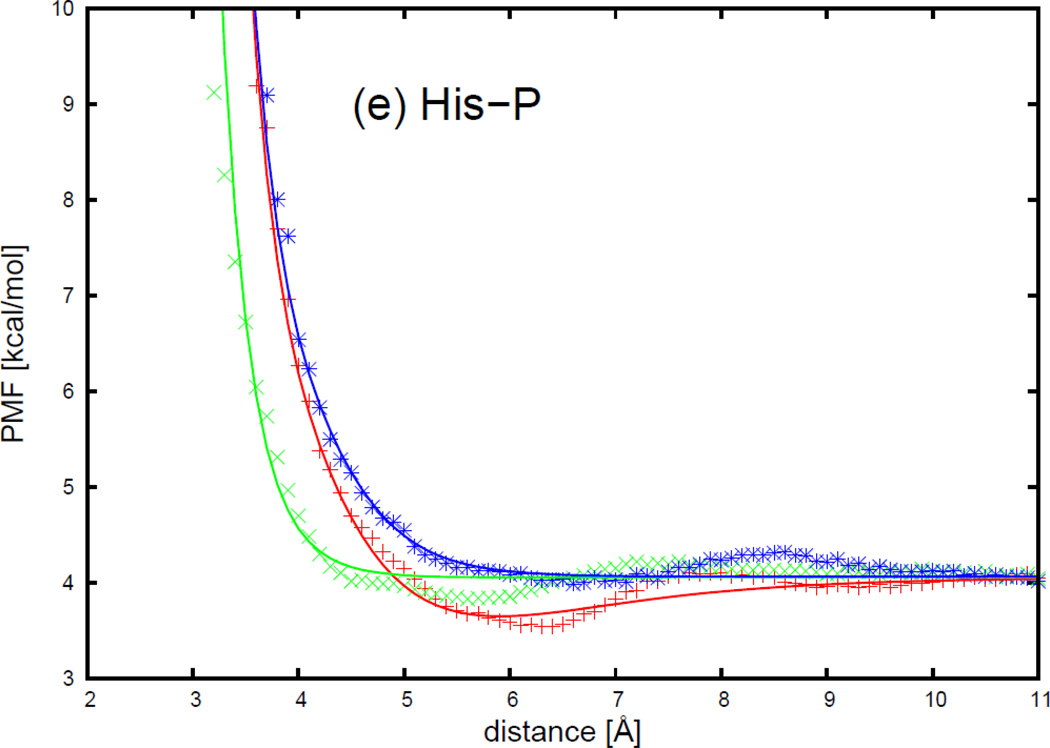
Figure 17.
The PMF curves for 5 polar uncharged side chains-phosphate group interactions: (a) asparagine side chain-phosphate group, (b) glutamine side chain-phosphate group, (c) serine side chain-phosphate group, (d) threonine side chain-phosphate group, and (e) histidine side chain-phosphate group. The red plus, green cross, and blue asterisk symbols correspond to PMFs determined from the MD simulations for orientations (a) (head-to-phosphate), (b) (side-to-phosphate), and (c) (tail-to-phosphate), respectively. The red, green, and blue solid lines correspond to the analytical approximation (Eq. 39) to the PMFs for orientation a, b, and c of Figure 23, with parameters determined by least-squares fitting of the analytical expression to the PMF determined by the MD simulations.
As shown in Figure 17, each of the PMF curves for polar uncharged side chains-phosphate group interactions has one broad minimum. All 5 polar uncharged side chains have very similar contact patterns with a phosphate group. The minimum occurs at shorter distances for the side-to-phosphate orientation (, green cross symbols), and at longer distance for the tail-to-phosphate orientation (, blue asterisk symbols) for all polar uncharged side chains and a phosphate group. The minimum is the shallowest for the tail-to-phosphate orientation, and the deepest for the head-to-phosphate orientation (, red plus symbols), for all polar uncharged side chain-phosphate group interactions. It can be seen from Figure 17 that, for all polar uncharged side chain-phosphate group pairs, the analytical potential functions (Eq. S34) fit satisfactorily to the PMF determined from the AMBER simulations and reproduce the order of the minima of the PMF curves corresponding to different orientations. The fitted parameters of the expressions for 5 polar uncharged side chains and phosphate group interactions are collected in Table S24 in the Supporting Information. It can be seen from Table S24 that it is difficult to polarize all polar amino-acid side chains, as they already have a dipole on the side chains.
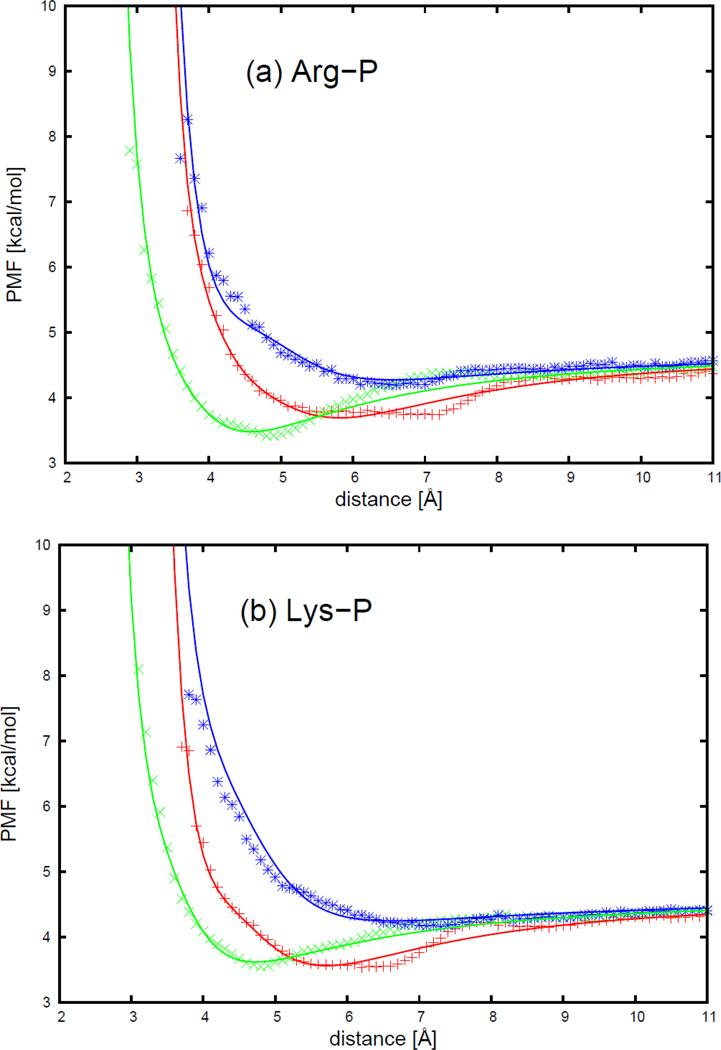
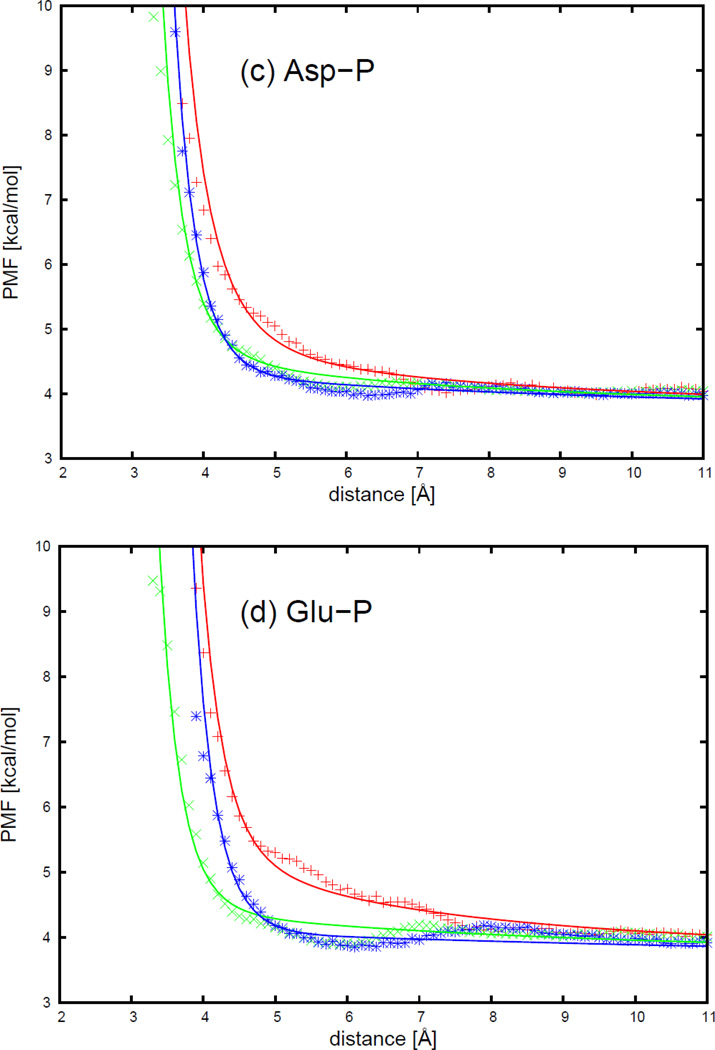
4.8 Charged side chain-phosphate group interaction potentials
The PMF curves of 4 charged side chains and phosphate group interactions, with the respective fitted curves calculated from analytical potential functions using Eq. S36, for three selected orientations shown in Figure 18, are plotted as functions of distance between the centers of the interacting molecules in Figure 19. The three orientations are (a) (head-to-phosphate), (b) (side-to-phosphate), and (c) (tail-to-phosphate), respectively, as shown in Figure 18.
Figure 18.
Illustration of three orientations of charged side chain-phosphate group interactions for (a) (head-to-phosphate), (b) (side-to-phosphate), and (c) (tail-to-phosphate), respectively. The solid line represents the long axis of the charged side chain. The black circle at one end of the solid line represents the charged head group on the charged side chain (CSC). The black circle on the right side in each panel represents a phosphate group (P).
Figure 19.
The PMF curves for 4 charged side chains-phosphate group interactions: (a) arginine side chain-phosphate group, (b) lysine side chain-phosphate group, (c) aspartic acid side chain-phosphate group, and (d) glutamic acid side chain-phosphate group. The red plus, green cross, and blue asterisk symbols correspond to PMFs determined from the MD simulations for orientations (a) (head-to-phosphate), (b) (side-to-phosphate), and (c) (tail-to-phosphate), respectively. The red, green, and blue solid lines correspond to the analytical approximation (Eq. 41) to the PMFs for orientation a, b, and c of Figure 25, with parameters determined by least-squares fitting of the analytical expression to the PMF determined by the MD simulations.
As shown in Figure 19, the PMF curves for charged side chains and phosphate group interactions have one broad minimum. The arginine-phosphate group interaction has a similar contact pattern as the lysine-phosphate group interaction, and the aspartic acid-phosphate group interaction has a similar contact pattern as the glutamic acid-phosphate group interaction. For positively charged side chains, the minimum occurs at shorter distances for the side-to-phosphate orientation (, green cross symbols), and longer distance for the tail-to-phosphate orientation (, blue asterisk symbols). The minimum is the shallowest for the tail-to-phosphate orientation. It is the deepest for the side-to-phosphate orientation for the arginine-phosphate group, while it is the deepest for both side-to-phosphate and head-to-phosphate (, red plus symbols) orientations for the lysine-phosphate group interaction. For negatively charged side chains, the minimum occurs at the shortest distances for the side-to-phosphate orientation, and at the longest distance for the head-to-phosphate orientation. The minimum is the deepest for the tail-to-phosphate orientation, and the shallowest for the head-to-phosphate orientation. It can be seen from Figure 19 that, for all charged side chain-phosphate group pairs, the analytical potential functions (Eq. S36) fit satisfactorily to the PMF determined from the AMBER simulations and reproduce the order of the minima of the PMF curves corresponding to different orientations. The fitted parameters for 4 charged side chains and a phosphate group are collected in Table S25 in the Supporting Information. It can be seen from Table S25 that the positively charged side chains arginine and lysine bear similar parameters, as do the negatively charged side chains aspartic acid and glutamic acid, but the values of the latter pair differ from those of the former pair.
4.9 Discussion of the current fitting functions
From the fitting results presented above, it can been seen that the analytical potential functions fit satisfactorily to the PMFs determined from AMBER simulations for all pairs of interacting sites. The standard deviation and the weighted standard deviations (with weights expressed by Eq. 8) of the fitting for all 105 pairs of interacting components are given in Table S26 in the Supporting Information. The 2D surfaces of UNRES potentials and the MD PMFs for asparagine side chain and 4 DNA base pairs are shown in the Figure S12 in the Supporting Information. However, the minima of the fitting curves are shifted to the left side, resulting in shorter distance corresponding to potential minima. This is due to the use of the current functional forms of Gay-Berne and Lennard-Jones potentials, which have already been implemented in UNRES and NARES-2P. The 6–12 Gay-Berne and Lennard-Jones potentials corresponding to van der Waals interaction (Eqs. S2 and S25), which work well for atoms, seem to overestimate the repulsion component for the united interaction sites (which are composed of groups of atoms) used in UNRES and NARES-2P. The refitting with different functional forms requires the reconstruction of both UNRES and NARES-2P. Therefore, for compatibility and efficiency, the current function forms are used in this work, but future work will be focused on finding the optimal potential forms for van der Waals interaction in both UNRES and NARES-2P.
5. Conclusions
Physics-based coarse-grained potentials were developed in this work to treat protein-DNA interactions by fitting analytical expressions to the PMFs determined from simulations of pairs of molecules modeling the protein and DNA interaction sites, respectively, in water as functions of distance and orientations of the interacting molecules. A total of 105 pairs were considered; 1 pair consisting of the peptide group and the phosphate group, 4 pairs of DNA bases and the peptide group, 20 pairs of amino-acid side chains and the phosphate group, and 80 pairs of amino-acid side chains and DNA bases. The analytical potential functions for each pair of interacting components were parameterized by fitting the analytical potential expressions to the PMF for each pair of interacting molecules. It is demonstrated that the analytical potential expressions fit the PMFs of corresponding interacting molecules satisfactorily. The results suggest that the analytical potential expression presented in this work is a good candidate for the physics-based mean-field potentials in our UNRES and NARES-2P force field for the simulation of protein-DNA interaction. In order to use the analytical potential developed in this work, the structure of the protein-DNA complex, as well as the thermodynamics of the binding between protein and DNA, needs to be optimized with a whole protein-DNA complex in the future work.
Supplementary Material
Acknowledgements
This work was supported by grants from the U.S. National Institutes of Health (GM-14312; to HAS) and the U.S. National Science Foundation (MCB-1019767; to HAS), the Foundation for Polish Science (FNP-START 100.2014; to AKS) and Mistrz 7/.2013 (to AL), and the Polish National Science Center (DEC-2012/06/A/ST4/00376; to AL). Calculations were conducted by using the resources of (a) our 588-processor Beowulf cluster at the Baker Laboratory of Chemistry and Chemical Biology, Cornell University, (b) the supercomputer resources at the Informatics Center of the Academic Computer Center in Gdansk (CI TASK) Gdansk, Poland, (c) the Interdisciplinary Center of Mathematical and Computer Modeling (ICM), University of Warsaw (d) our 488-processor Beowulf cluster at the Faculty of Chemistry, University of Gdansk. This research was also supported by an allocation of advanced computing resources provided by the National Science Foundation (http://www.nics.tennessee.edu/), and by the National Science Foundation through TeraGrid resources provided by the Pittsburgh Supercomputing Center.
Footnotes
Supporting Information
The energy components for protein-DNA interactions in Eq. 5 is discussed in the section 1 of the supporting information (SI) with models of interacting components illustrated in Figure S1–S8. The mean-field Electrostatic energy of dipole-charge interaction is derived in the section 2 of the SI with the illustration of the dipole-charge interaction in Figure S9. Figure S10 presents the PMF curves from the first half of the trajectories, and from the second half of the trajectories, for arginine side chain and adenine base pair. Figure S11 shows the PMF curves for all the remaining pairs of interacting components other than those presented in the manuscripts. Figure S12 presents the 2D surfaces of the PMF and the UNRES potential for asparagine and four DNA base pair. Table S1–S25 presents the fitting parameters for all pairs of interacting components in protein-DNA interactions. Table S26 shows the RMSD and weighted RMSD of the fitting for all 105 pairs of interacting components. This information is available free of charge via the Internet at http://pubs.acs.org.
References
- 1.Berg J, Tymoczko JL, Stryer L. Biochemistry. 6th edition. San Francisco: W. H. Freeman; 2006. [Google Scholar]
- 2.Alberts B, Johnson A, Lewis J, Raff M, Roberts K, Walter P. Molecular Biology of the Cell. 4th edition. New York: Garland Science; 2002. [Google Scholar]
- 3.Youngson RM. Collins Dictionary of Human Biology. London: Collins; 2006. [Google Scholar]
- 4.Riggs AD, Bourgeois S, Cohn M. The lac represser-operator interaction: III. Kinetic studies. J. Mol. Biol. 1970;53:401–417. doi: 10.1016/0022-2836(70)90074-4. [DOI] [PubMed] [Google Scholar]
- 5.von Hippel PH, Berg OG. Facilitated target location in biological systems. J. Biol. Chem. 1989;264:675–678. [PubMed] [Google Scholar]
- 6.Kalodimos CG, Biris N, Bonvin AMJJ, Levandoski MM, Guennuegues M, Boelens R, Kaptein R. Structure and flexibility adaptation in nonspecific and specific protein-DNA complex. Science. 2004;305:386–389. doi: 10.1126/science.1097064. [DOI] [PubMed] [Google Scholar]
- 7.Latchman DS. Tanscription-factor mutations and disease. N. Engl. J. Med. 1996;334:28–33. doi: 10.1056/NEJM199601043340108. [DOI] [PubMed] [Google Scholar]
- 8.Goffin D, Allen M, Zhang L, Amorim M, Wang IJ, Reyes AS, Mercado-Berton A, Ong C, Cohen S, Hu L, Blendy JA, Carlson GC, Siegel SJ, Greenberg ME, Zhou Z. Rett syndrome mutation MeCP2 T158 A disrupts DNA binding, protein stability and ERP responses. Nat. Neurosci. 2012;15:274–283. doi: 10.1038/nn.2997. [DOI] [PMC free article] [PubMed] [Google Scholar]
- 9.Gao C, Pan M, Lei Y, Tian L, Jiang H, Li X, Shi Q, Tian C, Yuan Y, Fan G, Dong X. A point mutation in the DNA-binding domain of HPV-2 E2 protein increases its DNA-binding capacity and reverses its transcriptional regulatory activity on the viral early promoter. BMC Mol. Biol. 2012;15:13–15. doi: 10.1186/1471-2199-13-5. [DOI] [PMC free article] [PubMed] [Google Scholar]
- 10.Ponglikitmongkol M, Green S, Chambon P. Genomic organization of the human oestrogen receptor gene. EMBO J. 1988;7:3385–3388. doi: 10.1002/j.1460-2075.1988.tb03211.x. [DOI] [PMC free article] [PubMed] [Google Scholar]
- 11.Sudbeck P, Schmitz ML, Baeuerle PA, Scherer G. Sex reversal by loss of the C-terminal transactivation domain of human SOX9. Nature Genet. 1996;13:230–232. doi: 10.1038/ng0696-230. [DOI] [PubMed] [Google Scholar]
- 12.Maestro MA, Cardalda C, Boj SF, Luco RF, Servitja JM, Ferrer J. Distinct roles of HNF1beta, HNF1alpha, and HNF4alpha in regulating pancreas development, beta-cell function and growth. Endocr. Dev. 2007;12:33–45. doi: 10.1159/000109603. [DOI] [PubMed] [Google Scholar]
- 13.Sen P, Yang Y, Navarro C, Silva I, Szafranski P, Kolodziejska KE, Dharmadhikari AV, Mostafa H, Kozakewich H, Kearney D, Cahill JB, Whitt M. Novel FOXF1 mutations in sporadic and familial cases of alveolar capillary dysplasia with misaligned pulmonary veins imply a role for its DNA binding domain. Hum. Mutat. 2013;34:801–811. doi: 10.1002/humu.22313. 70 others. [DOI] [PMC free article] [PubMed] [Google Scholar]
- 14.Shaw DE, Maragakis P, Lindorff-Larsen K, Piana S, Dror RO, Eastwood MP, Bank JA, Jumper JM, Salmon JK, Shan Y, Wriggers W. Atomic-level characterization of the structural dynamics of proteins. Science. 2010;330:341–346. doi: 10.1126/science.1187409. [DOI] [PubMed] [Google Scholar]
- 15.Basdevant N, Borgis D, Ha-Duong T. A coarse- grained protein-protein potential derived from an all- atom force field. J. Phys. Chem. B. 2007;111:9390–9399. doi: 10.1021/jp0727190. [DOI] [PubMed] [Google Scholar]
- 16.Maupetit J, Tuffery P, Derreumaux P. A coarse- grained protein force field for folding and structure prediction. Proteins. 2007;69:394–408. doi: 10.1002/prot.21505. [DOI] [PubMed] [Google Scholar]
- 17.Monticelli L, Kandasamy KS, Periole X, Larson RG, Tieleman DP, Marrink SJ. The MARTINI coarse grained force field: extension to proteins. J. Chem. Theory Comput. 2008;4:819–834. doi: 10.1021/ct700324x. [DOI] [PubMed] [Google Scholar]
- 18.Bereau T, Deserno M. Generic coarse-grained model for protein folding and aggregation. J. Chem. Phys. 2009;130:235106. doi: 10.1063/1.3152842. [DOI] [PMC free article] [PubMed] [Google Scholar]
- 19.Knotts TA, Rathore N, Schwartz DC, de Pablo JJA. coarse grain model for DNA. J. Chem. Phys. 2007;126:084901. doi: 10.1063/1.2431804. [DOI] [PubMed] [Google Scholar]
- 20.Ouldridge TE, Louis AA, Doye JPK. DNA nanotweezers studied with a coarse-grained model of DNA. Phys. Rev. Lett. 2010;104:178101. doi: 10.1103/PhysRevLett.104.178101. [DOI] [PubMed] [Google Scholar]
- 21.Maciejczyk M, Spasic A, Liwo A, Scheraga HA. DNA Duplex Formation with a Coarse-Grained Model. J. Chem. Theory Comput. 2014;10:5020–5035. doi: 10.1021/ct4006689. [DOI] [PMC free article] [PubMed] [Google Scholar]
- 22.Ueeda Y, Taketomi H, Gō N. Studies on protein folding, unfolding and fluctuations by computer simulation: A three-dimensional lattice model of lysozyme. Biopolymers. 1978;17:1531–1548. [Google Scholar]
- 23.Periole X, Marrink SJ. The martini coarse-grained force field. Methods Mol. Biol. 2013;924:533–565. doi: 10.1007/978-1-62703-017-5_20. [DOI] [PubMed] [Google Scholar]
- 24.Liu Z, Mao F, Guo J, Yan B, Wang P, Qu Y, Xu Y. Quantitative evaluation of protein-DNA interactions using an optimized knowledge-based potential. Nucleic Acids Res. 2005;33:546–558. doi: 10.1093/nar/gki204. [DOI] [PMC free article] [PubMed] [Google Scholar]
- 25.Liu H, Shi Y, Chen XS, Warshel A. Simulating the electrostatic guidance of the vectorial translocations in hexameric helicases and translocases. Proc. Natl. Acad. Sci. U.S.A. 2009;106:7449–7454. doi: 10.1073/pnas.0900532106. [DOI] [PMC free article] [PubMed] [Google Scholar]
- 26.Marcovitz A, Levy Y. Frustration in protein-DNA binding influences conformational switching and target search kinetics. Proc. Natl. Acad. Sci. U.S.A. 2011;108:17957–17962. doi: 10.1073/pnas.1109594108. [DOI] [PMC free article] [PubMed] [Google Scholar]
- 27.Liwo A, Oldziej S, Pincus MR, Wawak RJ, Rackovsky S, Scheraga HA. A united-residue force field for off-lattice protein-structure simulations. I. Functional forms and parameters of long-range side-chain interaction potentials from protein crystal data. J. Comput. Chem. 1997;18:849–873. [Google Scholar]
- 28.Liwo A, Czaplewski C, Pillardy J, Scheraga HA. Cumulant-based expressions for the multibody terms for the correlation between local and electrostatic interactions in the united-residue force field. J. Chem. Phys. 2001;115:2323–2347. [Google Scholar]
- 29.Liwo A, Khalili M, Czaplewski C, Kalinowski S, Oldziej S, Wachucik K, Scheraga HA. Modification and optimization of the united-residue (UNRES) potential energy function for canonical simulations. I. Temperature dependence of the effective energy function and tests of the optimization method with single training proteins. J. Phys. Chem. B. 2007;111:260–285. doi: 10.1021/jp065380a. [DOI] [PMC free article] [PubMed] [Google Scholar]
- 30.Liwo A, Czaplewski C, Oldziej S, Rojas AV, Kazmierkiewicz R, Makowski M, Murarka RK, Scheraga HA. Simulation of protein structure and dynamics with the coarse-grained UNRES force field. In: Voth GA, editor. Coarse-Graining of Condensed Phase and Biomolecular Systems. first edition. Florida: Taylor & Francis Group; 2008. pp. 107–122. [Google Scholar]
- 31.He Y, Xiao Y, Liwo A, Scheraga HA. Exploring the Parameter Space of the Coarse-Grained UNRES Force Field by Random Search: Selecting a Transferable Medium-Resolution Force Field. J. Comput. Chem. 2009;30:2127–2135. doi: 10.1002/jcc.21215. [DOI] [PMC free article] [PubMed] [Google Scholar]
- 32.Makowski M, Liwo A, Sobolewski E, Scheraga HA. Simple Physics-Based Analytical Formulas for the Potentials of Mean Force of the Interaction of Amino-Acid Side Chains in Water. V. Like-Charged Side Chains. J. Phys. Chem. B. 2011;115:6119–6129. doi: 10.1021/jp111258p. [DOI] [PMC free article] [PubMed] [Google Scholar]
- 33.Makowski M, Liwo A, Scheraga HA. Simple Physics-Based Analytical Formulas for the Potentials of Mean Force of the Interaction of Amino-Acid Side Chains in Water. VI. Oppositely Charged Side Chains. J. Phys. Chem. B. 2011;115:6130–6137. doi: 10.1021/jp111259e. [DOI] [PMC free article] [PubMed] [Google Scholar]
- 34.Liwo A, He Y, Scheraga HA. Coarse-grained force field: general folding theory. Phys. Chem. Chem. Phys. 2011;13:16890–16901. doi: 10.1039/c1cp20752k. [DOI] [PMC free article] [PubMed] [Google Scholar]
- 35.Sieradzan AK, Krupa P, Scheraga HA, Liwo A, Czaplewski C. Physics-based potentials for the coupling between backbone- and side-chain-local conformational states in the united residue (UNRES) force field for protein simulations. J. Chem. Theory Comput. 2015;11:817–831. doi: 10.1021/ct500736a. [DOI] [PMC free article] [PubMed] [Google Scholar]
- 36.He Y, Maciejczyk M, Ołdziej S, Scheraga HA, Liwo A. Mean-Field Interactions between Nucleic-Acid-Base Dipoles can Drive the Formation of a Double Helix. Phys. Rev. Lett. 2013;110:098101. doi: 10.1103/PhysRevLett.110.098101. [DOI] [PMC free article] [PubMed] [Google Scholar]
- 37.Liwo A, Lee J, Ripoll DR, Pillardy J, Scheraga HA. Protein structure prediction by global optimization of a potential energy function. Proc. Natl. Acad. Sci. U.S.A. 1999;96:5482–5485. doi: 10.1073/pnas.96.10.5482. [DOI] [PMC free article] [PubMed] [Google Scholar]
- 38.Ołdziej S, Czaplewski C, Liwo A, Chinchio M, Nanias M, Vila JA, Khalili M, Arnautova YA, Jagielska A, Makowski M, Schafroth HD, Kaźmierkiewicz R, Ripoll DR, Pillardy J, Saunders JA, Kang YK, Gibson KD, Scheraga HA. Physics-based protein-structure prediction using a hierarchical protocol based on the UNRES force field: Assessment in two blind tests. Proc. Natl. Acad. Sci. U.S.A. 2005;102:7547–7552. doi: 10.1073/pnas.0502655102. [DOI] [PMC free article] [PubMed] [Google Scholar]
- 39.He Y, Mozolewska MA, Krupa P, Sieradzan AK, Wirecki TK, Liwo A, Kachlishvili K, Rackovsky S, Jagieła D, Ślusarz R, Czaplewski CR, Ołdziej S, Scheraga HA. Lessons from application of the UNRES force field to predictions of structures of CASP10 targets. Proc. Natl. Acad. Sci. U.S.A. 2013;110:14936–14941. doi: 10.1073/pnas.1313316110. [DOI] [PMC free article] [PubMed] [Google Scholar]
- 40.Gay JG, Berne BJ. Modification of the overlap potential to mimic a linear site– site potential. J. Chem. Phys. 1981;74:3316–3319. [Google Scholar]
- 41.Liwo A, Khalili M, Scheraga HA. Ab initio simulations of protein-folding pathways by molecular dynamics with the united-residue model of polypeptide chains. Proc. Natl. Acad. Sci. U.S.A. 2005;102:2362–2367. doi: 10.1073/pnas.0408885102. [DOI] [PMC free article] [PubMed] [Google Scholar]
- 42.Case DA, Pearlman DA, Caldwell JW, Ross WS, Cheatham TE, III, DeBolt S, Ferguson D, Seibel G, Kollman PA. AMBER, a package of computer programs for applying molecular mechanics, normal mode analysis, molecular dynamics and free energy calculations to simulate the structural and energetic properties of molecules. Comput. Phys. Commun. 1995;91:1–41. [Google Scholar]
- 43.Jorgensen WL, Chandrasekhar J, Madura JD, Impey RW, Klein ML. Comparison of simple potential functions for simulating liquid water. J. Chem. Phys. 1983;79:926–935. [Google Scholar]
- 44.Wang J, Wolf RM, Caldwell JW, Kollamn PA, Case DA. Development and testing of a general amber force field. J. Comput. Chem. 2004;25:1157–1174. doi: 10.1002/jcc.20035. [DOI] [PubMed] [Google Scholar]
- 45.Allen MP, Tildesley DJ. Computer simulation of liquids. New York: Oxford University Press; 1987. [Google Scholar]
- 46.Darden T, York D, Pederson L. Particle mesh Ewald: An N• log(N) method for Ewald sums in large systems. J. Chem. Phys. 1993;98:10089–10092. [Google Scholar]
- 47.Kumar S, Bouzida D, Swendsen RH, Kollman PA, Rosenberg JM. The weighted histogram analysis method for free-energy calculations on biomolecules. I. The method. J. Comput. Chem. 1992;13:1011–1021. [Google Scholar]
- 48.Kumar S, Rosenberg JM, Bouzida D, Swendsen RH, Kollman PA. Multidimensional free-energy calculations using the weighted histogram analysis method. J. Comput. Chem. 1995;16:1339–1350. [Google Scholar]
- 49.Marquardt DW. An algorithm for least-squares estimation of nonlinear parameters. J. Soc. Ind. Appl. Math. 1963;11:431–441. [Google Scholar]
Associated Data
This section collects any data citations, data availability statements, or supplementary materials included in this article.


