Abstract
Photodynamic therapy (PDT) is the term used to describe the irradiation of photosensitized cells or tissue with phototoxic consequences. This process can result in the rapid initiation of not only apoptosis, an irreversible death pathway, but also autophagy. The procedures described here are designed to characterize the correlation between the PDT dose vs. survival of cells in vitro, the apoptotic effects of photodamage, and the extent of an autophagic response. These are assessed by clonogenic assays, observation of condensed chromatin characteristic of apoptosis, activation of “executioner” caspases, and the autophagic flux as indicated by comparing accumulation of the LC3-II protein under conditions where processing of autophagosomes is retarded vs. is not retarded.
Keywords: Apoptosis, autophagy, Bcl-2, Bid, Bax, photosensitization, photodynamic therapy
1. Introduction
Photodynamic therapy (PDT) is a procedure for cancer control based on the selective localization of photosensitizing agents (often porphyrins or its analogs) in malignant cells and tissues (1). When photosensitized cells are irradiated with light at a wavelength corresponding to the absorbance band of the photosensitizing agent, this leads to two distinct phenomena: fluorescence and an energy transfer process. The latter can convert dissolved oxygen (3O2) in cells or tissues into a highly reactive intermediate termed “singlet oxygen” (1O2). Once formed, 1O2 immediately reacts with biological systems, usually nearby lipids and proteins. If sufficient drug and light are provided, this results in a selective means for oxidative stress and tumor eradication. Additional reactive oxygen species may also be formed, but the immediate precursor is believed to be 1O2 in most cases.
This report will deal with procedures for identifying the immediate consequences of PDT in cell culture: apoptosis and autophagy. The former results from photodamage to Bcl-2/Bcl-xL and/or lysosomes (2–8), while the latter can be both a repair process and a death mode (9–13). Subsequent biochemical processes in dying cells can evoke a variety of stress responses, upregulation of heat-shock proteins, and similar phenomena. These will be discussed elsewhere in this volume.
Several photosensitizing agents have been approved for clinical use, and many others are in clinical and pre-clinical trials. These agents are not always commercially available. Common porphyrins and phthalocyanines can be obtained from the major suppliers, e.g., Sigma-Aldrich. A large selection of porphyrins, phthalocyanines, and related compounds is available from Frontier Science, PO Box 31, Logan, Utah 84323-0031 (www.info@frontiersci.com). Frontier Science can carry out a custom preparation of any agent whose structure and synthetic route has been published. In this report, we will discuss the procedures utilized for a product that can be purchased from VWR, the benzoporphyrin derivative (BPD, Verteporfin). This photosensitizer is approved by the United States Food and Drug Administration for the treatment of age-related macular degeneration.
The report is also written for study of L1210 mouse leukemia cells, which grow in suspension. It should be noted that many workers use cell lines that are derived from human carcinomas representative of the type of cancers treated with PDT. Such lines grow attached to a tissue culture flask or dish, and some procedures described below differ when applied to these cultures.
2. Materials
2.1. Cell Culture and Photosensitization
The “alpha” modification of minimum essential Eagle’s medium (Sigma-Aldrich, St Louis, MO) supplemented with 10% horse serum (Atlanta Biologicals, Norcross, GA) + 2.2 g/l of NaHCO3 and 10 mg/l gentamicin (Invitrogen) as an antibiotic, although others can be employed (see Note 1).
Fisher’s medium with 10% horse serum (FHS): NaHCO3 is omitted from the medium and is replaced with 20 mM HEPES buffer, pH 7.0. This permits short-term maintenance of high-density cell cultures at a neutral pH.
Benzoporphyrin derivative (BPD; VWR, Westchester, PA) dissolved in DMSO at a concentration of 7.12 mg/ml (10 mM and further diluted to 1 mM with DMSO (see Note 2)).
2.2. Irradiation System
A 700-W Oriel quartz-halogen light source or an equivalent capable of producing 1–10 mW/cm2 of light at wavelengths between 600 and 750 nm, with a bandwidth of 10 nm. Diode lasers can also accomplish this purpose (Intense, Inc., North Brunswick, NJ) (see Note 3).
Interference filters: For BPD, a filter with a center wavelength of 690 nm and a bandwidth of 10 nm can be obtained from Oriel (Newport Corporation, Stratford, CT). It is also possible to use a filter system with a broader bandwidth, but the pertinent light dose needs to be calculated at wavelengths for which there is an absorbance band.
Water filter (10 cm of water in the light path): This reduces the contribution of infrared radiation and can also be obtained from Newport/Oriel.
Power density monitor (ScienTech H 10 or equivalent; Scientech, Inc., Boulder, CO (see Note 4)).
2.3. DEVDase Assays
Phosphate-buffered saline (PBS): 130 mM NaCl, 20 mM sodium phosphate, pH 7.
Insect lysis buffer (BD Biosciences, San Jose CA).
EnzChek caspase 3 assay kit #2 from Invitrogen. This relies on a fluorogenic interaction between caspase activity and DEVD-rhodamine 110, releasing the free rhodamine dye.
Protein assay system: Biuret reagent (Sigma-Aldrich); Folin–Ciocalteau phenol reagent (Sigma-Aldrich).
2.4. Fluorescence Microscopy
Hoechst dye HO3342 (Sigma-Aldrich).
Fluorescence microscope with an appropriate filter cube for HO342 fluorescence (excitation 350–380 nm, emission >400 nm (see Note 5)).
CoolSnap CCD camera (Photometrics, Tucson, AZ) and MetaMorph software (Molecular Devices) or equivalent image-capturing system and processing software.
2.5. Western Blots for Autophagy
Insect lysis buffer (BD Biosciences, San Jose, CA).
SDS buffer: 2X Tris-glycine SDS sample buffer (Invitrogen, Carlsbad, CA).
4–20% Tris-glycine gels (Invitrogen).
5% blocking buffer (Amersham division/GE, Buckinghamshire, UK).
PVDF membrane (Invitrogen).
TBS-T (20 mM Tris–HCl, pH 7.6, 137 mM NaCl, 0.1% Tween 20) and add an antibody to the autophagy-associated protein LC3 (Proteintech Group, Inc., Chicago, IL) (see Note 6).
Secondary antibody: Anti-Rabbit IgG, alkaline phosphatase-linked whole antibody (Amersham).
ECF substrate Amersham/GE Western blotting reagent pack.
Novex mini-cell electrophoresis chamber.
2.6. Clonogenic Assays for L1210 Cells
Agar (Sigma-Aldrich).
Thiazolium salt (Sigma-Aldrich).
96-well plates NUNC, Roskilde, Denmark.
2.7. Clonogenic Assays for Adherent Cells
0.25% trypsin (1X) solution with EDTA (Hyclone Laboratories, Inc., Logan, UT).
60-mm tissue culture Petri dishes (Becton Dickinson Labware, Franklin Lakes, NJ).
0.1% crystal violet (Fisher Scientific) in 20% ethanol.
3. Methods
3.1. Photosensitization of Cells
Exponentially growing L1210 cells are collected by centrifugation (500×g, 10 min), then resuspended in FHS at a density of 7 mg/ml (wet weight). This corresponds to a cell count of 2.5 × 10⁶/ml.
Portions of 1 ml each are placed in glass tubes and treated with a 1 mM solution of BPD in DMSO (final concentration = 2 μM).
Incubate cells for 30 min at 37°C, then collect by centrifugation (100×g, 30 s) using a mini-centrifuge.
Resuspend the cell pellets in cold FHS and irradiate in a chamber that maintains the temperature at 10°C (see Note 7).
At this point, the cells can be used for evaluation of immediate photodamage or incubated for 30–60 min to follow the time course of apoptosis and autophagy.
3.2. DEVDase Assay
Using control cells and cells treated with varying PDT doses, wash 7 mg cell pellets in phosphate-buffered saline (PBS, 130 mM NaCl + 20 mM sodium phosphate, pH 7), then disperse in 110 μl of insect lysis buffer at 4°C.
Vortex this mixture at 10 min intervals for 1 h.
Spin down the debris (2,500 rpm, 4°C, 1 min), then take two 50 μl samples of the supernatant fluid for duplicate determinations of caspase 3/7 activity.
Prepare a working solution composed of 590 μl of water, 400 μl of reaction buffer, 10 μl of 1 M DTT, and 10 μl of 5 mM z-DEVD-R110 substrate. These components are contained in the assay kit.
Pipette the 50 μl aliquots (in duplicate) of samples into wells of a 96-well plate designed for fluorescence measurements (see Note 8).
Add 50 μl of working solution to each well and start the program.
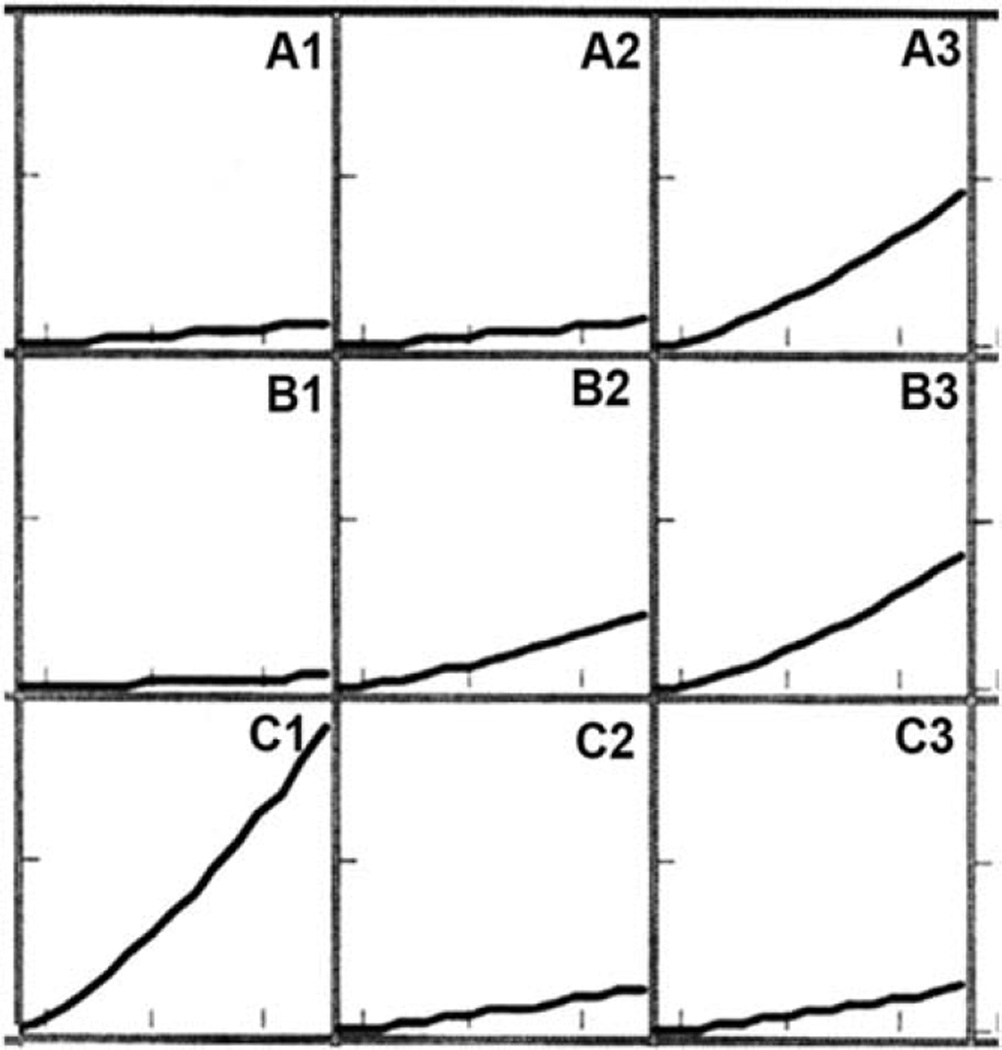
Monitor appearance of fluorescence with a fluorescence plate reader (see Note 5). A typical result is shown in Fig. 3.1. Wells A1 and A2 are controls. Other samples received different PDT doses or reflect the presence of caspase inhibitors. The highest PDT dose was given to the sample shown in well C1.
Using a sample of R110 provided in the kit, determine the fluorescence intensity of a series of different concentrations. From this and the acquired data, the rate of the enzyme reaction can be calculated in terms of nanomole substrate hydrolyzed per minute.
Determine the protein concentration in an aliquot of the cell extracts so that caspase activity can be calculated (nmol/mg protein/min).
Fig. 3.1.
Fluorogenic effects of PDT in the caspase 3/7 assay system. Numbers in each cell reflect the position of the sample in the 96-well plate. A1, A2, and C1 are controls; other samples received different PDT doses.
3.3. Fluorescence Microscopy
After irradiation, incubate cells (7 mg/ml in FHS) for 60 min at 37°C, adding 2 μM Höchst dye 33342 (HO342) during the final 5 min.
Collect cells by centrifugation at 100×g for 30 s, then resuspend in 5 μl of growth medium.
Examine patterns of HO342 fluorescence using fluorescence microscopy.
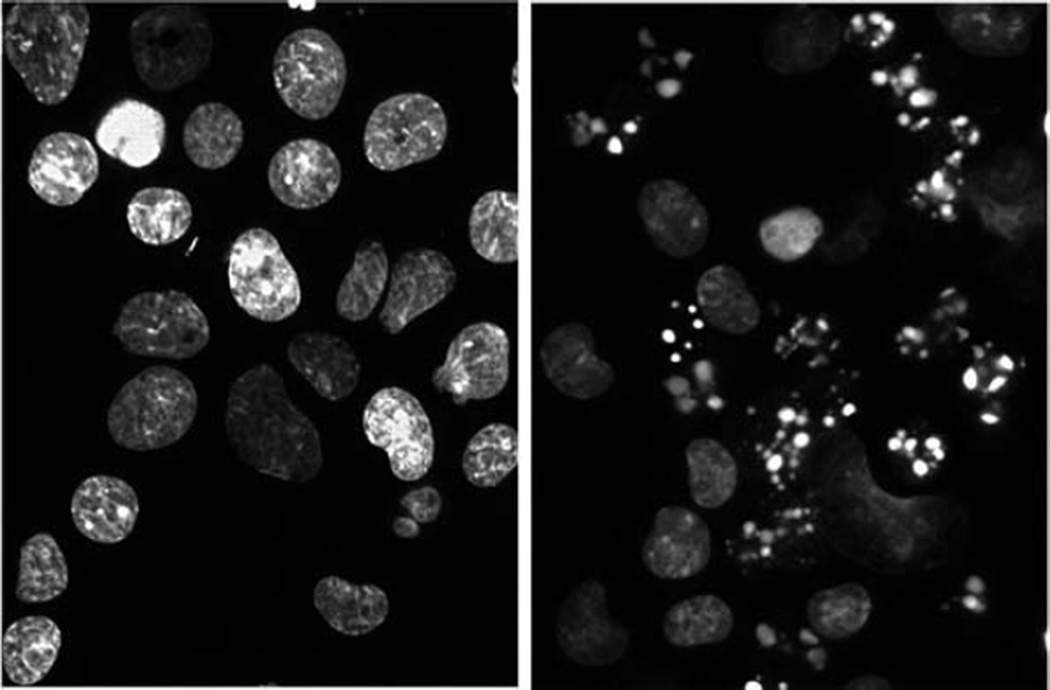
Apoptotic chromatin patterns can be detected by noting relative numbers of fragmented nuclei (see Note 9). Typical images are shown in Fig. 3.2, with the figure to the left showing normal chromatin and the image on the right reflecting the apoptotic response to an LD90 PDT dose. Approximately 50% of the cells were apoptotic 60 min after irradiation.
Fig. 3.2.
Typical patterns of chromatin labeled with HO342. Left, control L1210 cells; right, 60 min after an LD90 PDT dose using BPD.
3.4. Western Blots for Autophagy
Photosensitize and irradiate cells as specified above.
In duplicate samples, a 15 mM concentration of NH4Cl is present to retard the processing of autophagosomes.
Prepare lysates by mixing 7 mg cell pellets in 110 μl of Insect cell lysis buffer.
Incubate the lysates on ice for 30–60 min.
Centrifuge at 2,500×g for 1 min at 5°C. Discard debris.
Use a 10 μl portion of the lysate for determination of protein concentration.
Dilute lysates 1:1 with 2X Tris-glycine SDS sample buffer. Heat to 80°C for 5 min in stoppered tubes. Then cool. These samples can be stored at –70°C before electrophoresis.
Based on the protein concentration, determine the amount of samples to be used for electrophoresis. We generally use 40 μg of protein/well.
Apply samples to a 4–20% gradient gel.
Electrophoresis is carried out at room temperature using a potential of 25 V for 1–1.5 h.
Transfer proteins from the gel to a PVDF membrane in a chilled chamber for 1 h.
Block membrane with 5% blocking buffer for 1 h at room temperature or overnight at 4°C.
Rinse membrane with TBS-T (20 mM Tris-HCl, pH 7.6, 137 mM NaCl, 0.1% Tween 20) and add an LC3 antibody at 1:1,000 dilution. Incubate at room temperature with gentle agitation for 1 h or overnight at 4°C.
Wash membrane three times with TBS-T for 5 min each.
Apply the secondary antibody: Anti-rabbit IgG alkaline phosphatase-linked whole antibody at 1:10,000 in TBS-T.
Incubate at room temperature with gentle agitation for 1 h.
Wash three times using TBS-T for 5 min each.
Drain membrane and then apply the ECF substrate (Amersham/GE Western blotting reagent pack) to the protein side using 24 μl/cm2. Remove all air bubbles and incubate for 5 min at room temperature.
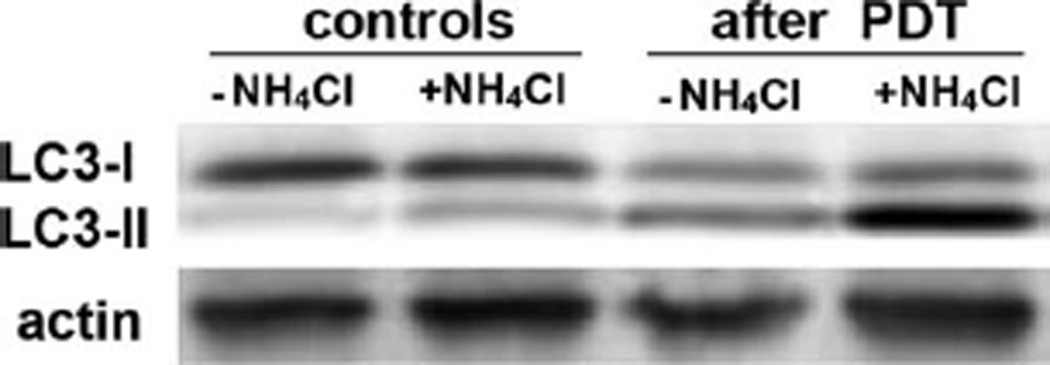
Assess fluorescence on the membrane using blue wavelength excitation and a 570-nm emission filter (STORM 840 system, Molecular Dynamics, Sunnyvale, CA). Figure 3.3 demonstrates the conversion of LC3-I to LC3-II, an index of autophagy. The effects of ammonium chloride can readily be seen: this retards the processing of autophagosomes providing an indication of the autophagic flux (13, 14).
Membranes can be stored dry at 2–8°C for re-probing if necessary (see Notes 6 and 10).
Fig. 3.3.
Conversion of LC3-I to LC3-II during PDT. Cells were treated with BPD and given a 25 mJ/cm2 light dose. Lysates were prepared for Western blots 15 min later. Where shown, 15 mM ammonium chloride was present during all incubations. A probe for actin was used to confirm that equal levels of protein were applied to each lane.
3.5. Clonogenic Assays
Using sterile conditions, prepare a 30% solution of agar in water, heat to 60°C to dissolve, then dilute 1:10 with growth medium. This solution is poured into 60-mm diameter plates and allowed to cool.
Using a cell counter, dilute cultures of treated (photosensitized and irradiated) and control cells so that 100–10,000 cells are placed on each plate (see Note 11).
For PDT-treated cells provide other dilutions, since some protocols will kill 90–99% of the cells. We normally plate several dilutions. The cell suspensions (20 μl) are added to the plates and spread over the surface with a sterile rod.
Incubate the plates in a humidified CO2 incubator at 37°C (5% CO2) for several days until distinct micro-colonies are seen.
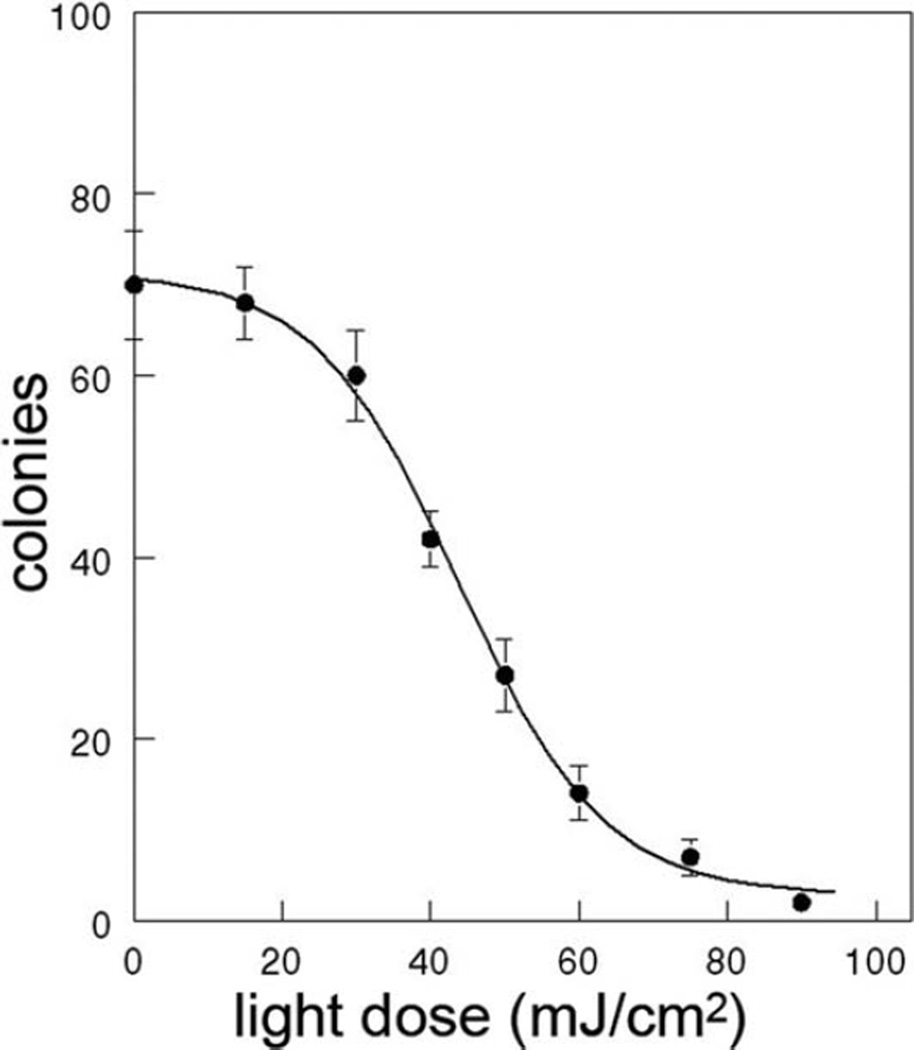
Add 0.5 ml of 0.1% thiazolyl blue tetrazolium bromide (Sigma) to each plate. After 3–24 h, the colonies are counted using an inverted microscope (×10 magnification). The dose–response curve obtained with L1210 cells and BPD at different light doses is shown in Fig. 3.4.
Fig. 3.4.
Dose–response curve for L1210 cells using BPD and 690 ± 10 nm light. Cells were incubated with 2 μM BPD for 30 min, then irradiated as described in the text. Data indicate numbers of colonies/plate after 10 days. Approximately 100 cells were plated using light doses of 0–50 mJ/cm2 and 1,000 cells for greater light doses.
Acknowledgments
The authors’ research is supported by NIH grant CA 23378 (to DK) and NIH grant CA 106491 (to NLO) from the National Cancer Institute, DHHS and by the State of Ohio Biomedical Research and Technology Transfer Trust TECH 05-063 (to NLO).
Footnotes
For growth of murine leukemia L1210 cells, we supplement this medium so as to approximate the composition of Fisher’s medium, which is no longer available. We add 45 mg/l MgCl2, 75 mg/l methionine, 30 mg/l phenylalanine, 30 mg/l valine, and 9 mg/l folic acid.
Other cells that we have used in studies of PDT-induced cell death include several human carcinoma cell lines, such as the human breast cancer MCF-7 cells and human prostate DU145 and PC-3 cells, and human skin cancer A431 cells. They require different media (RPMI 1640 or Eagle’s minimal essential medium with 10% fetal bovine serum). Furthermore, since these cells grow attached to the substratum, procedures for studying them must be modified slightly. For example, we use trypsin–EDTA to release the cells from the monolayer and gentle pipetting to break cell clumps into single cells before counting and replating.
There are dozens of compounds with photosensitizing capacity. In this report, use of BPD is illustrated since, unlike many of the others, this is readily available from a laboratory supply company and can be used without any special solubilization or formulation process. However, if another photosensitizer is used, it may be necessary to dissolve it in different medium. Many of the photosensitizers are hydrophobic, so use of DMSO, DMF, or ethanol is often employed. When these solvents are used, it is important to prepare a sufficiently concentrated stock solution so that the amount of the organic solvent added to the cultures never exceeds 0.1%, or if more is needed, it must be determined that none of the responses to be studied is affected by the solvent.
The fiber optic output from these diodes can deliver light at doses up to 250–500 mW, but these devices are essentially confined to single wavelengths. Varying the temperature of the diode can change this but only by a few nanometer. A lamp system that can be configured to deliver a 2′ diameter circle of light permitting the irradiation of several wells or small tubes. The diode system is excellent for irradiation of single tubes or cell samples in a cuvette where something else is being monitored. Quantum Devices can fabricate large arrays of LEDs at specified wavelengths for irradiation of multiple wells or tubes. These can deliver several 100 mW/cm2.
The light dose is calculated in terms of the photons actually absorbed by the photosensitizing agent. Investigators often report the total light dose over a broad wavelength range, where only a small portion of the total dose will be pertinent to PDT effects.
We have successfully used a Nikon Eclipse E600 scope fitter with Nikon Plan Fluor objectives. We have also employed a water immersion objective (60X Plan Apo VC) for acquiring a series of images acquired with a “z” drive. There is less drag with this objective than with an oil immersion system so that a series of images acquired using a “z” drive will show better registration. Such a series, coupled with an image-processing program, can be used to show enhanced lysosomal expression during autophagy.
The general procedure for Western blots can also be used to monitor the levels and changes in levels of any protein for which an antibody is available. For example, antibodies to apoptosis-associated proteins, such as Bcl-2 family members, caspases, and apoptosis-initiating factor, are available from several different suppliers. For each primary antibody, the secondary antibody must recognize the IgG of the specie in which the primary antibody was raised.
By manipulating the temperature of irradiation, it is possible to alter the immediate consequences. After Bcl-2 photodamage, insertion of Bax into mitochondria occurs only when the temperature is greater than 15°C (15). It is therefore possible to carry out irradiation at a temperature <15°C so as to prevent the initiation of apoptosis, so that localization and certain other studies can be carried out before any additional effects occur. With adherent human carcinoma cells in culture, all of the metabolic responses occur more slowly than in leukemic cells at equally toxic PDT doses. As a result, as long as the dose is lethal but not supralethal (e.g., killing no more than 90% of the cells), the early steps in apoptosis will be delayed for several minutes to hours without maintaining low temperatures. For these cells, photoirradiation is accomplished by placing the flask or dish in which the cells are growing directly on a glass plate above a suitable light source. After irradiation, the cells can be recovered immediately for measurement of initial photodynamic damage or the flasks can be returned to the incubator and recovered at later times for monitoring of delayed responses.
We employ the Fluoroskan Ascent plate reader (Thermo Scientific) using excitation at 485 nm and emission at 538 nm; settings appropriate for fluorescein. This is done at 2 min intervals over 30 min at room temperature. The maximum slope of the resulting fluorescence intensity curve is acquired and compared with standards provided in the kit.
It is also feasible to collect a series of planes using a Z-drive system (Prior Scientific Instruments, Folbourn, Cambridge, UK). These can be processed for maximum signal strength or maximum focus, using MetaMorph software or with the AutoQuant software (Media Cybernetics, Bethesda, MD). The latter is a system said to save rather than discard the out-of-focus pixels. This process produces images comparable with confocal fluorescence microscopy.
We have recently been exploring use of the Snap ID gel apparatus (Millipore). This uses a vacuum system to speed processing of gels and can cut 1 day off of the time involved. The results appear to be equivalent to the procedure outlined above.
The plating efficiency of L1210 cells is 60–70%, so that control plates will contain 60–70 colonies. Depending on the degree of cell kill, plating 100 cells could result in a plate containing 6–7 cells (LD90 conditions) or less. In order to deal with such an outcome, we normally plate between 1,000 and 10,000 photosensitized and irradiated cells. Under LD99 conditions, plating 10,000 cells will result in the appearance of 60–70 colonies. All such studies are done in triplicate. For human carcinoma cells, the cells must be released from the monolayer with 0.25% trypsin-EDTA, counted, and then plated at appropriate numbers in 60-mm Petri dishes without agar. After 10–14 days, colonies are stained with 0.1% crystal violet and counted. Plating efficiencies of human carcinoma cells are generally lower than for rodent cells, usually <50%; therefore, more cells must be plated to obtain a suitable number of colonies.
Contributor Information
David Kessel, Email: dhkessel@med.wayne.edu, Wayne State University School of Medicine, Detroit, MI, USA.
Nancy L. Oleinick, Case Western Reserve University, Cleveland, OH, USA
References
- 1.Dougherty TJ, Gomer CJ, Henderson BW, Jori G, Kesse LD, Korbelik M, Moan J, Peng Q. Photodynamic therapy. J Natl Cancer Inst. 1998;90:889–905. doi: 10.1093/jnci/90.12.889. [DOI] [PMC free article] [PubMed] [Google Scholar]
- 2.Kim HR, Luo Y, Li G, Kessel D. Enhanced apoptotic response to photodynamic therapy after Bcl-2 transfection. Cancer Res. 1999;59:3429–3432. [PMC free article] [PubMed] [Google Scholar]
- 3.Kessel D, Castelli M. Evidence that Bcl-2 is the target of three photosensitizers that induce a rapid apoptotic response. Photochem Photobiol. 2001;74:318–322. doi: 10.1562/0031-8655(2001)074<0318:etbitt>2.0.co;2. [DOI] [PubMed] [Google Scholar]
- 4.Xue LY, Chiu SM, Oleinick NL. Photochemical destruction of the Bcl-2 oncoprotein during photodynamic therapy with the phthalocyanine photosensitizer Pc 4. Oncogene. 2001;20:3420–3427. doi: 10.1038/sj.onc.1204441. [DOI] [PubMed] [Google Scholar]
- 5.Xue LY, Chiu SM, Fiebig A, Andrews DW, Oleinick NL. Photodamage to multiple Bcl-xL isoforms by photodynamic therapy with the phthalocyanine photosensitizer Pc 4. Oncogene. 2003;22:9197–9204. doi: 10.1038/sj.onc.1207019. [DOI] [PubMed] [Google Scholar]
- 6.Kessel D, Reiners JJ., Jr. Apoptosis and autophagy after mitochondrial or endoplasmic reticulum photodamage. Photochem Photobiol. 2007;83:1024–1028. doi: 10.1111/j.1751-1097.2007.00088.x. [DOI] [PMC free article] [PubMed] [Google Scholar]
- 7.Reiners JJ, Jr., Caruso JA, Mathieu P, Chelladurai B, Yin XM, Kessel D. Release of cytochrome c and activation of pro-caspase-9 following lysosomal photodamage involves Bid cleavage. Cell Death Differ. 2002;9:934–944. doi: 10.1038/sj.cdd.4401048. [DOI] [PMC free article] [PubMed] [Google Scholar]
- 8.Rodriguez ME, Azizuddin K, Chiu SM, Xue LY, Zhang P, Lam M, Kenney ME, Nieminen AL, Oleinick NL. Structural factors and mechanisms underlying the improved photodynamic cell killing with silicon phthalocyanine photosensitizers directed to lysosomes vs. mitochondria. Photochem Photobiol. 2009 doi: 10.1111/j.1751-1097.2009.00558.x. in press Epub ahead of print Apr 6. [DOI] [PMC free article] [PubMed] [Google Scholar]
- 9.Buytaert E, Callewaert G, Hendrickx N, Scorrano L, Hartmann D, Missiaen L, Vandenheede JR, Heirman I, Grooten J, Agostinis P. Role of endoplasmic reticulum depletion and multidomain proapoptotic BAX and BAK proteins in shaping cell death after hypericin-mediated photodynamic therapy. FASEB J. 2006;20:756–758. doi: 10.1096/fj.05-4305fje. [DOI] [PubMed] [Google Scholar]
- 10.Kessel D, Arroyo AS. Apoptotic and autophagic responses to Bcl-2 inhibition and photodamage. Photochem Photobiol Sci. 2007;6:1290–1295. doi: 10.1039/b707953b. [DOI] [PMC free article] [PubMed] [Google Scholar]
- 11.Kessel D, Vicente MG, Reiners JJ., Jr. Initiation of apoptosis and autophagy by photodynamic therapy. Lasers Surg Med. 2006;38:482–488. doi: 10.1002/lsm.20334. [DOI] [PMC free article] [PubMed] [Google Scholar]
- 12.Xue LY, Chiu SM, Azizuddin K, Joseph S, Oleinick NL. The death of human cancer cells following photodynamic therapy: apoptosis competence is necessary for Bcl-2 protection but not for induction of autophagy. Photochem Photobiol. 2007;83:1016–1023. doi: 10.1111/j.1751-1097.2007.00159.x. [DOI] [PubMed] [Google Scholar]
- 13.Klionsky D, et al. Guidelines for the use and interpretation of assays for monitoring autophagy in higher eukaryotes. Autophagy. 2008;4:151–175. doi: 10.4161/auto.5338. [DOI] [PMC free article] [PubMed] [Google Scholar]
- 14.Mizushima N, Yoshimori T. How to interpret LC3 immunoblotting. Autophagy. 2007;3:542–545. doi: 10.4161/auto.4600. [DOI] [PubMed] [Google Scholar]
- 15.Pryde JG, Walker A, Rossi AG, Hannah S, Haslett C. Temperaturedependent arrest of neutrophil apoptosis. Failure of Bax insertion into mitochondria at 15 degrees C prevents the release of cytochrome c. J Biol Chem. 2000;275:33574–33584. doi: 10.1074/jbc.M001008200. [DOI] [PubMed] [Google Scholar]
- 16.Iwai-Kanai E, Yuan H, Huang C, Sayen MR, Perry-Garza CN, Kim L, Gottlieb RA. A method to measure cardiac autophagic flux in vivo. Autophagy. 2008;4:322–329. doi: 10.4161/auto.5603. (in process). [DOI] [PMC free article] [PubMed] [Google Scholar]


