

Abstract
Primary torsion dystonia (PTD) has been conceptualized as a disorder of the basal ganglia. However, recent data suggest a widespread pathology involving motor control pathways. In this report, we explored whether PTD is associated with abnormal anatomical connectivity within motor control pathways. We used diffusion tensor magnetic resonance imaging (DT-MRI) to assess the microstructure of white matter. We found that fractional anisotropy, a measure of axonal integrity and coherence, was significantly reduced in PTD patients in the pontine brainstem in the vicinity of the left superior cerebellar peduncle and bilaterally in the white matter of the sensorimotor region. Our data thus support the possibility of a disturbance in cerebello-thalamo-cortical pathways as a cause of the clinical manifestations of PTD.
Keywords: diffusion tensor MRI, primary dystonia, motor control, cerebellum, brainstem, basal ganglia, torsinA
Dystonia is characterized as a syndrome of sustained muscle contractions that often cause abnormal postures or involuntary repetitive movements. Primary torsion dystonia (PTD) can be distinguished from other etiologic subgroups of dystonia by the presence of dystonia as the only or primary clinical sign and the absence of another etiology.1 The most frequent genetic cause of PTD is a heterozygous GAG deletion in the gene DYT1, which results in the loss of a glutamic acid residue in the encoded protein, torsinA.1 A less frequent autosomal dominant variant of PTD identified in North American Mennonite families is mappped to a gene on chromosome 8 (DYT6).2 Both genotypes are associated with incomplete penetrance,3 but the pathophysiological link between mutation carrier status and clinical penetrance is unknown. Although PTD has traditionally been conceptualized as a disorder inherent to the basal ganglia, recent electrophysiological, functional imaging, and anatomical studies have suggested the presence of more widespread pathology involving motor control pathways from the neocortical to the spinal level.4–8
In a series of PET studies conducted in the resting state, we identified a reproducible abnormal spatial covariance pattern of regional metabolism in DYT1 mutation carriers, even in those without clinical manifestations (non-manifesting carriers).9,10 This torsion dystonia-related pattern is characterized by relative metabolic increases in the putamen/globus pallidus, the supplementary motor area (SMA), and the lateral cerebellum. Changes in basal ganglia metabolism are also found in the DYT6 genotype. These mutation carriers showed a significant metabolic reduction in the putamen that is more pronounced in those affected clinically (manifesting carriers).11 In both PTD genotypes, regional metabolic increases in the pre-SMA and the parietal association cortices distinguished mutation carriers with clinical manifestations of dystonia from their non-manifesting counterparts.11 These results are consistent with the notion of impaired striatal function as a feature of the two genotypes, with impaired sensorimotor integration as a state or phenotype feature.
The presence of abnormal functional connectivity in DYT1 patients prompted a study of the effects of this mutation on anatomical connectivity.12 Using diffusion tensor magnetic resonance imaging (DT-MRI), we found that fractional anisotropy (FA), a measure of axonal integrity and coherence, was reduced in the subgyral white matter of the sensorimotor cortex (SMC) of DYT1 carriers. Moreover, controlling for age, manifesting carriers showed a pronounced FA reduction in this area compared to their non-manifesting counterparts. This finding suggested that a further pronounced or spatially expanded anatomical impairment of motor control pathways may underlie symptom manifestations in PTD in addition to changes specific to the genotype.
In this study we used DT-MRI to determine whether disordered anatomical connectivity, expressed as changes in white matter microstructure, is linked to the presence of clinical manifestations in PTD. In contrast to our earlier study, we focused on the detection of changes specific to phenotype, rather than genotype. We used voxel-based analysis of FA maps to compare a group of dystonia patients carrying either the DYT1 mutation or the DYT6 haplotype with age-matched controls. In a secondary analysis, we assessed the effects of clinical penetrance on the microstructure of this region by quantifying FA in a volume of interest (VOI) analysis in non-manifesting DYT1 carriers. Because, DT-MRI measures can vary with age,13 we used separate groups of healthy controls age-matched to the PTD group and to non-manifesting DYT1 mutation carriers, respectively. We hypothesized that irrespective of genotype, PTD is associated with focal abnormalities of anatomical connectivity within motor control pathways.
SUBJECTS AND METHODS
Subjects
We studied seven PTD patients (MAN; four female, three male; age: 29.3 ± 9.8 years, mean ± standard deviation); a group of seven age-matched healthy volunteer subjects served as controls for this PTD group (CMAN; six female, one male; age: 30.2 ± 5.8 years). The patient cohort was comprised of four DYT1 mutation positive subjects (age: 25.5 ± 4.4 years) and three DYT6 subjects carrying the linked haplotype (age: 34.35 ± 14.0 years); patient characteristics are displayed in Table 1. Five patients had segmental dystonia while the remaining two had multifocal and generalized dystonia, respectively.
TABLE 1.
Patient characteristics
| Patient | Sex | Age | Genotype | Disease characteristics | BFM* | Disease duration (years) | Medication |
|---|---|---|---|---|---|---|---|
| 1 | M | 24 | DYT1 | Segmental | — | 9 | Baclofen, clonazepam |
| 2 | F | 32 | DYT1 | Generalized | 46 | 22 | Diazepam, tetrabenazin, citalopram, topiramate |
| 3 | M | 22 | DYT1 | Segmental | 7 | 12 | Trihexyphenidyl, baclofen |
| 4 | F | 24 | DYT1 | Multifocal | 5 | 11 | Trihexyphenidyl |
| 5 | M | 44 | DYT6 | Segmental | 2 | 13 | None |
| 6 | F | 41 | DYT6 | Segmental | 5 | 12 | None |
| 7 | F | 18 | DYT6 | Segmental | 4.5 | 3 | Trihexyphenidyl |
BFM = Total Burke–Fahn–Marsden score
In a secondary VOI analysis, data from the subjects were compared with measurements from two additional groups: (1) eight non-manifesting DYT1 mutation carriers (DYT1-NM; age: 53.4 ± 13.9 years, five male) and (2) eight healthy controls matched in age to these non-manifesting carriers (CNM; age: 53.6 ± 13.0 years, four male). DTI data for these subjects have been presented previously.12 Because DT-MRI measures are age-dependent,13,14 and a significant age difference existed between MAN and DYT1-NM (P = 0.002; Student’s t-test), we contrasted the DYT1-NM data with data from a separate group of older control subjects.
The inclusion and exclusion criteria for subject participation have been presented elsewhere.15 Written informed consent was obtained from all participants under protocols approved by the institutional review boards of the participating institutions in concordance with the guidelines of the Declaration of Helsinki.
Magnetic Resonance Imaging
MRI scans were obtained for all subjects on a 1.5T GE Signa Echo Speed scanner at North Shore University Hospital. Prior to diffusion tensor imaging, subjects were scanned with routine T1 and T2 weighted sequences to identify potentially disqualifying structural brain lesions. DTI was performed with a spin-echo sequence and single-shot echo planar image acquisition. T1 images were acquired with a 3D gradient echo sequence (MPRAGE) with matrix size 128 × 180 × 256 giving 1–1.5 mm resolution in each dimension. T2 weighted images were acquired with a whole-brain multislice fast spin echo sequence (TR = 3,400 ms, TE = 120 ms, 4-mm slice thickness, 250 × 256 matrix size, in-plane resolution (0.8 × 0.8 mm2).
Diffusion tensor series were acquired as detailed earlier.16 In brief, data were sampled with a spin-echo sequence and single-shot echo planar image acquisition. Diffusion-weighted images were acquired with a 240 × 240 mm2 Field of View, 128 × 128 pixels, and a slice thickness of 5 mm. Seven images were acquired per slice, repeated four times. One image was not diffusion-weighted (b = 0 s/mm2) and six images were diffusion-sensitized with a b factor of 860 s/mm2 along six non-collinear directions: (Gx, Gy, Gz) = {(1,1,0), (0,1,1), (1,0,1), (−1,1,0), (0,−1,1), (1,0,−1)}. Averaging was performed after Fourier transform. The six independent elements of the diffusion tensor were calculated from the six apparent diffusion coefficients measured in the six noncollinear directions. The tensor values were used to calculate FA on a voxel-by-voxel basis.17 FA yields values between 0 (perfectly isotropic, i.e., symmetric/random, self-diffusion of water) and 1 (diffusion in a hypothetically infinitely long and infinitely thin cylinder). This measure is determined by a number of microstructural features including the integrity of axonal cell membranes, the coherence of axonal orientation, and the number and size of axons.18
Image Analysis
Calculation of FA maps was performed in native space and maps were inspected for artifacts before further processing. The 18 FA slices generated from the raw diffusion tensor series of each subject were: (1) merged into an analyzable volume using ScanVP software (available at http://feinsteinneuroscience.org/software); (2) stereotaxically normalized into standardized anatomical space with the MRI T1 template in SPM 99 (Wellcome Department of Cognitive Neurology, London, UK); and (3) visually inspected to assure that the anterior commissure as an anatomical landmark was localized correctly. The normalized FA images were smoothed with an isotropic Gaussian kernel (FWHM 4 mm for all directions).
The primary group comparison was performed in the general linear model in SPM 99. Images were thresholded to include only voxels with 80% of the mean signal intensity, reducing the space to be analyzed to white matter regions. Peak statistical threshold was set at P < 0.001 with an extent threshold of 10 voxels. Regional group differences were considered significant for P < 0.05, corrected for area, if consistent with the a priori hypothesis of abnormality restricted to motor control pathways. Coordinates were reported in the standard anatomical space developed at the Montreal Neurological Institute.19
The voxel-based results were confirmed and expanded in a subsequent VOI analysis. For all VOI analyses, spherical VOIs (diameter = 5 mm) were automatically placed bilaterally over the regions identified in the data-driven voxel analysis as having lower FA values in the PTD subjects. Group comparisons were performed using unpaired Student’s t-tests or analysis of variance (ANOVA) followed by the Tukey–Kramer adjustment, where appropriate. These effects were considered meaningful for P < 0.05 after Tukey–Kramer HSD adjustment as correction for multiple comparisons. All statistical analyses were performed using JMP software (SAS Institute, Cary, NC) for PC.
RESULTS
Routine T1 and T2 weighted MRI scans were normal in all participants. Voxel-based group comparison of PTD versus age-matched controls (MAN vs. CMAN) revealed a localized FA reduction in the PTD group in the dorsal pontine brainstem at the base of the left superior cerebellar peduncle (x = −12; y = −28; z = −24; Zmax = 3.9; Ke = 51 voxels; P < 0.01, area corrected; Fig. 1A). This finding was confirmed in the VOI analysis with a mean FA of 0.376 ± 0.02 (mean ± SE) in the left dorsal brainstem in PTD and 0.477 ± 0.02 in controls (P < 0.001; Fig. 1B). This corresponds to a 21.0% ± 3.4% FA reduction in this region in the PTD group relative to age-matched controls. VOI analysis on the contralateral dorsal pontine brainstem (x = 12; y = −28; z = −24) disclosed a decrease of smaller magnitude in the PTD group (6.6% ± 2.7%, P = 0.04). Additionally, the voxel-based analysis revealed reduced FA in the subgyral white matter of the sensorimotor area bilaterally (L: x = −30; y = −30; z = 54; Zmax = 3.1; Ke = 85 voxels; R: x = 24; y = −20; z = 64; Zmax = 2.9; Ke = 80 voxels; P < 0.05, area corrected; Fig. 2A). This finding was confirmed in the VOI analysis of the sensorimotor area with mean FA values of 0.401 ± 0.01/0.434 ± 0.01 (L/R) in PTD and 0.503 ± 0.02/0.539 ± 0.02 in controls (P < 0.001; Fig. 2B).
FIG. 1.
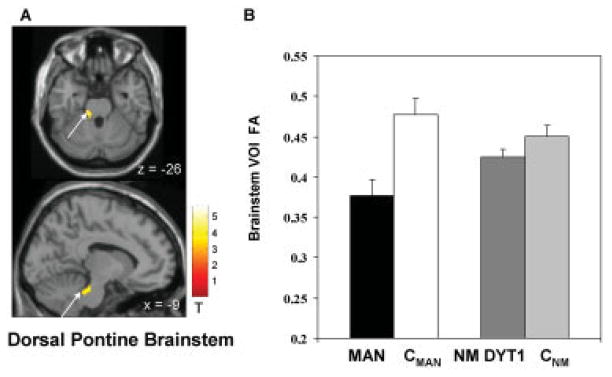
FA decreases in PTD in the pontine brainstem at the base of the left cerebellar peduncle. (A) Statistical parametric maps of the voxel-based analysis of DT-MRI derived FA data comparing PTD patients to age-matched controls superimposed on a single-subject MRI T1 template (top: axial slice; bottom: sagittal slice). (B) The bar charts illustrate VOI FA values extracted from the cluster displayed in (A) (arrow) comparing PTD patients (MAN; black) to the age-matched controls (CMAN; white) as well as a comparison of the non-manifesting DYT1 gene carriers (DYT1-NM; dark gray) to the respectively age-matched controls (CNM; light gray). [The color scale represents T-scores a threshold at 3.05, P < 0.001].
FIG. 2.
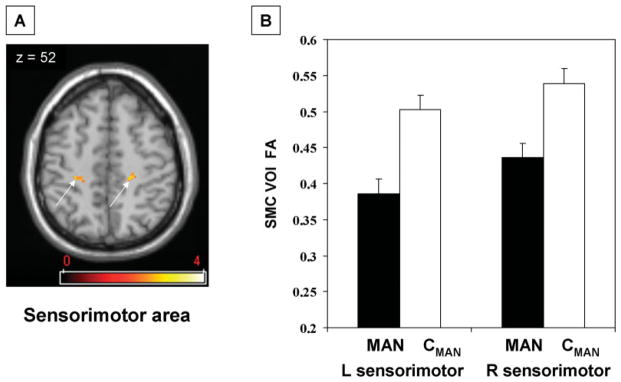
FA decreases in PTD in the sensorimotor cortex bilaterally. (A) Statistical parametric map of the voxel-based analysis of DT-MRI derived FA data comparing PTD patients to age-matched controls superimposed on a single-subject MRI T1 template (axial slice). (B) The bar charts illustrate VOI FA values extracted from the clusters displayed in (A) (arrows) comparing PTD patients (MAN; black) to the age-matched controls (CMAN; white). [The color scale represents T-scores a threshold at 2.5, P < 0.01].
In a secondary analysis we assessed left dorsal pontine VOI measures in eight non-manifesting DYT1 mutation carriers (DYT1-NM), and in a second group of controls, age-matched to the non-manifesting subjects (CNM). Comparison of DYT1-NM to CNM showed no significant difference in left dorsal pontine VOI FA (P = 0.16; see Fig. 1B). Furthermore, one-way ANOVA of all four groups (MAN, CMAN, DYT1-NM, CNM) revealed significant differences in FA values across groups [F(3,29) = 8.5, P < 0.0004]. Post-hoc comparison confirmed a significant FA reduction in MAN compared to CMAN as well as compared to CNM (Tukey Kramer HSD P < 0.05). By contrast, DYT1-NM took an intermediate position and were not significantly different from either of the groups (see Fig. 1B). No difference was found between brainstem FA measures in CMAN and CNM.
There were no statistically significant increases in FA in PTD compared to age-matched controls.
DISCUSSION
In this study we demonstrated impaired anatomical connectivity within motor control pathways in hereditary PTD. Our main result shows reduced measures of axonal coherence and integrity in the PTD group localized to the dorsal pontine brainstem at its juncture with the superior cerebellar peduncle, and in the SMC. Dorsal brainstem FA in nonmanifesting DYT1carriers took an intermediate position, but did not differ significantly from PTD patients or healthy controls. Thus, the reported brainstem abnormality is linked to phenotype, with genotype functioning as a potential susceptibility factor. By contrast, reductions in FA of the white matter of the sensorimotor region have been related to genotype in our earlier study in DYT1 mutation carriers.12
Functional and anatomical brainstem pathology has previously been demonstrated in dystonia.20–24 However, this is the first study to identify anatomical brainstem pathology in vivo. Increased excitability of brainstem reflexes was found in primary dystonia patients before implantation of deep brain stimulation.21 This effect has been attributed to impaired descending control of brainstem reflexes rather than to local pathology. However, ubiquitin positive inclusions in the pedunculopontine nucleus (PPN) have been shown in manifesting DYT1 carriers22 as well as in a transgenic mouse model of DYT1 dystonia.25 The PPN is part of the mesencephalic locomotor region that regulates muscle tone and rhythmic limb movements during locomotion.26,27 This nucleus is intimately related to major nodes of the basal ganglia that have similarly been implicated in dystonia.28,29 PPN receives major afferents from the internal segment of the globus pallidus, the substantia nigra pars reticulata, and the subthalamic nucleus (STN). Output regions of PPN include the intralaminar thalamic nuclei, STN, substantia nigra pars compacta, cerebellar nuclei, and spinal cord. Our in vivo data are compatible with involvement of white matter pathways to or from the PPN, such as those projecting to this region from the internal globus pallidus, those projecting from this region to the thalamus, or both.
Alternatively, reduced white matter integrity in the vicinity of the superior cerebellar peduncle is compatible with a possible cerebellar role in the pathogenesis of dystonia.6 This area is likely to be part of the cerebello-thalamocortical loop.30 The superior cerebellar peduncle comprises the major efferents from the cerebellar nuclei to the contralateral ventral oral posterior (Vop) thalamic nucleus, either directly or via the magnocellular red nucleus. From the Vop nucleus of thalamus, further projections relate to the primary motor cortex (Area 4), where direct synapses to neurons projecting back to the cerebellar cortex via pontine nuclei exist.30 The second main component of the superior cerebellar peduncle is the ventral spinocerebellar tract that carries proprioceptive impulses from the periphery to the paleocerebellum. However, without high resolution three-dimensional tractography,31 we cannot ascertain whether the abnormality in anatomical connectivity is due to a disturbance of the ventral spinocerebellar tract, due to cerebello-rubral/cerebello-thalamic projections, or due to disruptions in the afferents or efferents of the PPN. Since the ventral spinocerebellar tract is implicated in the cerebellar control of muscle tone, which is disturbed in dystonia, we cannot exclude the possibility that this pathway mediates certain manifestations of this disorder. Although there is abundant evidence of involvement of the basal ganglia-thalamo-cortical motor loop in dystonia,8,32,33 cerebellothalamic pathways have also been implicated.6 Indeed, a specific pattern of increased metabolic activity in the midbrain, cerebellum, and thalamus has been described in affected DYT1 carriers.9 Pathological studies in the secondary dystonias21,34–36 and in experimental animal models37–39 point to a role for these projections in the generation of dystonic movements.
We also confirmed that reduced white matter integrity in the SMC is present in hereditary dystonia.12 We could not, however, fully address the independent effect of genotype in the current study due to (i) the lack of non-manifesting DYT6 mutation carriers, (ii) the small sample sizes in our subgroups, and (iii) the age difference inherent to the definition of manifesting and non-manifesting subjects. Notably, the difference in brainstem FA between PTD and non-manifesting DYT1 mutation carriers (see Fig. 1B) cannot be attributed to healthy ageing. FA measures have been consistently reported to decline with age with a pronounced ageing effect in frontal white matter compared to posterior regions.13,40 Despite documentation of an age-related decline of global FA,41 Pfefferbaum et al.42 showed regionally specific declines without an effect of age on the ponto-cerebellar tract. We found reduced brainstem FA in PTD, although this was the youngest subgroup.
Notably, our PTD group comprised subjects manifesting with generalized, segmental, and multifocal dystonia. Despite this clinical heterogeneity, a well-localized reduction of white matter was detected in the group comparison. This suggests a specific disturbance in these motor control pathways irrespective of the distribution of symptoms in the disease group. Studies in larger cohorts may yield additional information as to localized disturbances in specific clinical subtypes of dystonia.
Our results differ markedly from prior studies of DTI measures focusing on cervical dystonia. Reduced measures of axonal integrity and coherence were localized to the genu and corpus callosum and interpreted as a potential structural origin of reduced cortical inhibition.43 Increased FA values in the thalamus and frontal regions were reported recently.44 Furthermore, abnormal asymmetry of DTI measures in a region between the thalamus and pallidum was found in a mixed group of focal dystonia patients.45 Mechanisms of disease may, however, differ in focal dystonia as a form of late onset idiopathic dystonia and the early onset PTD we studied.
In summary, our data suggest that altered microstructural integrity of brainstem pathways may constitute a mechanism in the development of idiopathic early onset dystonia. The results of this study, however, do not allow us to choose between the involvement of PPN or cerebellar projections in the pathogenesis of dystonia. We also cannot be certain whether white matter incoherence is present in genotypes other than those assessed here. Further studies in larger cohorts of carriers of a variety of dystonia-related mutations will be needed to investigate these questions.
Acknowledgments
This work was supported by the NIH NINDS R01 NS047668 and the Bachmann-Strauss Foundation. We thank Toni Flanagan and Loreta Quartarolo for study coordination and Nathaniel Brown for editorial support. We are also indebted to Deborah Raymond for patient recruitment and to Dr. Rachel Saunders-Pullman for clinical assessments.
References
- 1.Bressman SB. Dystonia update. Clin Neuropharmacol. 2000;23:239–251. doi: 10.1097/00002826-200009000-00002. [DOI] [PubMed] [Google Scholar]
- 2.Klein C, Ozelius LJ. Dystonia: clinical features, genetics, and treatment. Curr Opin Neurol. 2002;15:491–497. doi: 10.1097/00019052-200208000-00014. [DOI] [PubMed] [Google Scholar]
- 3.Bressman SB, de Leon D, Kramer PL, et al. Dystonia in Ashkenazi Jews: clinical characterization of a founder mutation. Ann Neurol. 1994;36:771–777. doi: 10.1002/ana.410360514. [DOI] [PubMed] [Google Scholar]
- 4.Berardelli A, Rothwell JC, Hallett M, Thompson PD, Manfredi M, Marsden CD. The pathophysiology of primary dystonia. Brain. 1998;121 (Part 7):1195–1212. doi: 10.1093/brain/121.7.1195. [DOI] [PubMed] [Google Scholar]
- 5.Hallett M. Disorder of movement preparation in dystonia. Brain. 2000;123 (Part 9):1765–1766. doi: 10.1093/brain/123.9.1765. [DOI] [PubMed] [Google Scholar]
- 6.Jinnah HA, Hess EJ. A new twist on the anatomy of dystonia: the basal ganglia and the cerebellum? Neurology. 2006;67:1740–1741. doi: 10.1212/01.wnl.0000246112.19504.61. [DOI] [PubMed] [Google Scholar]
- 7.Trost M. Dystonia update. Curr Opin Neurol. 2003;16:495–500. doi: 10.1097/01.wco.0000084228.82329.4a. [DOI] [PubMed] [Google Scholar]
- 8.Vitek JL. Pathophysiology of dystonia: a neuronal model. Mov Disord. 2002;17 (Suppl 3):S49– 62. doi: 10.1002/mds.10142. [DOI] [PubMed] [Google Scholar]
- 9.Eidelberg D, Moeller JR, Antonini A, et al. Functional brain networks in DYT1 dystonia. Ann Neurol. 1998;44:303–312. doi: 10.1002/ana.410440304. [DOI] [PubMed] [Google Scholar]
- 10.Trošt M, Carbon M, Edwards C, et al. Primary dystonia: is abnormal functional brain architecture linked to genotype? Ann Neurol. 2002;52:853–856. doi: 10.1002/ana.10418. [DOI] [PubMed] [Google Scholar]
- 11.Carbon M, Su S, Dhawan V, Raymond D, Bressman S, Eidelberg D. Regional metabolism in primary torsion dystonia: effects of penetrance and genotype. Neurology. 2004;62:1384–1390. doi: 10.1212/01.wnl.0000120541.97467.fe. [DOI] [PubMed] [Google Scholar]
- 12.Carbon M, Kingsley PB, Su S, et al. Microstructural white matter changes in carriers of the DYT1 gene mutation. Ann Neurol. 2004;56:283–286. doi: 10.1002/ana.20177. [DOI] [PubMed] [Google Scholar]
- 13.Sullivan EV, Pfefferbaum A. Diffusion tensor imaging and aging. Neurosci Biobehav Rev. 2006;30:749–761. doi: 10.1016/j.neubiorev.2006.06.002. [DOI] [PubMed] [Google Scholar]
- 14.Grieve SM, Williams LM, Paul RH, Clark CR, Gordon E. Cognitive aging, executive function, and fractional anisotropy: a diffusion tensor MR imaging study. AJNR Am J Neuroradiol. 2007;28:226–235. [PMC free article] [PubMed] [Google Scholar]
- 15.Ghilardi MF, Carbon M, Silvestri G, et al. Impaired sequence learning in carriers of the DYT1 dystonia mutation. Ann Neurol. 2003;54:102–109. doi: 10.1002/ana.10610. [DOI] [PubMed] [Google Scholar]
- 16.Lim KO, Hedehus M, Moseley M, deCrespigny A, Sullivan EV, Pfefferbaum A. Compromised white matter tract integrity in schizophrenia inferred from diffusion tensor imaging. Arch Gen Psychiatry. 1999;56:367–374. doi: 10.1001/archpsyc.56.4.367. [DOI] [PubMed] [Google Scholar]
- 17.Basser PJ, Pierpaoli C. Microstructural and physiological features of tissues elucidated by quantitative-diffusion-tensor MRI. J Magn Reson B. 1996;111:209–219. doi: 10.1006/jmrb.1996.0086. [DOI] [PubMed] [Google Scholar]
- 18.Le Bihan D. Looking into the functional architecture of the brain with diffusion MRI. Nat Rev Neurosci. 2003;4:469–480. doi: 10.1038/nrn1119. [DOI] [PubMed] [Google Scholar]
- 19.Collins DL, Neelin P, Peters TM, Evans AC. Automatic 3D inter-subject registration of MR volumetric data in standardized Talairach space. J Comput Assist Tomogr. 1994;18:192–205. [PubMed] [Google Scholar]
- 20.Berardelli A. New advances in the pathophysiology of focal dystonias. Brain. 2006;129 (Part 1):6–7. doi: 10.1093/brain/awh717. [DOI] [PubMed] [Google Scholar]
- 21.LeDoux MS, Brady KA. Secondary cervical dystonia associated with structural lesions of the central nervous system. Mov Disord. 2003;18:60–69. doi: 10.1002/mds.10301. [DOI] [PubMed] [Google Scholar]
- 22.McNaught KS, Kapustin A, Jackson T, et al. Brainstem pathology in DYT1 primary torsion dystonia. Ann Neurol. 2004;56:540–547. doi: 10.1002/ana.20225. [DOI] [PubMed] [Google Scholar]
- 23.Tisch S, Limousin P, Rothwell JC, et al. Changes in blink reflex excitability after globus pallidus internus stimulation for dystonia. Mov Disord. 2006;21:1650–1655. doi: 10.1002/mds.20899. [DOI] [PubMed] [Google Scholar]
- 24.Zweig RM, Hedreen JC, Jankel WR, Casanova MF, Whitehouse PJ, Price DL. Pathology in brainstem regions of individuals with primary dystonia. Neurology. 1988;38:702–706. doi: 10.1212/wnl.38.5.702. [DOI] [PubMed] [Google Scholar]
- 25.Shashidharan P, Sandu D, Potla U, et al. Transgenic mouse model of early-onset DYT1 dystonia. Hum Mol Genet. 2005;14:125–133. doi: 10.1093/hmg/ddi012. [DOI] [PubMed] [Google Scholar]
- 26.Garcia-Rill E. The basal ganglia and the locomotor regions. Brain Res. 1986;396:47–63. [PubMed] [Google Scholar]
- 27.Pahapill PA, Lozano AM. The pedunculopontine nucleus and Parkinson’s disease. Brain. 2000;123 (Part 9):1767–1783. doi: 10.1093/brain/123.9.1767. [DOI] [PubMed] [Google Scholar]
- 28.Hazrati LN, Parent A. Contralateral pallidothalamic and pallidote-gmental projections in primates: an anterograde and retrograde labeling study. Brain Res. 1991;567:212–223. doi: 10.1016/0006-8993(91)90798-z. [DOI] [PubMed] [Google Scholar]
- 29.Lavoie B, Parent A. Pedunculopontine nucleus in the squirrel monkey: projections to the basal ganglia as revealed by antero-grade tract-tracing methods. J Comp Neurol. 1994;344:210–231. doi: 10.1002/cne.903440204. [DOI] [PubMed] [Google Scholar]
- 30.Carpenter M. Neuroanatomy. 8. Baltimore: Williams & Wilkins; 1983. p. 481. [Google Scholar]
- 31.Stieltjes B, Kaufmann WE, van Zijl PC, et al. Diffusion tensor imaging and axonal tracking in the human brainstem. Neuroimage. 2001;14:723–735. doi: 10.1006/nimg.2001.0861. [DOI] [PubMed] [Google Scholar]
- 32.DeLong MR. Primate models of movement disorders of basal ganglia origin. Trends Neurosci. 1990;13:281–285. doi: 10.1016/0166-2236(90)90110-v. [DOI] [PubMed] [Google Scholar]
- 33.Tinazzi M, Rosso T, Fiaschi A. Role of the somatosensory system in primary dystonia. Mov Disord. 2003;18:605–622. doi: 10.1002/mds.10398. [DOI] [PubMed] [Google Scholar]
- 34.Barth PG. Pontocerebellar hypoplasias. An overview of a group of inherited neurodegenerative disorders with fetal onset. Brain Dev. 1993;15:411–422. doi: 10.1016/0387-7604(93)90080-r. [DOI] [PubMed] [Google Scholar]
- 35.Simonati A, Dalla Bernardina B, Colombari R, Rizzuto N. Pontocerebellar hypoplasia with dystonia: clinico-pathological findings in a sporadic case. Childs Nerv Syst. 1997;13:642–647. doi: 10.1007/s003810050161. [DOI] [PubMed] [Google Scholar]
- 36.Tan EK, Chan LL, Auchus AP. Hemidystonia precipitated by acute pontine infarct. J Neurol Sci. 2005;234:109–111. doi: 10.1016/j.jns.2005.03.046. [DOI] [PubMed] [Google Scholar]
- 37.Faherty CJ, Earley B, Leonard BE. Behavioural effects of selective serotonin reuptake inhibitors following direct micro injection into the left red nucleus of the rat. J Psychopharmacol. 1997;11:53–58. doi: 10.1177/026988119701100114. [DOI] [PubMed] [Google Scholar]
- 38.Raike RS, Jinnah HA, Hess EJ. Animal models of generalized dystonia. NeuroRx. 2005;2:504–512. doi: 10.1602/neurorx.2.3.504. [DOI] [PMC free article] [PubMed] [Google Scholar]
- 39.Richter A, Loscher W. Pathology of idiopathic dystonia: findings from genetic animal models. Prog Neurobiol. 1998;54:633–677. doi: 10.1016/s0301-0082(97)00089-0. [DOI] [PubMed] [Google Scholar]
- 40.Salat DH, Tuch DS, Hevelone ND, et al. Age-related changes in prefrontal white matter measured by diffusion tensor imaging. Ann NY Acad Sci. 2005;1064:37–49. doi: 10.1196/annals.1340.009. [DOI] [PubMed] [Google Scholar]
- 41.Salat DH, Tuch DS, Greve DN, et al. Age-related alterations in white matter microstructure measured by diffusion tensor imaging. Neurobiol Aging. 2005;26:1215–1227. doi: 10.1016/j.neurobiolaging.2004.09.017. [DOI] [PubMed] [Google Scholar]
- 42.Pfefferbaum A, Adalsteinsson E, Sullivan EV. Frontal circuitry degradation marks healthy adult aging: evidence from diffusion tensor imaging. Neuroimage. 2005;26:891–899. doi: 10.1016/j.neuroimage.2005.02.034. [DOI] [PubMed] [Google Scholar]
- 43.Colosimo C, Pantano P, Calistri V, Totaro P, Fabbrini G, Berardelli A. Diffusion tensor imaging in primary cervical dystonia. J Neurol Neurosurg Psychiatry. 2005;76:1591–1593. doi: 10.1136/jnnp.2004.056614. [DOI] [PMC free article] [PubMed] [Google Scholar]
- 44.Bonilha L, de Vries PM, Vincent DJ, et al. Structural white matter abnormalities in patients with idiopathic dystonia. Mov Disord. 2007;22:1110–1116. doi: 10.1002/mds.21295. [DOI] [PubMed] [Google Scholar]
- 45.Blood AJ, Tuch DS, Makris N, Makhlouf ML, Sudarsky LR, Sharma N. White matter abnormalities in dystonia normalize after botulinum toxin treatment. Neuroreport. 2006;17:1251–1255. doi: 10.1097/01.wnr.0000230500.03330.01. [DOI] [PMC free article] [PubMed] [Google Scholar]