Abstract
Haematopoietic stem cells (HSCs) self-renew for life, thereby making them one of the few blood cells that truly age1,2. Paradoxically, although HSCs numerically expand with age, their functional activity declines over time, resulting in degraded blood production and impaired engraftment following transplantation2. While many drivers of HSC ageing have been proposed2–5, the reason why HSC function degrades with age remains unknown. Here we show that cycling old HSCs in mice have heightened levels of replication stress associated with cell cycle defects and chromosome gaps or breaks, which are due to decreased expression of mini-chromosome maintenance (MCM) helicase components and altered dynamics of DNA replication forks. Nonetheless, old HSCs survive replication unless confronted with a strong replication challenge, such as transplantation. Moreover, once old HSCs re-establish quiescence, residual replication stress on ribosomal DNA (rDNA) genes leads to the formation of nucleolar-associated γH2AX signals, which persist owing to ineffective H2AX dephosphorylation by mislocalized PP4c phosphatase rather than ongoing DNA damage. Persistent nucleolar γH2AX also acts as a histone modification marking the transcriptional silencing of rDNA genes and decreased ribosome biogenesis in quiescent old HSCs. Our results identify replication stress as a potent driver of functional decline in old HSCs, and highlight the MCM DNA helicase as a potential molecular target for rejuvenation therapies.
Both human and mouse HSCs accumulate γH2AX signals with age6,7. This is taken as direct evidence of DNA damage occurring in old HSCs, since phosphorylation of histone H2AX by ATM or ATR upon sensing of DNA breaks is one of the first steps in the canonical DNA damage response (DDR)8. The idea that DNA damage is a driver of HSC ageing is also supported by the age-related functional impairment observed in HSCs isolated from mice deficient in DNA repair pathway components6,9. Accumulation of DNA damage in old HSCs is an attractive hypothesis to explain the propensity of the ageing blood system to acquire mutations10, especially since quiescent HSCs are particularly vulnerable to genomic instability after DNA damage, owing to their preferential use of the error-prone non-homologous end joining (NHEJ) repair pathway11. However, it remains to be established what causes γH2AX accumulation with age, and how it contributes to the functional decline of old HSCs.
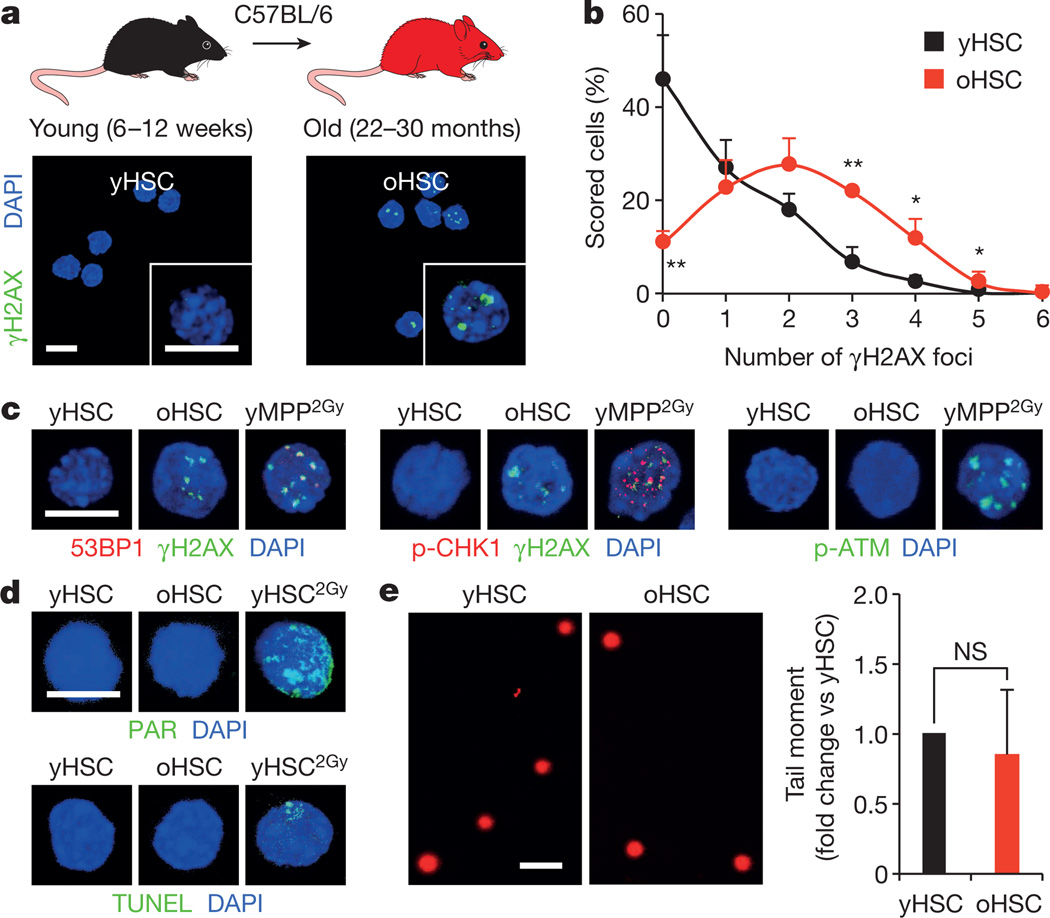
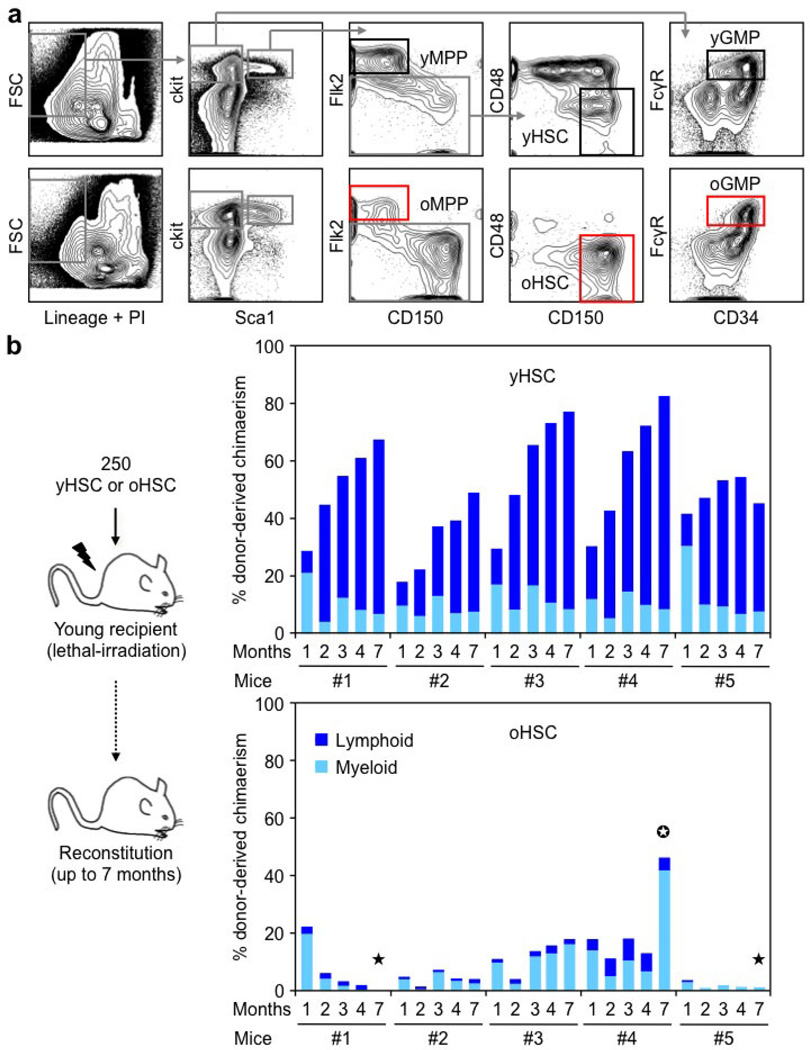
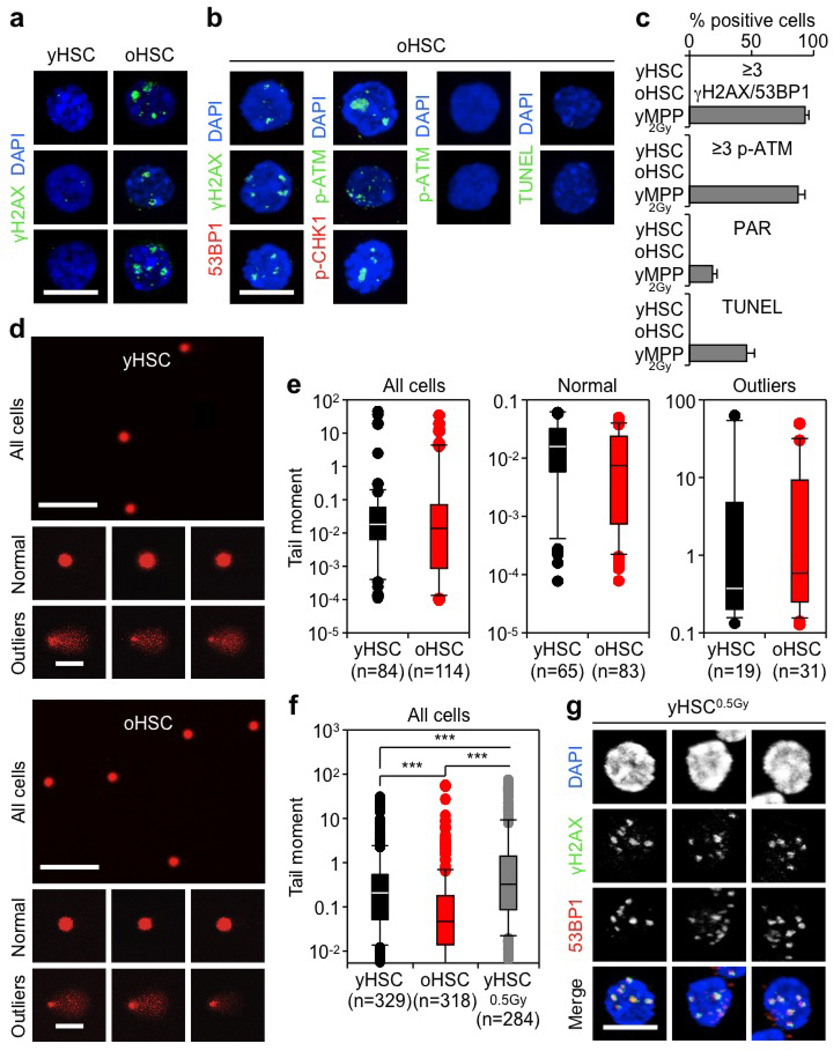
To address these questions, we isolated HSCs as Lin−/cKit+/Sca1+/Flk2−/CD48−/CD150+ cells from the bone marrow of young (6–12 weeks) and old (22–30 months) wild-type C57BL/6 mice (Extended Data Fig. 1a). We confirmed the functional impairment of old HSCs compared with young HSCs, with the expected reduced engraftment, loss of lymphoid potential and early onset of bone marrow failure or myeloid malignancies following transplantation (Extended Data Fig. 1b)2,5. We also confirmed that old HSCs contain more γH2AX signals than young HSCs (Fig. 1a, b and Extended Data Fig. 2a)6. However, we found no evidence of associated co-localization of DNA damage proteins by microscopy, or DNA fragmentation by poly-ADP-ribose (PAR) and TdT-mediated dUTP nick end labelling (TUNEL) staining (Fig. 1c, d and Extended Data Fig. 2b, c). We also performed alkaline comet assays to directly measure the number of DNA breaks and, although both populations showed some very damaged outliers, no statistical difference in mean tail moment was observed between young and old HSCs (Fig. 1e and Extended Data Fig. 2d, e). Importantly, we tested the effect of 0.5 Gy of ionizing radiation on young HSCs, since this dose was estimated to be equivalent to the level of γH2AX signals present in old HSCs6, and observed increased tail moment by comet assay and 53BP1/γH2AX co-localization, hence validating the sensitivity of our assays (Extended Data Fig. 2f, g). We also found that age-associated γH2AX signals were considerably less intense than ionizing-radiation-induced γH2AX foci (Extended Data Fig. 3a), which probably reflects differences in the spread and density of phosphorylated H2AX in each case. Collectively, these results indicate that old HSCs display γH2AX signals without DDR activation or detectable levels of DNA breaks.
Figure 1. Accumulation of γH2AX foci without detectable DNA damage in old HSCs.
a, b, Representative images (a) and quantification (b) of γH2AX foci in young and old HSCs (yHSC and oHSC, respectively). c, d, Representative images of DNA damage markers in young and old HSCs: c, 53BP1 or p-CHK1 recruitment in γH2AX foci and p-ATR activation; d, PAR detection and TUNEL staining. 2 Gy irradiated cells (yMPP2Gy and yHSC2Gy) are included as positive controls. e, Representative images of young and old HSCs analysed by alkaline comet assay and quantification of mean tail moment (n = 4). Results are expressed as fold change compared with young HSCs (set to 1). Scale bars, 10 µm (a, c, d); 90 µm (e). Data are means ± standard deviation (s.d.). *P ≤ 0.05, **P ≤ 0.01. NS, not significant.
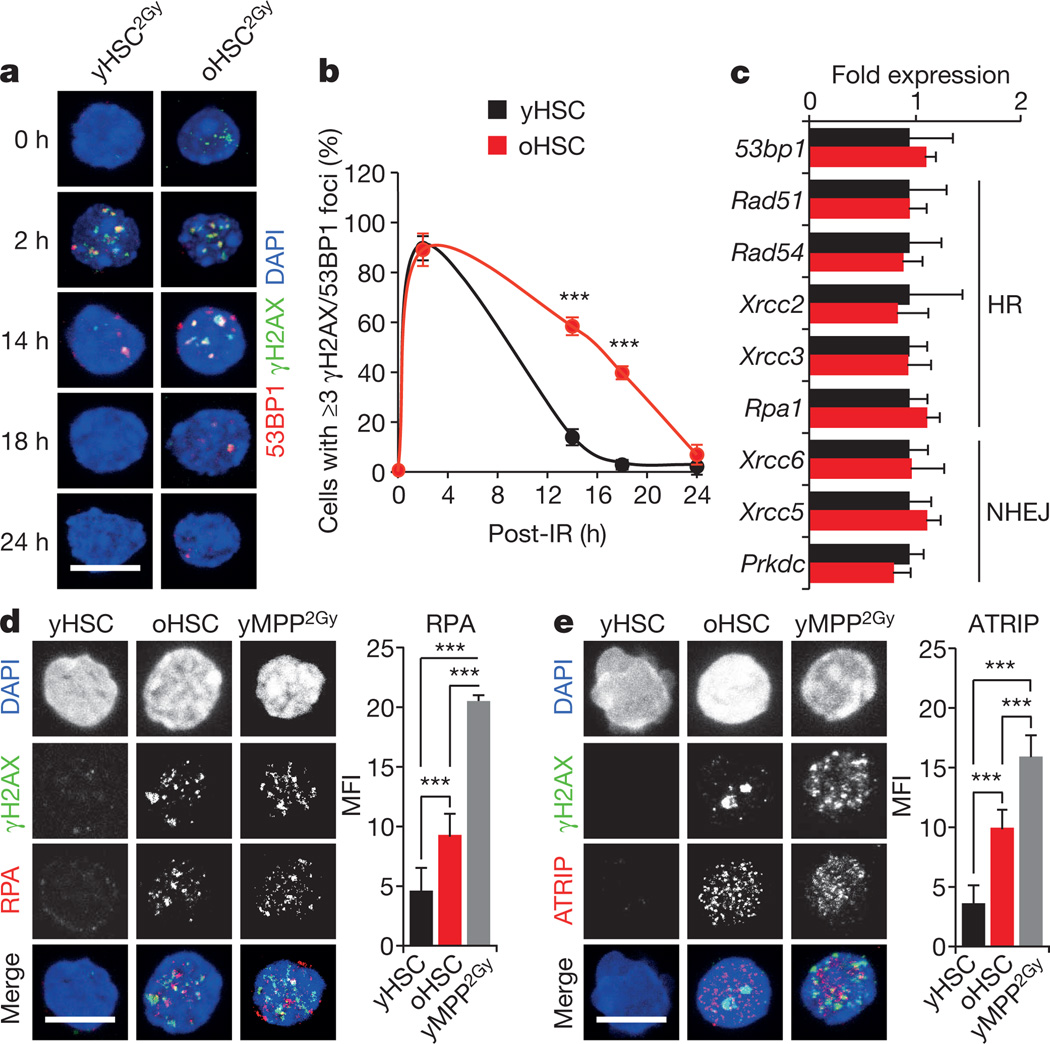
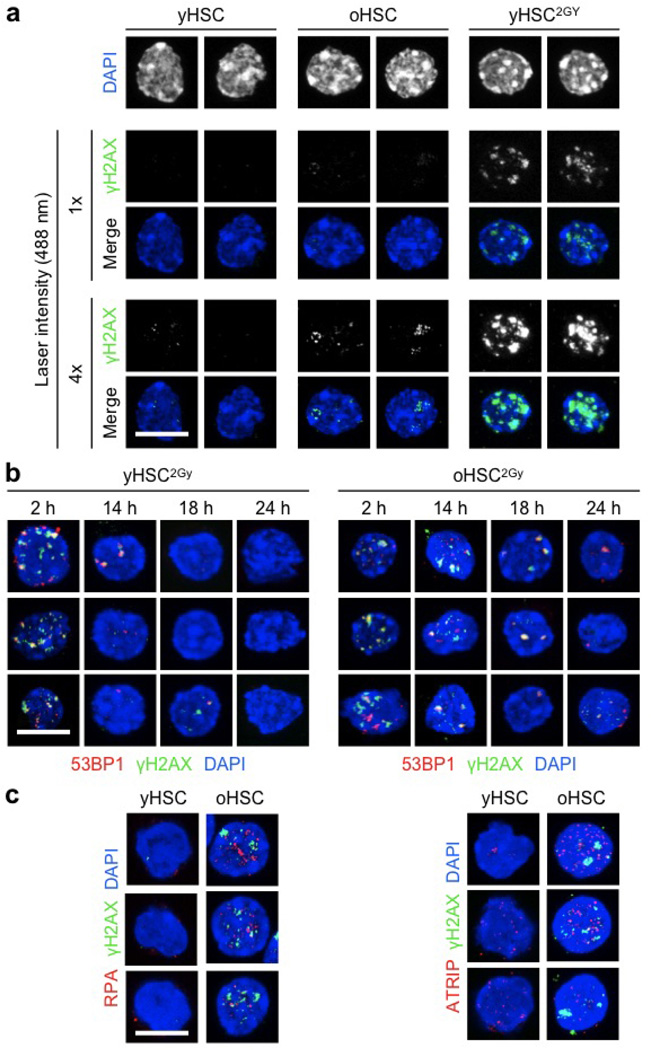
To determine whether old HSCs remain competent for DDR, we exposed young and old HSCs to 2 Gy of ionizing radiation and followed their kinetics of DNA repair by microscopy (Fig. 2a and Extended Data Fig. 3b). In both populations, we observed increased 53BP1-containing γH2AX foci by 2 h after ionizing radiation, followed by their progressive disappearance over time. Although old HSCs showed slower kinetics, both populations had essentially cleared all ionizing-radiation-induced γH2AX foci by 24 h after irradiation (Fig. 2b). In addition, both young and old HSCs expressed equivalent levels of homologous recombination and NHEJ DNA repair genes by quantitative polymerase chain reaction with reverse transcription (qRT–PCR) analyses (Fig. 2c). Altogether, these results demonstrate that old HSCs can activate the DDR and clear ionizing-radiation-induced γH2AX foci as effectively as young HSCs, and suggest that accumulation of γH2AX in old HSCs could be independent of the sensing of DNA breaks. In fact, ATR can also be activated upon sensing interference with DNA replication forks8. Strikingly, we observed increased staining for the single-stranded DNA-binding proteins RPA and ATRIP in old HSCs (Fig. 2d, e and Extended Data Fig. 3c), which suggests that age-associated γH2AX signals could originate from replication stress12.
Figure 2. Efficient DNA repair but persistence of replication stress remnants in old HSCs.
a, b, Representative images (a) and quantification (b) of DNA repair kinetics in 2 Gy irradiated young and old HSCs (yHSC2Gy and oHSC2Gy, respectively; n = 3). IR, ionizing radiation. c, qRT–PCR analyses of HR and NHEJ gene expression in young and old HSCs (n = 4). Results are expressed as fold change compared with young HSCs (set to 1). d, e, Representative images and mean fluorescence intensity (MFI) quantification of RPA (d) and ATRIP (e) staining in young and old HSCs. 2 Gy irradiated cells are included as positive control. Scale bars, 10 µm. Data are means ± s.d. ***P ≤ 0.001.
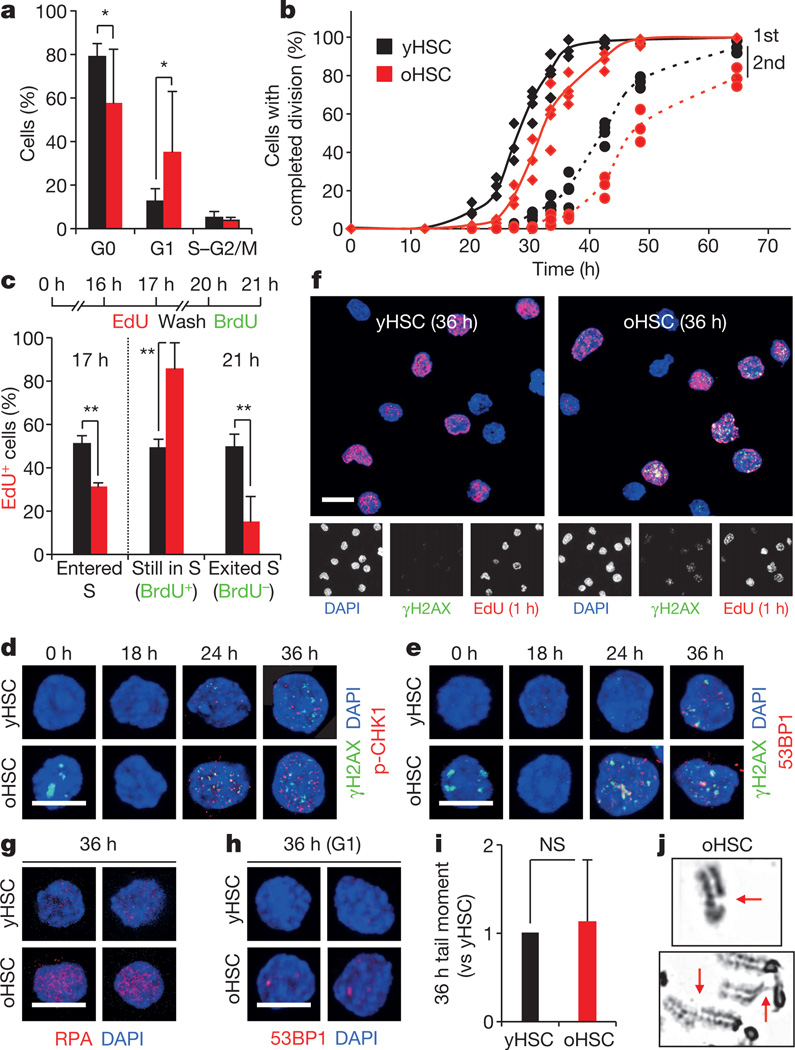
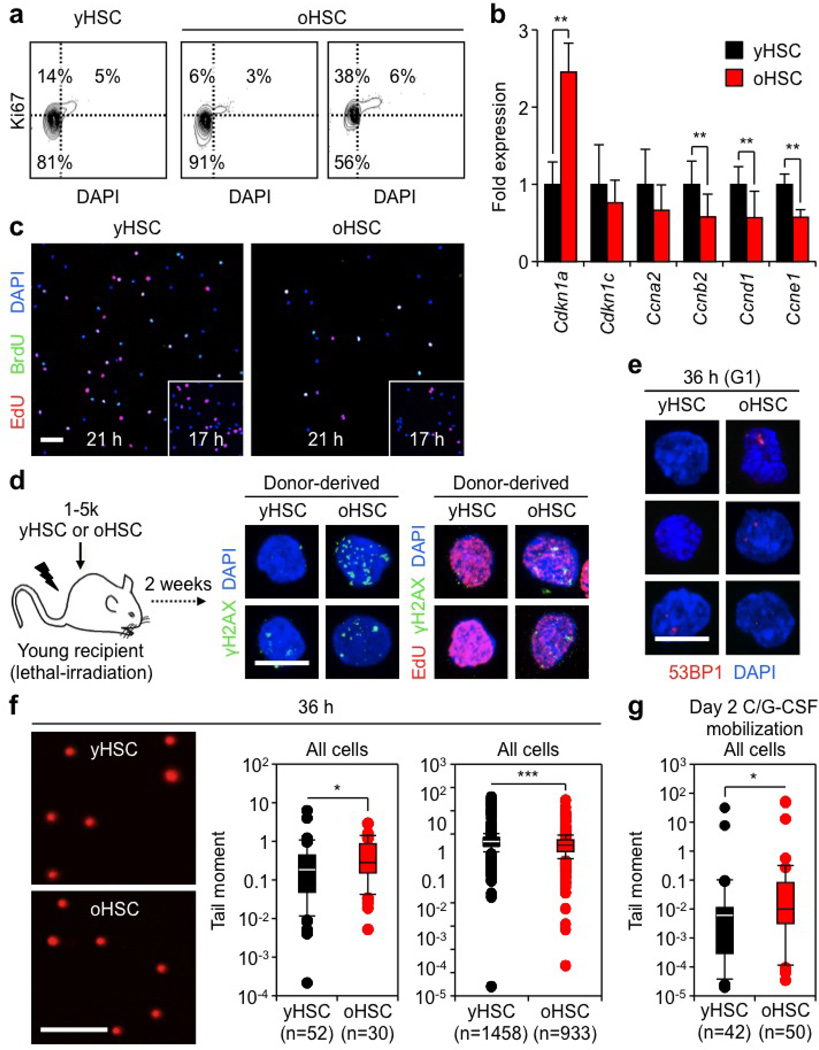
Replication stress is intrinsically linked to cell proliferation, and previous studies have reported a spectrum of findings ranging from increased, decreased, to unchanged proliferation in old HSCs13. In our hands, cell cycle analyses revealed a variable frequency of G0/G1 cells in old HSCs (Fig. 3a and Extended Data Fig. 4a). qRT–PCR analyses of cell cycle genes also indicated enhanced expression of Cdkn1a (p21) and decreased expression of a range of cyclins in old HSCs, which suggest engagement of cell cycle restriction checkpoints (Extended Data Fig. 4b). Moreover, tracking of single-cell division kinetics uncovered a consistent ~4 h delay in the onset of the first division in old HSCs, which was even increased during the second division (Fig. 3b). We directly confirmed that old HSCs had both a delayed entry into S phase and an extended S phase using single 5-ethynyl-2′-deoxyuridine (EdU) and double EdU/5-bromodeoxyuridine (BrdU) incorporation experiments (Fig. 3c and Extended Data Fig. 4c). Collectively, these results demonstrate impaired progression through S phase in cycling old HSCs.
Figure 3. Replication stress in cycling old HSCs.
a, Cell cycle distribution of young and old HSCs (yHSC and oHSC, respectively; n = 8). b, Single cell tracking to measure the kinetics of the first and second cell division in cultured young and old HSCs (n = 3). c, EdU and EdU/BrdU labelling of cycling young and old HSCs (n = 4). d, e, Representative images of γH2AX/p-CHK1 (d) and γH2AX/53BP1 (e) foci in cycling young and old HSCs. f, Representative images of γH2AX/EdU staining in 36 h cycling young and old HSCs. g, h, Representative images of RPA staining (g) and persistent G1-phase 53BP1 bodies (h) in 36 h cycling young and old HSCs. i, Quantification of mean tail moment in 36 h cycling young and old HSCs by alkaline comet assay (n = 4). Results are expressed as fold change compared with yHSCs (set to 1). j, Representative reverse image of DAPI-stained metaphase cell from 5-day-expanded old HSCs showing chromatid gaps (arrows). Scale bars, 10 µm. Data are means ± s.d. *P ≤ 0.05, **P ≤ 0.01, ***P ≤ 0.001. NS, not significant.
DNA replication is often accompanied by γH2AX foci formation at stalled and/or collapsed replication forks, and activation of the DDR to allow normal DNA synthesis14. Strikingly, we found that cycling old HSCs displayed significantly more phosphorylated (p)-CHK1 and 53BP1-containing γH2AX foci than young HSCs, and directly showed γH2AX accumulation in replicating old HSCs using EdU/γH2AX co-staining of both in vitro and in vivo cycling cells (Fig. 3d–f and Extended Data Fig. 4c, d). We also confirmed elevated RPA staining in 36 h cycling old HSCs (Fig. 3g), and persistent 53BP1 bodies in ~60% of old HSCs that had re-entered G1 phase at this time point compared with ~20% of young HSCs (Fig. 3h and Extended Data Fig. 4e)15. Moreover, we observed a trend towards elevated amounts of fragmented DNA detected by alkaline comet assays in cycling old HSCs either cultured in vitro (not significant) or isolated after in vivo mobilization treatment (Fig. 3i and Extended Data Fig. 4f, g). Consistently, 5-day-expanded cultures showed increased numbers of chromosomal gaps and breaks in the progeny of cycling old HSCs (Fig. 3j and Supplementary Table 1). In contrast, karyotyping analyses revealed no evidence of chromosomal deletions and/or translocations (Supplementary Table 1), which usually occur as a consequence of NHEJ-mediated repair of DNA breaks11. Collectively, these results demonstrate heightened levels of replication stress in cycling old HSCs associated with extended S phase and acquisition of chromosomal gaps/breaks. In rare cases, we also observed exacerbated features of replication stress in old HSCs, including senescence with increased senescence-associated β-galactosidase (SA-β-Gal) staining and Cdkn2a (p16) expression, and fragile telomeres with multiple telomeric signals (Extended Data Fig. 5a, b).
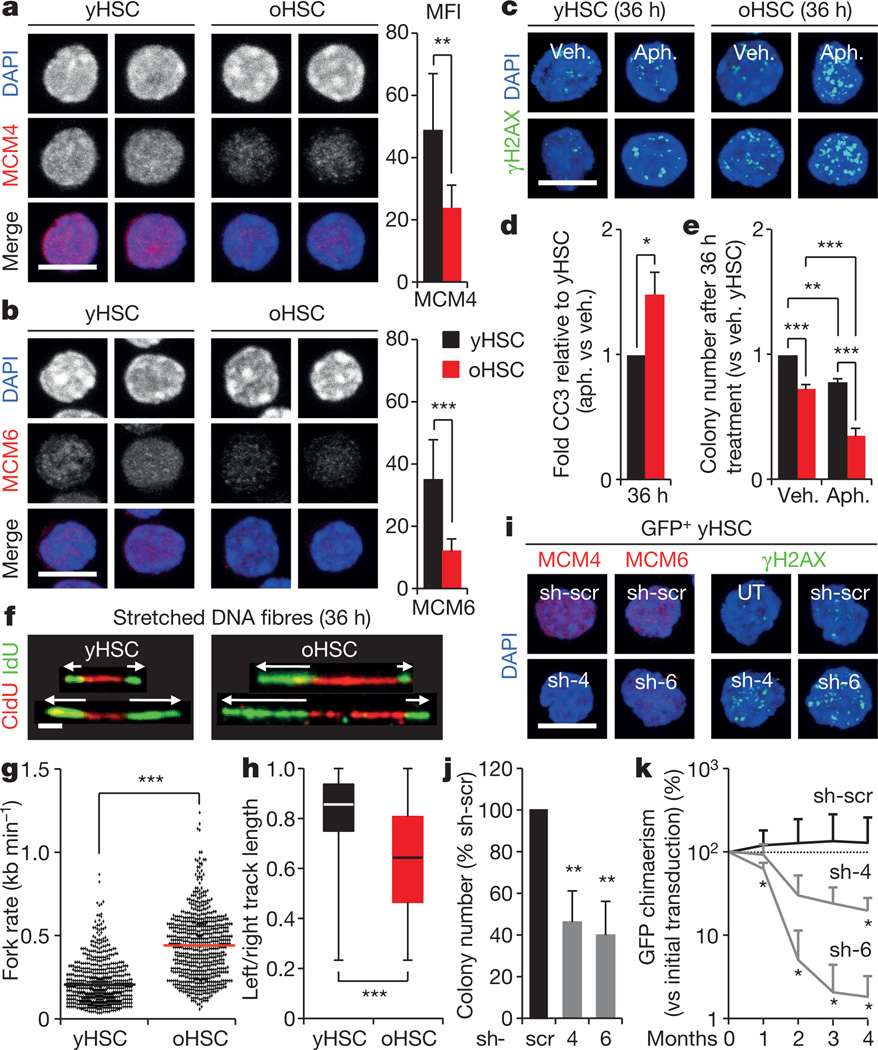
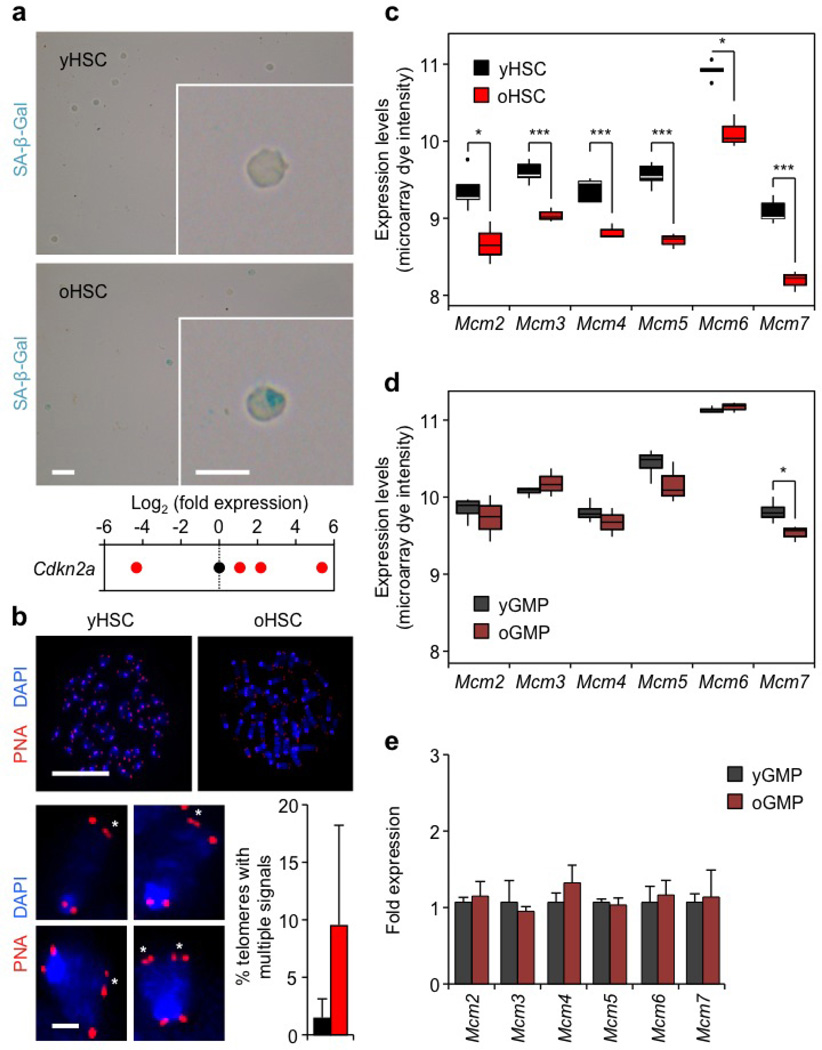
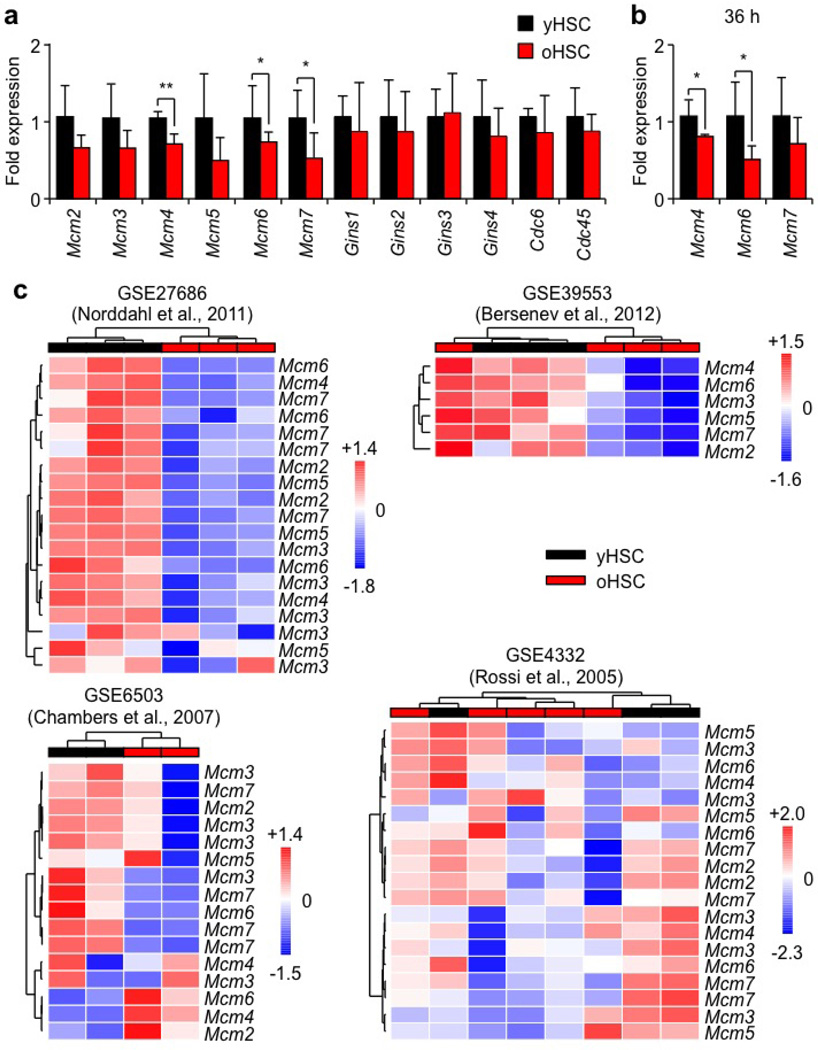
To understand at the molecular level why old HSCs have replication stress, we performed microarray gene expression analyses. We compared both HSCs and granulocyte/macrophage progenitors (GMPs) and subtracted for genes that were differentially expressed between young and old GMPs. This allowed us to identify 913 significantly differentially expressed genes that were specific to old HSCs and segregated into four main clusters (Supplementary Table 2). Among those, we observed a selective downregulation of all MCM genes (Mcm2–7), which encode the six subunits of the MCM DNA helicase (Extended Data Fig. 5c, d)16. Using qRT–PCR, we confirmed unchanged levels of Mcm genes in old GMPs, and significantly decreased expression of at least Mcm4 and Mcm6 in both quiescent and cycling old HSCs (Extended Data Figs 5e and 6a, b). Moreover, we directly demonstrated a ~50% decrease in MCM4 and MCM6 protein levels in quiescent old HSCs (Fig. 4a, b). Interestingly, re-analyses of published data sets also showed decreased Mcm expression in several old HSC samples (Extended Data Fig. 6c). The MCM proteins form a heterohexameric complex that is part of the pre-replication complex assembled at origins of replication during late M/early G1 phases16. At the G1-to-S-phase transition, MCM proteins associate with CDC45 and the go-ichi-ni-san (GINS) complex to form an active helicase that unwinds the DNA at replication forks17. In contrast to MCM proteins, the expression of other pre-replication complex or DNA helicase components was not altered in old HSCs (Extended Data Fig. 6a). Collectively, these results uncovered a specific deficit in MCM proteins in old HSCs.
Figure 4. Defective replication due to reduced MCM expression in old HSCs.
a, b, Representative images and quantification (MFI) of MCM4 (a) and MCM6 (b) protein levels in young and old HSCs (yHSC and oHSC, respectively). c–e, Effect of low-dose aphidicolin (Aph.; 50 ng ml−1) on cultured young and old HSCs (n = 3): c, representative images of γH2AX foci; d, cleaved caspase 3 (CC3) levels; and e, colony counts in methylcellulose after 36 h treatment. Results are normalized for vehicle-treated cells (Veh.) and expressed as fold change compared with young HSCs (set to 1). f–h, Analyses of CldU/IdU-labelled DNA replication tracks in 36 h cycling young and old HSCs (n = 3): f, representative images (arrows indicate fork progression); g, individual fork velocities with means (bars); and h, box plot quantification of fork symmetry ratio. i–k, Lentiviral-mediated knockdown of Mcm4 and Mcm6 in young HSCs (n = 3). Transduced green fluorescent protein (GFP)+ HSCs were re-isolated 48 h post-infection for in vitro analyses, or used without re-isolation 12 h post-infection for transplantation (5 mice per condition): i, representative images of MCM4 and MCM6 protein levels and γH2AX foci; j, colony counts in methylcellulose (results are expressed as fold change compared to scrambled shRNA (sh-scr)-infected HSCs, set to 100%); and k, reconstitution ability upon transplantation (results are percentage of GFP chimaerism normalized to the initial transduction efficiency per construct). UT, untransfected. Scale bars, 10 µm (a–c, i); 2.5 µm (f). Data are means ± s.d. *P ≤ 0.05, **P ≤ 0.01, ***P ≤ 0.001.
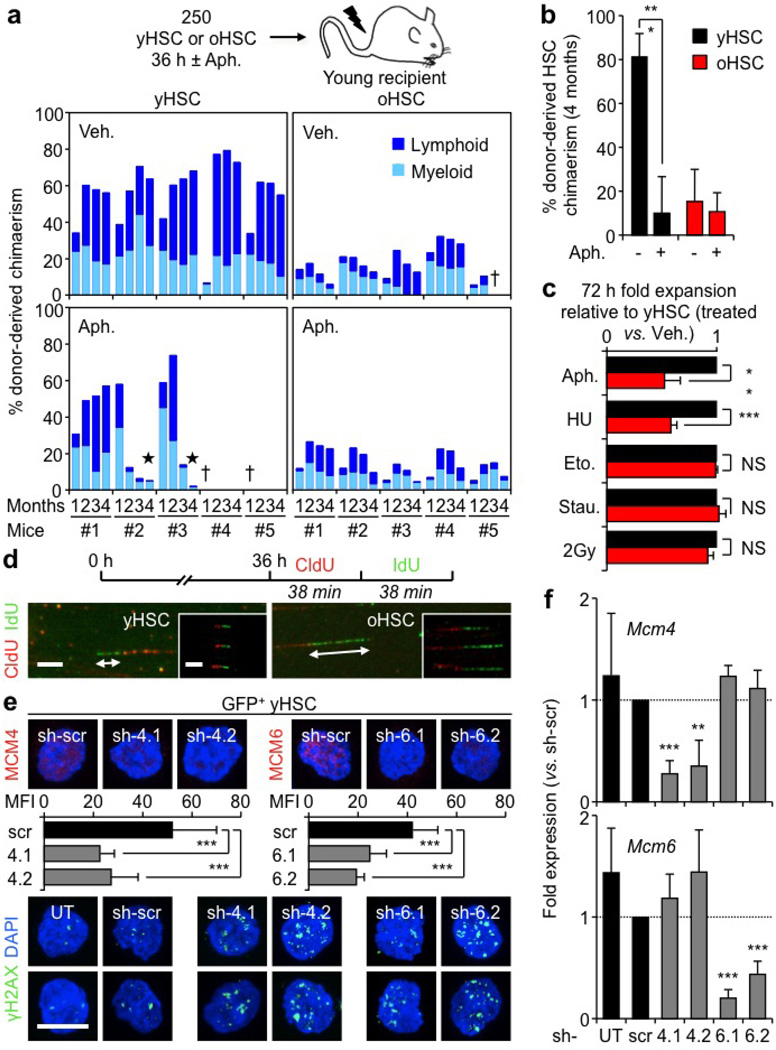
One characteristic of cells with decreased MCM levels is hypersensitivity to replication stressors18. To test the sensitivity of young and old HSCs, we used a low dose of the DNA polymerase inhibitor aphidicolin. While 36 h in vitro aphidicolin treatment only had a modest effect on young HSCs, old HSCs displayed a massive accumulation of γH2AX foci, enhanced apoptosis and severely impaired colony-forming activity upon re-plating in methylcellulose (Fig. 4c–e). However, after transplantation, 36 h aphidicolin-treated young HSCs showed strikingly impaired reconstitution ability, with early onset of bone marrow failure and death, while both treated and untreated old HSCs displayed equally poor transplantability with reduced lymphoid output (Extended Data Fig. 7a). Moreover, the number of engrafted 36 h aphidicolin-treated young HSCs was significantly reduced to levels similar to engrafted old HSCs, either treated or untreated (Extended Data Fig. 7b). These findings demonstrate that induced replication stress severely damages the functionality of young HSCs in a way that resembles age-associated effects, and that transplantation is the ultimate replication challenge for old HSCs. We also confirmed that the differential killing of old HSCs was specific for replication stressors as opposed to non-specific cytotoxic agents (Extended Data Fig. 7c). Collectively, these results demonstrate that replication stress can degrade HSC function, even in young HSCs with a full complement of MCM proteins, and that old HSCs with reduced MCM levels are more susceptible to the killing effect of replication challenges both in vitro and in vivo.
Although MCM proteins are normally present in excess, downregulation of just one component is sufficient to sensitize cells to replication stress by reducing their capacity to activate dormant origins in response to collapsed replication forks18. To directly assess replication at the single-molecule level, we analysed stretched DNA fibres after 5-chloro-2′-deoxyuridine (CldU)/5-iodo-2′-deoxyuridine (IdU) labelling of 36 h replicating young and old HSCs (Fig. 4f and Extended Data Fig. 7d). Strikingly, we observed a significant increase in both replication fork velocity and numbers of asymmetric replication forks in old HSCs (Fig. 4h, g). These altered dynamics are consistent with the replication stress features reported in cells with impaired MCM activity18,19, and probably reflect a reduced number of licensed replication origins leading to an extended S phase in old HSCs. We then used lentiviral vectors containing either Mcm4 or Mcm6 short hairpin RNA (shRNA) to determine the effect of decreased MCM levels on young HSC function. We confirmed ≥50% knockdown both at the messenger RNA and protein levels, associated with accumulation of γH2AX foci, lower colony-forming ability and reduced expansion rates in culture (Fig. 4i, j and Extended Data Figs 7e, f, 8a), hence demonstrating impaired replication in transduced young HSCs. Moreover, transplantation experiments showed decreased reconstitution ability from transduced HSCs (Fig. 4k), which directly confirms that reducing MCM levels strongly impairs young HSC functionality. Collectively, these results reinforce previous data linking decreased MCM levels to impaired stem- and progenitor-cell proliferation20, and identify the deficit in MCM DNA helicase components as the likely cause of the replication stress features of old HSCs.
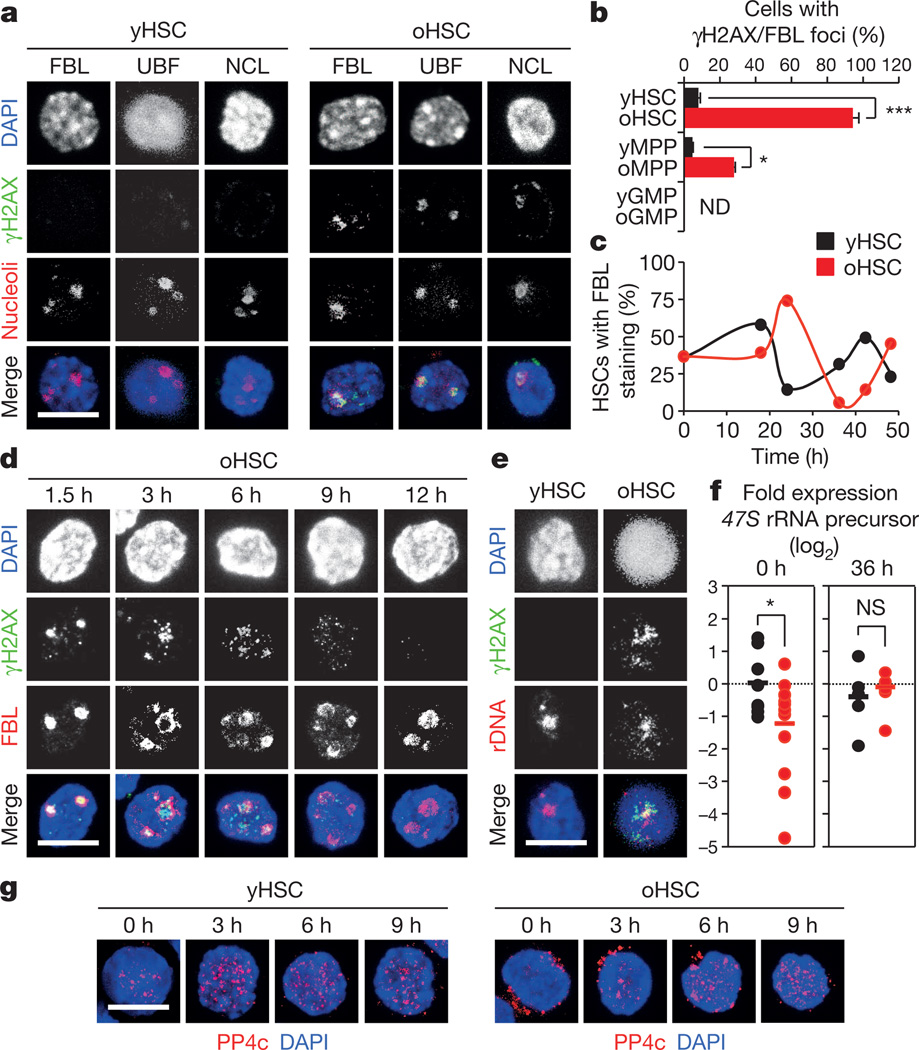
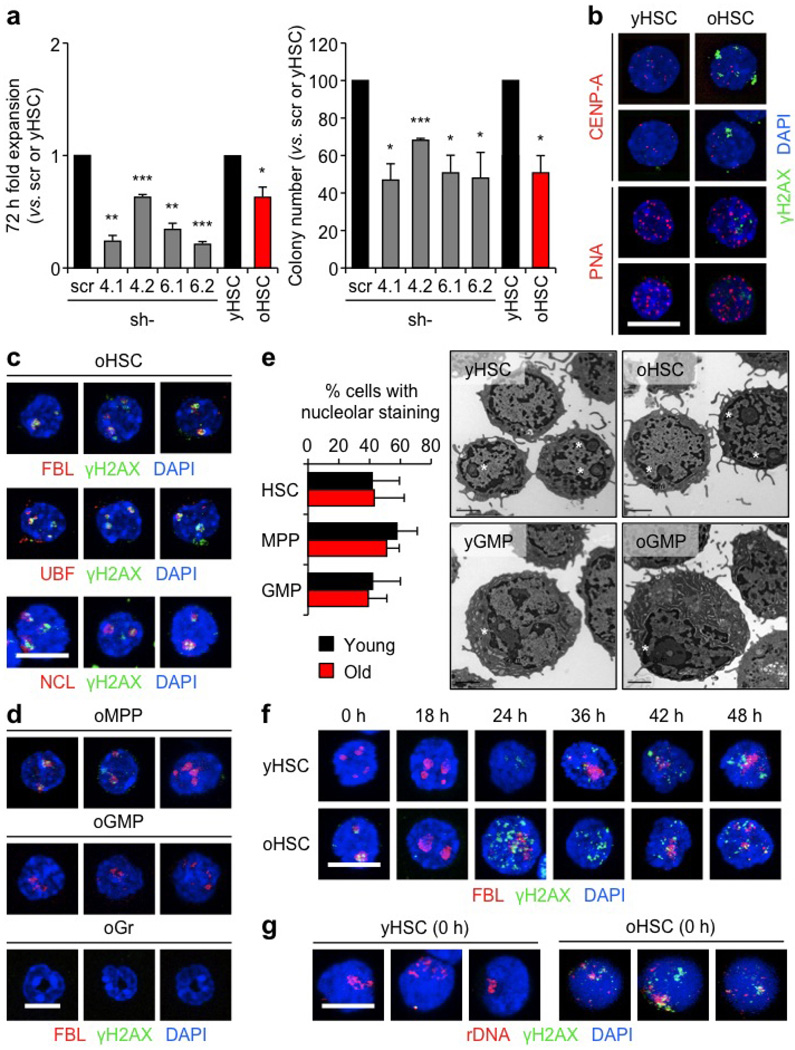
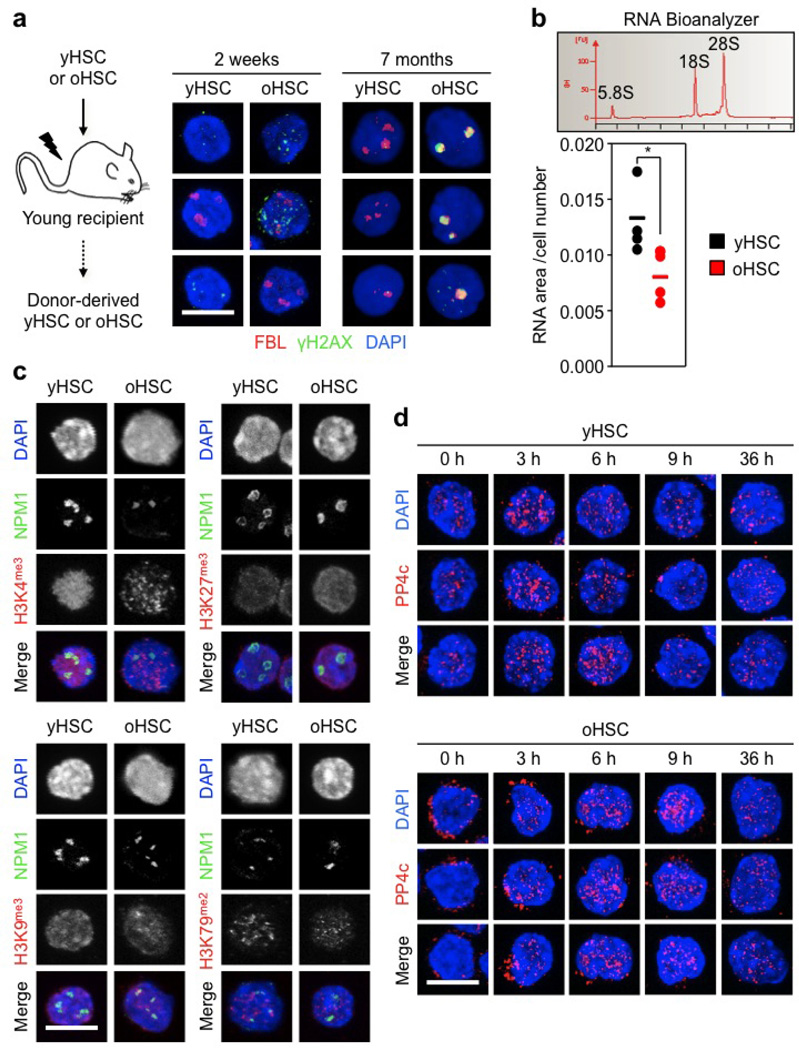
While replication stress provides an explanation for the high levels of γH2AX in cycling old HSCs, it does not account for γH2AX accumulation in quiescent old HSCs. To address this issue, we asked whether γH2AX could mark particular subnuclear structures21. Whereas no colocalization was found with centromeric or telomeric regions, we observed an almost complete co-localization of γH2AX signals with nucleolar markers in quiescent old HSCs (Fig. 5a and Extended Data Fig. 8b, c)22. Although nucleolar γH2AX signals were almost never found in young cells, they were occasionally observed in old multipotent progenitors (MPPs), but not in old GMPs or granulocytes (Fig. 5b and Extended Data Fig. 8d, e). One to five nucleoli can usually be observed per mouse cell, which result from the cell-cycle-dependent assembly of nucleolar organizer regions (NORs) present on four different chromosome pairs in the C57BL/6 mouse background22. As expected, replicating HSCs showed a cyclical dissociation/reformation of nucleolar structures, albeit with slower kinetics in old HSCs (Fig. 5c and Extended Data Fig. 8f). Remarkably, γH2AX signals quickly vanished from the nucleolus in cycling old HSCs even before nucleolar dissociation, and never re-appeared in vitro even after nucleolar reformation (Fig. 5d and Extended Data Fig. 8f). Nucleolar γH2AX signals were also never observed in cycling old HSCs re-isolated 2 weeks after transplantation, but were readily detectable in old HSCs re-isolated 7 months after transplantation, which had, by then, re-entered quiescence (Extended Data Fig. 9a). The nucleolus is primarily the site of ribosome biogenesis, where multiple repeats of rDNA genes present on each NOR are transcribed and then spliced to produce the 18S, 5.8S and 28S rRNA subunits22. We confirmed the presence of γH2AX on rDNA genes in quiescent old HSCs using an immunofluorescence in situ hybridization (FISH) approach (Fig. 5e and Extended Data Fig. 8g). We also found significantly reduced expression of the 47S rRNA precursor transcripts by qRT–PCR in quiescent old HSCs (Fig. 5f), and confirmed decreased ribosome biogenesis in these cells using Bio-analyzer track analyses (Extended Data Fig. 9b). Moreover, we observed restoration of 47S rRNA precursor transcript expression to levels found in young HSCs in cycling old HSCs that had lost nucleolar γH2AX (Fig. 5f). Taken together, these results indicate that nucleolar γH2AX signals are an exclusive feature of quiescent old HSCs, which correlate with decreased ribosome biogenesis and could mark the transcriptional silencing of rDNA genes. In contrast, none of the classic histone methylation marks associated with active or repressed transcription displayed specific nucleolar enrichment in old HSCs (Extended Data Fig. 9c).
Figure 5. Persistent nucleolar γH2AX foci in quiescent old HSCs.
a, Representative images of γH2AX and nucleolar marker co-localization in young and old HSCs (yHSC and oHSC, respectively): fibrillarin (FBL); upstream binding factor (UBF); and nucleolin (NCL). b, Quantification of γH2AX/FBL foci in young and old cells. ND, not detectable. c, Representative kinetics of nucleolar dissociation/reformation in cultured young and old HSCs (n = 3). d, Representative images of FBL/γH2AX staining in cultured old HSCs. e, Representative images of immuno-FISH for γH2AX and rDNA in young and old HSCs. f, qRT–PCR analyses of 47S rRNA precursor transcript expression in quiescent (n = 12) and cycling (n = 8) young and old HSCs. Results are expressed as log2 fold change compared with young HSCs (set to 0). Bars indicate average expression levels. g, Representative images of PP4c staining in cultured young and old HSCs. Scale bars, 10 µm. Data are means ± s.d. *P ≤ 0.05, ***P ≤ 0.001. NS, not significant.
rDNA genes are the most abundant and highly transcribed genes in eukaryotes, which contain many replication origins and are known to challenge the replication machinery23. It is therefore likely that replicating old HSCs accumulate γH2AX on rDNA genes, and we propose that their aggregation during nucleolar reformation causes the appearance of nucleolar-associated γH2AX signals in quiescent old HSCs. Importantly, single-nucleotide polymorphism (SNP) analyses of amplified genomic DNA did not reveal significant differences in rDNA sequences between young and old HSCs (data not shown), which suggests that replication stress has little to no mutagenic consequence for rDNA gene integrity. In addition, we found that PP4c, one of the best-characterized γH2AX phosphatases24, was strikingly mislocalized in quiescent old HSCs. While nuclear PP4c was observed in both quiescent and cycling young HSCs, PP4c was found almost exclusively in the cytoplasm of quiescent old HSCs and only became nuclear when old HSCs re-entered the cell cycle (Fig. 5g and Extended Data Fig. 9d). Nuclear re-localization of PP4c also occurred within the same time window (3–9 h) as disappearance of γH2AX from the nucleolus in cycling old HSCs. Thus, it is conceivable that the long-term persistence of nucleolar γH2AX in quiescent old HSCs results from ineffective H2AX dephosphorylation due to mislocalized PP4c rather than ongoing DNA damage. Although we observed the presence of unrepaired, RPA-coated stretches of single-stranded DNA in quiescent old HSCs, they do not appear to trigger the DDR in these cells, in contrast to what has been described in other contexts25. They might also be the source of the DNA breaks detected by alkaline comet assays in a recent study of quiescent old HSCs26, but again without evidence of an activated DDR. A failure to dephosphorylate H2AX could therefore explain why quiescent old HSCs show persistent γH2AX signals without DDR activation.
Our results demonstrate that replication stress is a potent driver of functional decline in old HSCs, and identify a deficit in MCM helicase components as the molecular mechanism for the impaired replication of old HSCs (Extended Data Fig. 10). It will now be important to understand why expression of Mcm genes decreases with age in HSCs, and whether this could be reversed through direct changes in old HSCs or rejuvenation of the ageing bone marrow niche27. Our results also suggest a non-canonical function for γH2AX as an epigenetic histone modification that marks the silencing of the transcription machinery. This could be a normal mechanism to block transcription in genomic regions undergoing DNA repair, and further studies will address the broad relevance of this novel finding. It will also be interesting to determine whether decreased rDNA gene transcription in quiescent old HSCs plays a part in bone marrow failure syndromes and other age-related blood defects linked to defective ribosome function28. In this context, it will be important to understand why PP4c is mislocalized in quiescent old HSCs, and whether this can be reverted for therapeutic purposes.
METHODS
Mice
Young (6–12 weeks) and old (22–30 months) wild-type C57BL/6 mice of both genders were either bred and aged in house, or purchased from the National Institute on Aging (NIA) aged rodent colonies. For transplantations experiments, 8–12-week-old CD45.1 C57BL/6-Boy/J recipient mice were lethally irradiated (11 Gy, delivered in split doses 3 h apart) and injected retro-orbitally with 250 to 5,000 purified CD45.2 HSCs delivered together with 300,000 Sca1-depleted helper CD45.1 bone marrow cells. Transplanted mice were kept on antibiotic-containing water for 4 weeks and analysed for donor-derived chimaerism by regular bleeding. Peripheral blood was obtained from retro-orbital bleeding, and collected in 4 ml of ACK (150 mM NH4Cl, 10 mM KHCO3) containing 10 mM EDTA for flow cytometry analyses. Cyclophosphamide (C)/ granulocyte colony-stimulating factor (G-CSF) mobilization treatment was performed as previously described11. For mouse studies, no specific randomization or blinding protocol was used, and all experiments were performed in accordance with University of California San Francisco (UCSF) Institutional Animal Care and Use Committee approved protocols.
Flow cytometry
Enrichment and cell staining procedures for isolating HSCs (Lin−/c-Kit+/Sca1+/Flk2−/CD48−/CD150+), MPPs (Lin−/c-Kit+/Sca1+/Flk2+) and GMPs (Lin−/c-Kit+/Sca1−/CD34+/FcγR+) from c-Kit-enriched bone marrow, and granulocytes (Mac-1+/Gr-1+) from unfractionated bone marrow were performed as described29. In brief, HSCs were stained with un-conjugated lineage antibodies (Gr-1, Mac1, B220, CD3, CD4, CD5, CD8, Ter-119; all obtained from the UCSF Hybridoma Core Facility), goat anti-rat-PE-Cy5 (Invitrogen, A10691), c-Kit-APC-eFluor780 (eBioscience, 47-1171-82), Sca1-PB (BioLegend, 108120), Flk2-Bio (eBioscience, 13-1351-82), CD48-Alexa Fluor 647 (BioLegend, 103416), CD150-PE (BioLegend, 115904) and SA-PE-Cy7 (eBioscience, 25-4317-82) antibodies. FcγR-PerCP-eFluor710 (eBioscience, 46-0161-82) and CD34-FITC (eBioscience, 11-0341-85) were eventually included for concomitant isolation of MPPs and GMPs, and granulocytes were stained with Mac-1-PE-Cy7 (eBioscience, 25-0112-82) and Gr-1-PB (eBioscience, 57-5931-82) antibodies. CD45.1-FITC (eBioscience, 11-0454-85) was also included for isolation of donor-derived HSCs following transplantation. Blood chimaerism was analysed using CD45.2-FITC, eBioscience, 12-0453-83), B220-APC-e780 (47-0452-82), Gr-1-PB, Mac-1-PE-Cy7, CD3-e660 (eBioscience, 50-0032-82) and Ter-119-Cy5PE (eBioscience, 15-5921-83) antibodies. Stained cells were re-suspended for final analysis in Hanks buffered salt solution (HBSS) with 2% heat-inactivated fetal calf serum (FCS) and 1 µg ml−1 propidium iodide (PI) for dead cell exclusion. For intracellular Ki67 and 4’,6-diamidino-2-phenylindole (DAPI) staining, 5 × 10⁶ unfractionated BM cells were surface stained for HSC markers as described earlier, fixed in Cytofix/Cytoperm buffer (BD Biosciences, 554714) for 2 h at 4°C, washed in PermWash (BD Biosciences), permeabilized with CytoPerm Plus (BD Biosciences) for 10 min at room temperature, re-fixed in Cytofix/Cytoperm buffer for 10 min at 4°C, washed in PermWash and stained with FITC-conjugated anti-Ki67 (Vector Laboratories) for 1 h at room temperature. Cells were washed in PermWash and resuspended in PBS/2% FCS. DAPI was subsequently added to samples and allowed to incubate for 20 min at room temperature before analysis. Cell isolation was performed on a FACS ARIAII (BD), using double sorting to ensure maximum purity, and cell analysis was performed on a FACS LSRII (BD).
Cell culture
All cell irradiation procedures were performed using a 137Cs source (J. L. Shepherd & Associates Radiation Machinery, M38-1 S.N. 1098). Cells were cultured in Iscove’s modified Dulbecco’s media (IMDM) supplemented with 5% FBS (StemCell Technology, 06200), 1× penicillin/streptomycin, 0.1 mM non-essential amino acids, 1 mM sodium pyruvate, 2 mM l-glutamine and 50 µM 2-mercaptoethanol (base media) and containing the following cytokines (all from PeproTech): IL-3 (10 ng ml−1),GM-CSF (10 ng ml−1), SCF (25 ng ml−1), IL-11 (25 ng ml−1), Flt-3L (25 ng ml−1), Tpo (25 ng ml−1) and Epo (4 U ml−1) (culture media). Aphidicolin (50 ng ml−1; Sigma, A4487), hydroxyurea (100 µM; Sigma, H8627), etoposide (0.25 µM; Sigma, E1383), staurosporine (5 nM; Sigma, S6942) or dimethylsulphoxide (DMSO) (vehicle) were added to the culture media as indicated. All cultures were performed at 37 °C in a 5% CO2 water jacket incubator (Thermo Scientific). For DNase I treatment, cells were fixed with 4% PFA at room temperature, permeabilized in 0.2% Triton X-100 for 2 min at room temperature and incubated with 50U of DNase I (Sigma, D4527) in 3% BSA, 5 mM MgCl2, 2 mM CaCl2, 0.2× PBS for 10 min at 37 °C. For single-cell tracking experiments, cells were sorted directly into 96-well plates (1 cell per 100 µl per well, 96 wells scored per condition), visually inspected after 12 h to confirm successful single-cell sort, and, again, at the indicated time points to establish the kinetics of the first (appearance of 2 or more cells) and second (appearance of 4 or more cells) cell divisions. For EdU incorporation, cells were cultured for 16 h, pulsed for 1 h with 10 µM EdU (Life Technologies, C10339), harvested by 17 h and deposited onto poly-lysine coated slides (Thermo Scientific). For EdU/BrdU incorporation, cells were cultured for 16 h, pulsed for 1 h with 10 µM EdU, washed three times and incubated for 3 h in culture media without thymidine analogues, pulsed for 1 h with 60 µM BrdU (Sigma, B5002), harvested by 21 h and deposited onto poly-lysine-coated slides. For apoptosis assays, cells were sorted directly into 384-well solid white luminescence plates (400 cells per 40 µl per well, triplicate wells per conditions) and analysed after 36 h culture by adding 40 µl of Caspase-Glo 3/7 (Promega) to each well, shaking at 300 r.p.m. for 30 s, incubating for 45 min at room temperature and reading on a luminometer (Synergy2, BioTek) to obtain relative luciferase units (RLU).
Immunofluorescence staining
Cells were either directly sorted or pipetted onto poly-lysine coated slides (500–2,000 cells per slide), incubated for 10 min, fixed with 4% PFA for 10 min at room temperature, permeabilized in 0.15% Triton X-100 for 2 min at room temperature and blocked in 1% BSA/PBS overnight at 4 °C. Slides were then incubated for 1 to 2 h at 37 °C in 1% BSA/PBS with the following antibodies alone or in combination: anti-phospho-H2AX (Ser 139) (Millipore, 05-636), anti-53BP1 (Novus Biologicals, NB100-904), anti-phospho-CHK1 (Ser 345) (Cell Signaling, 2348), anti-phospho-ATM (Ser 1981) (Active Motif, 39529), anti-PAR (BD Pharmingen, 550781), anti-RPA (70 kDa) (Thermo Scientific, PA5-21976), anti-ATRIP (Thermo Scientific, PA1-519), anti-MCM4 and anti-MCM6 (provided by J.M.), anti-FBL (Cell Signaling, 2639), anti-UBF(gift from B. McStay), anti-NCL (Abcam, ab22758), anti-NPM1 (Invitrogen, 32-5200), anti-PP4C (Bethyl Laboratories, A300-835A), anti-CENP-A (Cell Signaling, 2048), anti-H3K9me3 (Abcam, 8898), anti-H3K27me3 (Millipore, 07-449), anti-H3K4me3 (Invitrogen, 49-1005) and anti-H3K79me2 (Abcam, ab3594). Slides were washed three times in PBS and incubated for 1 h at 37 °C in PBS/1% BSA with appropriate secondary antibodies (all from Life Technologies): A488-conjugated goat anti-mouse (A-11029), A594-conjugated goat anti-rabbit (A-11037), A594-conjugated donkey anti-sheep (A-11016) and A488-conjugated donkey anti-mouse (A-21202). Slides were then washed three times in PBS and mounted using VectaShield (Vector Laboratories) containing 1 µg ml−1 DAPI. For γH2AX/PNA immuno-FISH staining, cells were re-fixed with 4% PFA for 5 min after γH2AX staining and then processed for FISH as previously described30. For γH2AX/rDNA immuno-FISH staining, cells were first fixed with ice-cold methanol for 2 min before blocking, then re-fixed with 2% PFA for 5 min after γH2AX staining and processed for FISH according to the manufacturer’s recommendations (FISHTag DNA kit, Molecular Probes, F32949), with a 3 h RNase treatment step at 37 °C replacing the suggested HCl/pepsin treatment before dehydration of the slides. The rDNA FISH probe corresponded to a 11.35 kb EcoRI-EcoRI fragment of the pMr974 mouse rDNA plasmid comprising parts of the non-transcribed spacer, the 50 external transcribed spacer and the majority of the 18S sequence (gift from I. Grummt). TUNEL staining was performed according to the manufacturer’s recommendations (Roche, 11684795910). EdU incorporation was detected using A594-labelled azide click chemistry according to the manufacturer’s instruction (Life Technologies, Click-iT EdU imaging assay, C10339). For EdU/BrdU double labelling, cells were re-fixed with 3.7% PFA for 5 min after EdU labelling, denatured with 2N hydrochloric acid for 30 min at room temperature, washed with borate buffer (100 mM, pH 8.5) for 10 min, and incubated with A488-conjugated anti-BrdU (Life Technologies, B35130) overnight at 4 °C. For EdU/γH2AX double staining, cells were re-fixed with 4% PFA for 5 min after EdU labelling and stained for γH2AX. Images were acquired on a SP5 Leica Upright Confocal Microscope (×10, ×20 or ×63 objective) and processed using the Volocity software (Perkin Elmer v.6.2). A (mean DAPI intensity × nuclear area) cut-off of ≤1,100 was used to identify G1-phase cells in 36 h culture. An average of 150 cells (EdU and EdU/BrdU incorporation assays, persistent G1-phase 53BP1 bodies), 200 cells (γH2AX quantification) and 30 cells (all other immunofluorescence analyses) were scored from at least two independent experiments.
Single-molecule DNA replication analyses
Replication track analyses were adapted from a published protocol31. In brief, cells were cultured for 36 h, pulsed for 38 min with 50 µM CldU (Sigma, C6891), washed twice with IMDM base media, pulsed for 38 min with 250 µM IdU (Sigma, I7125), washed once with IMDM base media, spotted onto glass slides and lysed for 36 min with 10 µl of spreading buffer (0.5% SDS in 200 mM Tris-HCl (pH 7.4) and 50 mM EDTA). Slides were tilted at a 15° angle to allow DNA to spread, fixed in 3:1 volume absolute methanol:glacial acetic acid for 2 min and air-dried. DNA was denatured with 2.5 M HCl for 30 min at room temperature, and slides were rinsed three times in PBS and blocked in PBS/0.1% Triton X-100/1% BSA for 1 h at room temperature. Cells were incubated for 1 h at room temperature with rat anti-BrdU (Abcam, ab6326) and mouse anti-BrdU (Becton Dickinson, 347580) antibodies to detect CldU and IdU, respectively, together with a mouse anti-single-stranded DNA antibody (Millipore, MAB3034) to check for DNA fibre integrity. Slides were washed three times in PBS and incubated for 30 min at room temperature with A488-conjugated goat anti-mouse (Molecular Probes, A-21121), A594-conjugated goat anti-rat (Life Technologies, A-11007) and A647-conjugated anti-mouse IgG2a (Molecular Probes, A-21241) secondary antibodies. Slides were then washed three times in PBS and mounted in Prolong Plus (Invitrogen, P36930). Tracks were imaged on a DM6000 B Leica microscope and fork rate (FR) was calculated based on the length of the IdU tracks measured using ImageJ software and the following formula: FR (kb min−1) = ((2.59 (kb µm−1) × length (µm))/pulse time (min)). At least 300 replication tracks were analysed per experiment, and 100 origins were used to calculate fork symmetry ratios.
Gene expression
Total RNA was isolated from 1–2 × 10⁴ cells sorted directly into TRIzol-LS (Invitrogen) according to the manufacturer’s protocol. Bioanalyzer chips were used to control for RNA quality and quantify RNA by dividing the area under the curve by the total cell number. For qRT–PCR, RNA was treated with DNase I and reverse-transcribed using SuperScript III kit and random hexamers (Invitrogen). Runs were performed on a 7900HT Fast Real-Time PCR System (Applied Biosystems) using SYBR Green reagents (Applied Biosystems) and the cDNA equivalent of 200 cells per reaction. Sequences for qRT–PCR primers were: Ccna2, forward, CAGCATGAGGGCGATCCTT; reverse, GCAGGGTCTCATTCTGTAGTTTATATTCT (NM_009828); Ccnb2, forward, GCATCATGGACCGGTTCCT; reverse, TCCCGACCACCTGCAGTTT (NM_172301); Ccnd1, forward, TGTTACTTGTAGCGGCCTGTTG; reverse, CCGGAGACTCAGAGCAAATCC (NM_007631); Ccne1, forward, GCAGCGAGCAGGAGACAGA; reverse, GCTGCTTCCACACCACTGTCTT (NM_007633); Cdc6, forward, CTACCTTTCTGGCGCTCCT; reverse, GGATTTAAAGCCTTTTACTTCCTTC (NM_011799.2); Cdc45, forward, AGTTCCTGGACGCTCTTGTG; reverse, GGAAAAGGAGGTCACTTCTGG (NM_009862.2); Cdkn1a, forward, TTCCGCACAGGAGCAAAGT; reverse, CGGCGCAACTGCTCACT (NM_007669); Cdkn1c, forward, CAGCGGACGATGGAAGAACT; reverse, CTCCGGTTCCTGCTACATGAA (NM_009876); Cdkn2a, forward, CCCAACGCCCCGAACT; reverse, GTGAACGTTGCCCATCATCA (NM_001040654); Gins1, forward, ATGAGGACGGACTCAGACAAG; reverse, TCCAGCTGACTTGGCTTCAT (NM_027014.1); Gins2, forward, CGGAATGGATGGATGTGG; reverse, GGCACTGGGGTGAATGTC (NM_178856.1); Gins3, forward, ACAGTCCGGAGAATGCAGAT; reverse, GCGGAACCGTCCAATAAAA (NM_030198.3); Gins4, forward, CCTAACTCCTGCAGAGCTCATT; reverse, AGGGGCAAACTTTTCATTCA (NM_024240.6); Mcm2, forward, AGAAGTTCAGCGTCATGCGGAGTA; reverse, CCCAAAGCGGTTGCGTTGATATGT (NM_008564.2); Mcm3, forward, AGGAAGACTCATGCCAAGGATGGA; reverse, TGGGCTCACTGAGTTCCACTTTCT (NM_008563.2); Mcm4, forward, ACAGGAATGAGTGCCACTTCTCGT; reverse, AAAGCTCGCAGGGCTTCTTCAAAC (NM_008565.3); Mcm5, forward, CTGGATGCTGCTTTGTCTGGCAAT; reverse, TGTGTTCAGACACCTGAGAGCCAA (NM_008566.2); Mcm6, forward, GGACCAAGTTGCTATTCA; reverse, ATTCAGAGTTGCCTTCAC (NM_008567.1); Mcm7, forward, CCCTGCCCAATTTGAACCTTTGGA; reverse, TCTCCACATATGCTGCGGTGATGT(NM_008568.2); Prkdc, forward, GCCCATGAGCTTAGGTTTCAAT; reverse, CTAAGAGCTTTCAGCAGGTTCACA (NM_011159.2); Rad51, forward, AAGTTTTGGTCCACAGCCTATTT; reverse, CGGTGCATAAGCAACAGCC (NM_011234.4); Rad54, forward, CCAGGTCCAGGAGTGTTTCC; reverse, GGCCGGTTGAGTAGCTGAGT (NM_009015.3); Rpa1, forward, ACATCCGTCCCATTTCTACAGG; reverse, CTCCCTCGACCAGGGTGTT (NM_026653.1); Xrcc2, forward, GGAAAGGCCCACATGTGAGT; reverse, GGATCGTTTGTGACATAGGCATT (NM_020570.2); Xrcc3, forward, CCTGAGGAGCTGATCGAGAAGA; reverse, CGGCCGCGTGTTCAAT (NM_028875.2); Xrcc5, forward, GACTTGCGGCAATACATGTTTTC; reverse, AAGCTCATGGAATCAATCAGATCA (NM_009533); Xrcc6, forward, GGAGTCAAGCAAGCTGGAAGA; reverse, AGAACTCGCTTTTTGGTCTCCTT (NM_010247.2); 47S rRNA, forward, CTCTTAGATCGATGTGGTGCTC; reverse, GCCCGCTGGCAGAACGAGAAG (BK000964); 53bp1, forward, TACAGCCCGGTAAAGGTATCCAT; reverse, CTGGACGGCCGGTCTTC (NM_013735.3); Actb, forward, GACGGCCAGGTCATCACTATTG; reverse, AGGAAGGCTGGAAAAGAGCC (NM_007393). Values were normalized to Actb expression. For microarray analyses, RNA was purified using Arcturus PicoPure (Applied Biosystems) with RNase-free DNase (Qiagen), amplified, labelled, and fragmented using NuGEN Ovation Pico linear amplification kits (Nugen Technologies) and hybridized onto mouse Gene ST 1.0 arrays (Affymetrix). Microarray data were analysed using the limma package (v. 3.12.3) for the R programming language (v. 2.15.1) and fitted with a zero-intercept linear model with age (young versus old) and cell type (HSCs versus GMPs) as coefficients32.Genes that were significantly differentially expressed between young and old HSCs, but not between young and old GMPs, were extracted and submitted to hierarchical clustering with Euclidean distance and Ward’s linkage. Four clusters of genes were defined and analysed with conditional GO-term enrichment using the GOstats package (v. 2.22.0) (Supplementary Table 2). Published data sets for genes differentially expressed in young and old HSCs (gene expression omnibus (GEO) accession numbers GSE27686, GSE39553, GSE6503, GSE32719)3,4,33,34 were re-analysed as follows. Each data set was normalized using Robust Multi-Array Average (RMA) as implemented in the Affymetrix package for the R programming language. Expression measurements for probes mapping to Mcm genes were used in a non-supervised hierarchical clustering using Euclidean distance and Ward’s linkage and plotted as a heatmap.
Lentiviral transduction
Lentiviral-mediated transduction experiments were performed as described35. Briefly, pGFP-C-shLenti vectors containing shRNA targeting murine Mcm4 (TL514127) and Mcm6 (TL510769) genes or non-targeting scrambled shRNA (TR30021) were purchased from Origene. Four independent shRNA constructs were purchased and tested for each gene. Lentiviral supernatants were produced by the UCSF Lentiviral Core Facility with titres ranging from 2.2 to 4.3 × 10⁸ infectious particles per ml. Cells were left to recover in IMDM base media for 1–2 h post-sort and spin-infected for 90 min (2,000g, 37 °C) with 1:25 dilution of lentiviral supernatants. After 3 h recovery at 37 °C in a 5% CO2 water jacket incubator, the medium was replaced with cytokine-containing IMDM culture media and cells were cultured for 48 h before re-isolation of live PI−/GFP+ transduced cells for in vitro experiments, or for 12 h for transplantation experiments.
Comet assay
Alkaline comet assays were performed as described36. Briefly, 8 × 10³ cells diluted in 0.4 ml of PBS were added to 1.2 ml of 1% low-gelling-temperature agarose (Sigma) and transferred onto slides also pre-coated with 1% low-gelling-temperature agarose. Cells were lysed in alkaline lysis solution (1.2 M NaCl, 100 mM Na2EDTA, 0.1% sodium lauryl sarcosinate, 0.26 M NaOH (pH > 13)) overnight at 4 °C. Slides were then washed three times with electrophoresis buffer (0.03 M NaOH, 2 mM Na2EDTA (pH ~12.3), and run for 25 min at 0.6 V cm−1. Nuclei were stained with 2.5 µg ml−1 PI in distilled water for 20 min. Pictures of individual cells were taken with a Leica confocal inverted microscope (×10 objective, gain 1) and analysed using the CASP software (http://casplab.com/). The tail moment of all comets analysed was used to define outliers and non-outliers based on calculated absolute deviation. Cells were defined as outliers when their tail moment absolute deviation was ≥3 median absolute deviation (MAD).
Cytogenetic analyses
For metaphase preparation, HSCs were cultured for 5 days, treated for 4 h with 0.01 µg ml−1 Colcemid (Invitrogen), collected in Eppendorf tubes, washed once with PBS, incubated for 8 min at 37 °C in 0.075 M KCl and then fixed in 3:1 volume absolute methanol:glacial acetic acid. Metaphases were analysed by Giemsa staining and spectral karyotyping (SKY) as previously described11, or using the Metasystem’s 21Xmouse probe cocktail and ISIS software for multi-color FISH (M-FISH) according to the manufacturer’s instruction (MetaSystems). An average of 10 to 20 cells were scored per experiment.
Cell biology assays
Standard transmission electron microscopy ultrastructural analyses were performed as previously described29. β-Galactosidase activity was measured using the Senescence β-Galactosidase Staining Kit according to the manufacturer’s instruction (Cell Signaling, 9860).
Statistics
Data were expressed as mean ± s.d. and P values were calculated using a two-tailed Student’s t-test, unless indicated. No specific randomization or blinding protocol was used. For tail moments in comet assays, data were expressed as boxplots with whiskers and P values were calculated pairwise using the Mann–Whitney rank sum test. The Mann–Whitney rank sum test was also used to calculate statistical significance for replication track analyses. For microarray results, data were expressed as boxplots with whiskers and P values were calculated using a two-sided t-test. P values were considered significant when ≤0.05. N indicates the numbers of independent experiments performed and was chosen to ensure adequate statistical power.
Extended Data
Extended Data Figure 1. Isolation strategy and functional impairment of old HSCs.
a, Gating strategy used to isolate HSCs (Lin−/Sca1+/c-Kit+/Flk2−/CD150+/CD48−), MPPs (Lin−/Sca1+/c-Kit+/Flk2+) and GMPs (Lin−/Sca1−/c-Kit+/FcγR+/CD34+) from the bone marrow of young (6–12 weeks) and old (22–30 months) C57BL/6 mice. o, old; y, young. b, Reconstitution ability of young and old HSCs. HSCs were isolated from C57BL/6-CD45.2 donor mice, and transplanted (250 HSCs per mouse) into lethally irradiated young C57BL/6-CD45.1 recipients (n = 5 mice per cell type) together with 300,000 Sca1-depleted CD45.1 helper bone marrow cells. The percentage of donor-derived chimaerism and myeloid (light blue) versus lymphoid (dark blue) reconstitution in the peripheral blood was assessed by flow cytometry at the indicated months post-transplantation. Stars indicate phenotypes resembling age-related blood disorders: black, bone marrow failure; white, myeloproliferative neoplasm.
Extended Data Figure 2. Age-associated γH2AX signals are not associated with markers of DNA damage.
a, Additional images for γH2AX staining in young and old HSCs. b, Additional images for DNA damage markers in old HSCs. c, Quantification of DNA damage marker staining shown in Fig. 1c, d. Results are expressed as per cent of positive cells. d, Representative images of young and old HSCs analysed by alkaline comet assay showing a field view of all cells and examples of normal (<3 MAD) and outliers (≥3 MAD) cells. MAD, median absolute deviation in mean tail moment. e, Mean tail moment for young and old HSCs in one representative alkaline comet experiment. Results are expressed as boxplots with the line marking the median, the box the boundaries of the 25th and 75th percentiles, and the whiskers the 90th and 10th percentiles. f, Mean tail moment for young and old HSCs compared with 0.5 Gy irradiated young HSCs analysed by alkaline comet assay. Results are expressed as boxplots as in e. ***P ≤ 0.001 (pairwise Mann–Whitney rank sum test). g, Representative images of γH2AX/53BP1 foci in 0.5 Gy irradiated young HSCs. Scale bars, 10 µm (a, b, g); 90 µm (magnified cells, 60 µm) (d).
Extended Data Figure 3. Signal intensity, repair kinetics and residual replication stress in old HSCs.
a, Representative images comparing γH2AX signal intensity in unirradiated young and old HSCs, and 2 Gy irradiated young HSCs. Two different intensity settings for the 488 nm laser are used.
b, Additional images for the clearance of γH2AX/53BP1 foci in 2 Gy irradiated young and old HSCs. c, Additional images for γH2AX/RPA and γH2AX/ATRIP staining in young and old HSCs. Scale bars, 10 µm.
Extended Data Figure 4. Consequences of replication stress in cycling old HSCs.
a, Representative FACS plots for Ki67/DAPI intracellular staining in young and old HSCs. Two independent examples of old HSC staining are shown. b, qRT–PCR analyses of cell cycle gene expression in young and old HSCs (n = 5). Results are expressed as fold change compared with young HSCs (set to 1). Data are means ± s.d. **P ≤ 0.01. c, Representative images of 17 h single EdU (insert) and 21 h double EdU/BrdU labelling experiments. d, Schematic and representative images of γH2AX and γH2AX/EdU staining in cycling young and old HSCs re-isolated 2 weeks after transplantation. e, Additional images of persistent 53BP1 bodies in 36 h cycling young and old HSCs that have re-entered G1 following replication. G1-phase cells were identified as cells with mean DAPI intensity × area ≤ 11,000, and represented ~49% (young HSCs) and ~52% (old HSCs) of the population at that time. f, Representative field images and mean tail moment for 36 h cycling young and old HSCs analysed by alkaline comet assay. Results are expressed as boxplots with the line marking the median, the box the boundaries of the 25th and 75th percentiles, and the whiskers the 90th and 10th percentiles. Two independent examples of comet assays are shown. g, Mean tail moment for day 2 cyclophosphamide (C)/G-CSF mobilized young and old HSCs analysed by alkaline comet assay. Results are expressed as boxplots as in f. *P ≤ 0.05, ***P ≤ 0.001 (pairwise Mann–Whitney rank sum test). Scale bars, 100 µm (c); 10 µm (d, e); 90 µm (f).
Extended Data Figure 5. Rare cases of exacerbated replication stress and identification of MCM defect in old HSCs.
a, Representative images of senescence-associated β-galactosidase (SA-β-Gal) staining and qRT–PCR analyses of Cdkn2a (p16) expression levels in young and old HSCs. Results are expressed as log2 fold changes compared with young HSCs (set to 0). Only 2 out of 10 preparations of old HSCs showed SA-β-Gal staining, while only 2 out of 9 preparations of young HSCs and 4 out of 12 preparations of old HSCs had detectable p16 levels. Of note, old HSCs with the highest p16 levels also scored positive for SA-β-Gal staining. b, Representative images of telomere FISH on metaphase spreads of young and old HSCs. Magnified inserts show detection of multiple telomeric signals (asterisks) in old HSCs, and histograms indicate the per cent of all telomeres with multiple telomeric signals per young and old HSCs (7 and 6 cells scored, respectively). Only 2 out of 6 preparations of old HSCs showed multiple telomeric signals. Data are means ± s.d. c, d, Microarray analysis showing differential Mcm gene expression in young and old HSCs (c) and GMPs (d). A total of 5 (young) and 3 (old) independent biological replicates were used for HSCs, and 4 (young) and 3 (old) for GMPs. Results are expressed as boxplots with the line marking the median, the box the boundaries of the 25th and 75th percentiles and the whiskers the ± 1.5 interquartile range. *P ≤ 0.05, **P ≤ 0.01, ***P ≤ 0.001 (two-sided t-test). e, qRT–PCR analyses of Mcm gene expression in young and old GMPs (n = 3–5). Results are expressed as fold change compared with young GMPs (set to 1). Data are means ± s.d. Scale bars, 100 µm; insert, 10 µm (a); 10 µm; magnified cells, 1 µm (b).
Extended Data Figure 6. Specific decrease in Mcm gene expression in old HSCs.
a, b, qRT–PCR analyses of the expression of Mcm genes and other components of the pre-replication complex in quiescent (a) and cycling (b) young and old HSCs (n = 4–5). Results are expressed as fold change compared with young HSCs (set to 1). Data are means ± s.d. *P ≤ 0.05, **P ≤ 0.01. c, Re-analyses of published data sets for Mcm gene expression in old HSCs. Data from GEO accession number GSE27686 (ref. 33): HSCs were defined as Lin−/c-Kit+/Sca1+/CD34−/CD150+ with 3 young (10–12 weeks) and 3 old (100 weeks) samples. Data from GEO accession GSE39553 (ref. 34): HSCs were defined as Lin−/c-Kit+/Sca1+/CD48−/CD150+ with 3 young (2 months) and 4 old (20 months) samples. Data from GEO accession number GSE6503 (ref. 4): HSCs were defined as Lin−/c-Kit+/Sca1+/Hoechst-3342low with 2 young (2 months) and 2 old (21 months) samples. Data from GEO accession number GSE4332 (ref. 3): HSCs were defined as Lin−/c-Kit+/Sca1+/CD34−/Flk2− with 3 young (2–3 months) and 5 old (22–24 months) samples. Results are heatmaps of expression measurements for probes mapping to Mcm genes with non-supervised hierarchical clustering using Euclidean distance and Ward’s linkage.
Extended Data Figure 7. Consequences of replication stress and decreased Mcm expression for HSC function.
a, Effect of replication stress on the reconstitution ability of young and old HSCs. HSCs were isolated from C57BL/6-CD45.2 donor mice, treated with aphidicolin (Aph; 50 ng ml−1) or vehicle (Veh; DMSO) for 36 h in vitro and transplanted (250 HSCs per mouse) into lethally irradiated young C57BL/6-CD45.1 recipients (n = 5 mice per cell type) together with 300,000 Sca1-depleted CD45.1 helper bone marrow cells. The percentage of donor-derived chimaerism and myeloid (light blue) versus lymphoid (dark blue) reconstitution in the peripheral blood was assessed by flow cytometry at the indicated months post-transplantation. Black star indicates bone marrow failure, dagger indicates animal mortality. b, Donor-derived chimaerism in the HSC compartment of the surviving mice at 4 months post-transplantation (n = 3–5). c, Differential killing of young and old HSCs after 72 h treatment. Eto, etoposide (0.25 µM); HU, hydroxyurea (100 µM); Stau, staurosporine (5 nM). Results are normalized for vehicle-treated cells and expressed as fold change compared with young HSCs (set to 1). d, Additional images of CldU/IdU-labelled stretched DNA fibres from replicating young and old HSCs. e, f, Effect of lentiviral-mediated knockdown of Mcm4 and Mcm6 on young HSCs (n = 3): e, additional images for MCM4 and MCM6 protein levels (with MFI quantification) and γH2AX foci; f, qRT–PCR analyses of Mcm4 and Mcm6 expression levels. Transduced GFP+ HSCs were re-isolated 48 h post-infection. Results are expressed as fold change compared with scrambled shRNA (scr)-infected HSCs. Two independent shRNA constructs are used per gene. UT, untransfected. Data are means ± s.d. *P ≤ 0.05, **P ≤ 0.01, ***P ≤ 0.001. NS, not significant. Scale bars, 1.5 µm insert, 3.5 µm (d); 10 µm (e).
Extended Data Figure 8. Replication stress leads to persistence of nucleolar-associated γH2AX signals in quiescent old HSCs.
a, Functional effect of lentiviral knockdown of Mcm4 and Mcm6 on young HSCs, and direct comparison with old HSCs in liquid culture expansion (left) and methylcellulose (right). Transduced GFP+ HSCs were re-isolated 48 h post-infection. Results are expressed as fold change compared with scrambled shRNA (scr)-infected HSCs for transduced HSCs, and young HSCs for old HSCs. Two independent shRNA constructs are used per gene. b, Representative images of γH2AX and centromere marker (CENP-A) staining and immuno-FISH for γH2AX and telomeric PNA probe in young and old HSCs.
c, Additional images for γH2AX and nucleolar marker co-localization in old HSCs. d, Representative images of γH2AX and nucleolar marker colocalization in old MPPs, GMPs and granulocytes (Gr). e, Percentage of young and old cells with nucleolar staining (HSC: 445 and 464; MPP: 485 and 390; GMP: 179 and 223 cells scored, respectively) and representative electron microscopy images of young and old HSCs and GMPs. Data are means ± s.d. White asterisks indicate nucleoli. f, Representative images of γH2AX/FBL staining in cultured young and old HSCs. g, Additional images of immuno-FISH for γH2AX and rDNA probe in young and old HSCs. Scale bars, 10 µm (b, c, d, f, g); 2 µm (e).
Extended Data Figure 9. Decreased ribosome biogenesis and mis-localization of the PP4c phosphatase in quiescent old HSCs.
a, Schematic and representative images of γH2AX/FBL staining in cycling and quiescent donor-derived young and old HSCs re-isolated at the indicated times after transplantation. b, RNA Bioanalyzer track showing the predominant 5.8S, 18S and 28S rRNA peaks, and quantification of RNA content in quiescent young and old HSCs (n = 4). Results are expressed as area under the curve divided by the total number of cells in each sample. Data are means ± s.d. *P ≤ 0.05. c, Representative images of NPM1 (nucleolar marker) and the indicated histone methylation mark in young and old HSCs. d, Additional images of PP4c staining in cycling young and old HSCs. Scale bars, 10 µm.
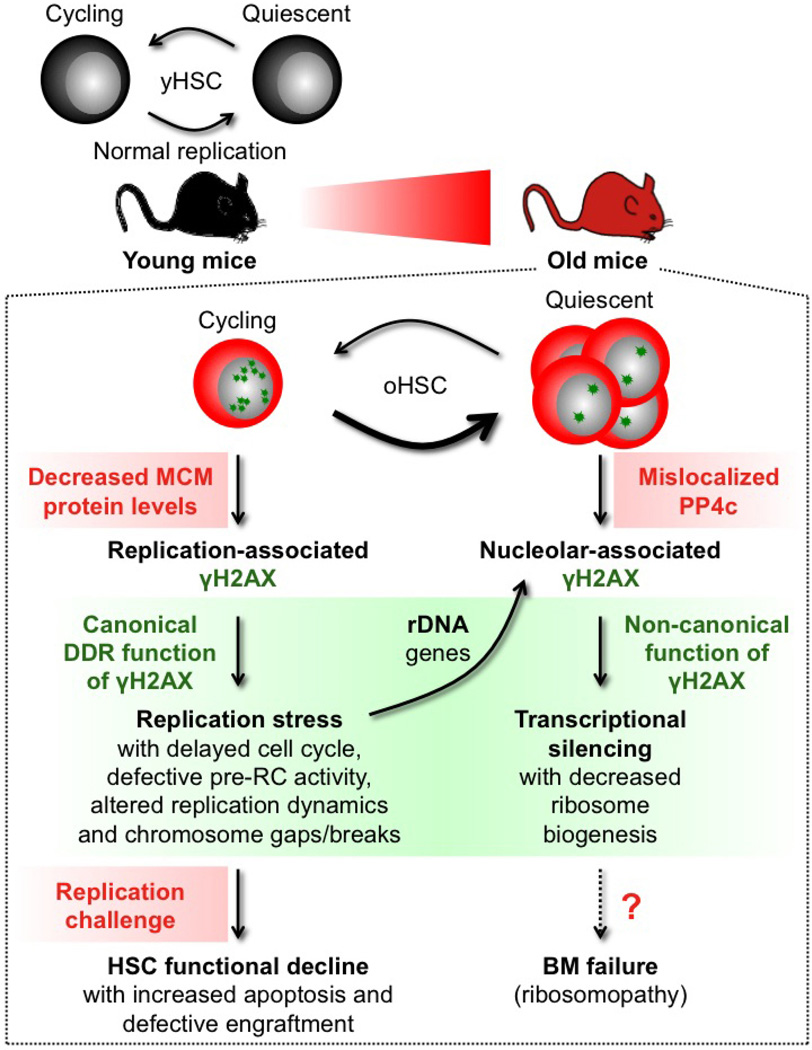
Extended Data Figure 10. Model for replication stress and γH2AX accumulation in old HSCs.
In contrast to HSCs isolated from young mice (yHSC), which replicate normally, HSCs isolated from old mice (oHSC) have severe replication defects due to decreased expression of mini-chromosome maintenance (MCM) DNA helicase components. Cycling old HSCs show heightened levels of replication-associated γH2AX foci (small green stars) and increased levels of replication stress associated with cell cycle defects, altered DNA fork replication dynamics and chromosome gaps/breaks. Nonetheless, old HSCs usually survive replication unless confronted with a strong replication challenge such as treatment with a replication stressor drug or transplantation, which preferentially kill them and lead to their defective engraftment in vivo. Cycling old HSCs are also likely to accumulate γH2AX foci on rDNA genes as a consequence of replication stress occurring at these hard-to-replicate loci during their replication in late S phase. However, stalled or collapsed replication forks appear to be repaired upon activation of the canonical DNA damage response (DDR), resulting in essentially undamaged rDNA genes in old HSCs. In contrast, the clearance of γH2AX foci is probably unfinished by the time old HSCs re-enter quiescence, thereby aggregating leftover γH2AX signals in reformed nucleoli in post-mitotic cells. We propose that ineffective dephosphorylation of γH2AX due to mislocalization of PP4c phosphatase in quiescent old HSCs contributes to the long-term persistence of nucleolar-associated γH2AX signals (large green stars) in the absence of ongoing DNA damage and DDR activation. Persistent nucleolar γH2AX also acts in a non-canonical manner as a histone modification marking the transcriptional silencing of rDNA genes and decreased ribosome biogenesis in quiescent old HSCs. Whether decreased rDNA transcription in quiescent old HSCs is involved in bone marrow (BM) failure syndromes associated with defective ribosome biogenesis (ribosomopathy) remains to be determined. However, as soon as old HSCs re-enter the cell cycle, PP4c is re-localized to the nucleus and quickly dephosphorylates nucleolar γH2AX, thereby restoring ribosome biogenesis. Our results demonstrate that accumulation of γH2AX in old HSCs marks either ongoing or residual replication stress caused by the inability of ageing HSCs to maintain normal levels of MCM proteins. They highlight the MCM DNA helicase as a potential molecular target for rejuvenation therapies.
Supplementary Material
Acknowledgements
We thank A. Brunet and S. Villeda for providing some old C57BL/6 mice, B. McStay for advice on nucleolar analyses, C. Klijn for assistance with microarray analyses, S. Katzman for the SNP analyses, E. Davis for help with cytogenetic studies, I. Grummt for the rDNA plasmid, M. Kissner and M. Lee for management of our Flow Cytometry Core Facility, and all members of the Passegué laboratory for critical insights and suggestions. S.T.B. and M.M. were supported by a California Institute for Regenerative Medicine (CIRM) training grant and E.M.P. by National Institutes of Health (NIH) F32 HL106989. This work was supported by Science Foundation Ireland PI award 10/IN.1/B2972 to C.G.M. and a CIRM New Faculty Award RN2-00934 and NIH R01 HL092471 to E.P.
Footnotes
Online Content Methods, along with any additional Extended Data display items and Source Data, are available in the online version of the paper; references unique to these sections appear only in the online paper.
Supplementary Information is available in the online version of the paper.
Author Contributions J.F. performed all of the experiments with help from S.T.B. for the comet assays and microarray data analyses, E.M.P. for the Ki67/DAPI staining and microarray analyses, and D.R. for the transplantation experiments. M.M. and P.C.C. initiated these studies. S.A. and J.M. performed the DNA replication track analyses and helped with the MCM experiments, M.E.D. and B.A.S. performed the telomere analyses, F.U. and E.C.F. performed the SNP analyses, and M.M.L.B. performed the cytogenetic breakage studies and spectral karyotyping analyses. J.F., C.G.M. and E.P. designed the experiments and interpreted the results. J.F. and E.P. wrote the manuscript.
Data have been deposited in the Gene Expression Omnibus under accession number GSE48893.
The authors declare no competing financial interests.
References
- 1.López-Otín C, Blasco MA, Partridge L, Serrano M, Kroemer G. The hallmarks of aging. Cell. 2013;153:1194–1217. doi: 10.1016/j.cell.2013.05.039. [DOI] [PMC free article] [PubMed] [Google Scholar]
- 2.Rossi DJ, Jamieson CH, Weissman IL. Stems cells and the pathways to aging and cancer. Cell. 2008;132:681–696. doi: 10.1016/j.cell.2008.01.036. [DOI] [PubMed] [Google Scholar]
- 3.Rossi DJ, et al. Cell intrinsic alterations underlie hematopoietic stem cell aging. Proc. Natl Acad. Sci. USA. 2005;102:9194–9199. doi: 10.1073/pnas.0503280102. [DOI] [PMC free article] [PubMed] [Google Scholar]
- 4.Chambers SM, et al. Aging hematopoietic stem cells decline in function and exhibit epigenetic dysregulation. PLoS Biol. 2007;5:e201. doi: 10.1371/journal.pbio.0050201. [DOI] [PMC free article] [PubMed] [Google Scholar]
- 5.Geiger H, de Haan G, Florian MC. The ageing haematopoietic stem cell compartment. Nature Rev. Immunol. 2013;13:376–389. doi: 10.1038/nri3433. [DOI] [PubMed] [Google Scholar]
- 6.Rossi DJ, et al. Deficiencies in DNA damage repair limit the function of haematopoietic stem cells with age. Nature. 2007;447:725–729. doi: 10.1038/nature05862. [DOI] [PubMed] [Google Scholar]
- 7.Rübe CE, et al. Accumulation of DNA damage in hematopoietic stem and progenitor cells during human aging. PLoS ONE. 2011;6:e17487. doi: 10.1371/journal.pone.0017487. [DOI] [PMC free article] [PubMed] [Google Scholar]
- 8.Ciccia A, Elledge SJ. The DNA damage response: making it safe to play with knives. Mol. Cell. 2010;40:179–204. doi: 10.1016/j.molcel.2010.09.019. [DOI] [PMC free article] [PubMed] [Google Scholar]
- 9.Nijnik A, et al. DNA repair is limiting for haematopoietic stem cells during ageing. Nature. 2007;447:686–690. doi: 10.1038/nature05875. [DOI] [PubMed] [Google Scholar]
- 10.Welch JS, et al. The origin and evolution of mutations in acute myeloid leukemia. Cell. 2012;150:264–278. doi: 10.1016/j.cell.2012.06.023. [DOI] [PMC free article] [PubMed] [Google Scholar]
- 11.Mohrin M, et al. Hematopoietic stem cell quiescence promotes error prone DNA repair and mutagenesis. Cell Stem Cell. 2010;7:174–185. doi: 10.1016/j.stem.2010.06.014. [DOI] [PMC free article] [PubMed] [Google Scholar]
- 12.Burhans WC, Weinberger M. DNA replication stress, genome instability and aging. Nucleic Acids Res. 2007;35:7545–7556. doi: 10.1093/nar/gkm1059. [DOI] [PMC free article] [PubMed] [Google Scholar]
- 13.Pietras EM, Warr MR, Passegué E. Cell cycle regulation in hematopoietic stem cells. J. Cell Biol. 2011;195:709–720. doi: 10.1083/jcb.201102131. [DOI] [PMC free article] [PubMed] [Google Scholar]
- 14.Branzei D, Foiani M. Maintaining genome stability at the replication fork. Nature Rev. Mol. Cell Biol. 2010;11:208–219. doi: 10.1038/nrm2852. [DOI] [PubMed] [Google Scholar]
- 15.Lukas C, et al. 53BP1 nuclear bodies form around DNA lesions generated by mitotic transmission of chromosomes under replication stress. Nature Cell Biol. 2011;13:243–253. doi: 10.1038/ncb2201. [DOI] [PubMed] [Google Scholar]
- 16.Méndez J, Stillman B. Chromatin association of human origin recognition complex, Cdc6 and minichromosome maintenance proteins during the cell cycle: assembly of prereplication complexes in late mitosis. Mol. Cell. Biol. 2000;20:8602–8612. doi: 10.1128/mcb.20.22.8602-8612.2000. [DOI] [PMC free article] [PubMed] [Google Scholar]
- 17.Aparicio T, Guillou E, Coloma J, Montoya G, Méndez J. The human GINS complex associates with Cdc45 and MCM and is essential for DNA replication. Nucleic Acids Res. 2009;37:2087–2095. doi: 10.1093/nar/gkp065. [DOI] [PMC free article] [PubMed] [Google Scholar]
- 18.Ibarra A, Schwob E, Méndez J. Excess MCM proteins protect human cells from replicative stress by licensing backup origins of replication. Proc. Natl Acad. Sci. USA. 2008;105:8956–8961. doi: 10.1073/pnas.0803978105. [DOI] [PMC free article] [PubMed] [Google Scholar]
- 19.Zhong Y, et al. The level of origin firing inversely affects the rate of replication fork progression. J. Cell Biol. 2013;201:373–383. doi: 10.1083/jcb.201208060. [DOI] [PMC free article] [PubMed] [Google Scholar]
- 20.Pruitt SC, Bailey KJ, Freeland A. Reduced Mcm2 expression results in severe stem/progenitor cell deficiency and cancer. Stem Cells. 2007;25:3121–3132. doi: 10.1634/stemcells.2007-0483. [DOI] [PubMed] [Google Scholar]
- 21.Lanctôt C, Cheutin T, Cremer M, Cavalli G, Cremer T. Dynamic genome architecture in the nuclear space: regulation of gene expression in three dimensions. Nature Rev. Genet. 2007;8:104–115. doi: 10.1038/nrg2041. [DOI] [PubMed] [Google Scholar]
- 22.Boisvert FM, van Koningsbruggen S, Navascués J, Lamond AI. The multifunctional nucleolus. Nature Rev. Mol. Cell Biol. 2007;8:574–585. doi: 10.1038/nrm2184. [DOI] [PubMed] [Google Scholar]
- 23.Durkin SG, Glover TW. Chromosome fragile sites. Annu. Rev. Genet. 2007;41:169–192. doi: 10.1146/annurev.genet.41.042007.165900. [DOI] [PubMed] [Google Scholar]
- 24.Nakada S, Chen GI, Gingas A-C, Durocher D. PP4 is a γH2AX phosphatase required for recovery from the DNA damage checkpoint. EMBO Rep. 2008;9:1019–1026. doi: 10.1038/embor.2008.162. [DOI] [PMC free article] [PubMed] [Google Scholar]
- 25.Fumagalli M, et al. Telomeric DNA damage is irreparable and causes persistent DNA-damage-response activation. Nature Cell Biol. 2012;14:355–365. doi: 10.1038/ncb2466. [DOI] [PMC free article] [PubMed] [Google Scholar]
- 26.Beerman I, Seita J, Inlay MA, Weissman IL, Rossi DJ. Quiescent hematopoietic stem cells accumulate DNA damage during aging that is repaired upon entry into cell cycle. Cell Stem Cell. 2014;15:37–50. doi: 10.1016/j.stem.2014.04.016. [DOI] [PMC free article] [PubMed] [Google Scholar]
- 27.Rando TA, Chang HY. Aging, rejuvenation, and epigenetic reprogramming: resetting the aging clock. Cell. 2012;148:46–57. doi: 10.1016/j.cell.2012.01.003. [DOI] [PMC free article] [PubMed] [Google Scholar]
- 28.Narla A, Hurst SN, Ebert BL. Ribosome defects in disorders of erythropoiesis. Int. J. Hematol. 2011;93:144–149. doi: 10.1007/s12185-011-0776-0. [DOI] [PMC free article] [PubMed] [Google Scholar]
- 29.Warr MR, et al. FoxO3a directs a protective autophagy program in hematopoietic stem cells. Nature. 2013;494:323–327. doi: 10.1038/nature11895. [DOI] [PMC free article] [PubMed] [Google Scholar]
- 30.Cooley C, et al. Trf1 is not required for proliferation or functional telomere maintenance in chicken DT40 cells. Mol. Biol. Cell. 2009;20:2563–2571. doi: 10.1091/mbc.E08-10-1019. [DOI] [PMC free article] [PubMed] [Google Scholar]
- 31.Terret ME, Sherwood R, Rahman S, Qin J, Jallepalli PV. Cohesin acetylation speeds the replication fork. Nature. 2009;462:231–234. doi: 10.1038/nature08550. [DOI] [PMC free article] [PubMed] [Google Scholar]
- 32.Smyth GK. Linear models and empirical bayes methods for assessing differential expression in microarray experiments. Stat. Appl. Genet. Mol. Biol. 2004;3 doi: 10.2202/1544-6115.1027. Article 3. [DOI] [PubMed] [Google Scholar]
- 33.Norddahl GL, et al. Accumulating mitochondrial DNA mutations drive premature hematopoietic aging phenotypes distinct from physiological stem cell aging. Cell Stem Cell. 2011;8:499–510. doi: 10.1016/j.stem.2011.03.009. [DOI] [PubMed] [Google Scholar]
- 34.Bersenev A, et al. Lnk deficiency partially mitigates hematopoietic stem cell aging. Aging Cell. 2012;11:949–959. doi: 10.1111/j.1474-9726.2012.00862.x. [DOI] [PMC free article] [PubMed] [Google Scholar]
- 35.Will B, et al. Satb1 regulates the self-renewal of hematopoietic stem cells by promoting quiescence and repressing differentiation commitment. Nature Immunol. 2013;14:437–445. doi: 10.1038/ni.2572. [DOI] [PMC free article] [PubMed] [Google Scholar]
- 36.Olive PL, Banath JP. The comet assay: a method to measure DNA damage in individual cells. Nature Protocols. 2006;1:23–29. doi: 10.1038/nprot.2006.5. [DOI] [PubMed] [Google Scholar]
Associated Data
This section collects any data citations, data availability statements, or supplementary materials included in this article.


