

Abstract
Background
Low circulating levels of total vitamin D [25(OH)D] and 25(OH)D3 have been associated with vascular complications in few studies on individuals with type 1 diabetes. However, these measures are affected by UV light exposure. Circulating 25(OH)D2, however, solely represents dietary intake of vitamin D2, but its association with complications of diabetes is currently unknown. We investigated the associations between 25(OH)D2 and 25(OH)D3 and the prevalence of albuminuria, retinopathy and cardiovascular disease (CVD) in individuals with type 1 diabetes.
Methods
We measured circulating 25(OH)D2 and 25(OH)D3 in 532 individuals (40 ± 10 years old, 51 % men) with type 1 diabetes who participated in the EURODIAB Prospective Complications Study. Cross-sectional associations of 25(OH)D2 and 25(OH)D3 with albuminuria, retinopathy and CVD were assessed with multiple logistic regression analyses adjusted for age, sex, season, BMI, smoking, HbA1c, total-HDL-cholesterol-ratio, systolic blood pressure, antihypertensive medication, eGFR, physical activity, alcohol intake, albuminuria, retinopathy and CVD, as appropriate.
Results
Fully adjusted models revealed that 1 nmol/L higher 25(OH)D2 and 10 nmol/L higher 25(OH)D3 were associated with lower prevalence of macroalbuminuria with ORs (95 % CI) of 0.56 (0.43;0.74) and 0.82 (0.72;0.94), respectively. These vitamin D species were not independently associated with microalbuminuria, non-proliferative and proliferative retinopathy or CVD.
Conclusions
In individuals with type 1 diabetes, both higher 25(OH)D2 and 25(OH)D3 are associated with a lower prevalence of macroalbuminuria, but not of retinopathy and CVD. Prospective studies are needed to further examine the associations between 25(OH)D2 and 25(OH)D3 and the development of microvascular complications and CVD in type 1 diabetes.
Electronic supplementary material
The online version of this article (doi:10.1186/s12933-015-0231-2) contains supplementary material, which is available to authorized users.
Keywords: 25-hydroxyvitamin D2, 25-hydroxyvitamin D3, Albuminuria, Cardiovascular disease, Microvascular complications, Retinopathy, Type 1 diabetes, Vitamin D
Background
Vitamin D plays an important role in human health, in particular in bone metabolism [1]. In addition, vitamin D deficiency has been shown to be involved in several pathophysiological processes, such as inflammation [2–4], endothelial dysfunction [5, 6] and up-regulation of the renin-angiotensin-aldosterone system (RAAS) [7], that have been associated with the development of complications of type 1 diabetes [8–10]. In line with this, few observational cohort studies in individuals with type 1 diabetes have shown associations between low 25-hydroxyvitamin D [25(OH)D, which is the sum of 25(OH)D2 and 25(OH)D3] [11, 12] and low 25(OH)D3 [13] on the one hand and microvascular complications [11, 12] and mortality [13] on the other.
Although 25(OH)D3 can be produced after consumption of vitamin D3-containing foods such as meat, egg yolk and fatty fish, vitamin D3-fortified foods and vitamin D3 supplements, it is mainly produced when skin is exposed to UV light [1]. As any disease state is likely to reduce physical activity and thereby UV light exposure and 25(OH)D3 levels, reverse causality is an important limitation of observational studies on the associations between total 25(OH)D or 25(OH)D3 and disease [14]. In contrast, circulating 25(OH)D2 is not directly influenced by exposure to UV light and thus solely represents dietary intake of vitamin D2, mainly from shiitake mushrooms, egg yolk and potentially other foods [1], vitamin D2-fortified foods and from vitamin D2 supplements [1, 15]. It is therefore of interest to specifically investigate and compare associations between the two 25(OH)D metabolites – 25(OH)D2 and 25(OH)D3 – and vascular disease. So far no studies have been published on the associations between circulating 25(OH)D2 and microvascular complications and cardiovascular disease (CVD) in individuals with type 1 diabetes.
We therefore aimed to investigate the associations between both circulating 25(OH)D2 and 25(OH)D3 and the prevalence of microalbuminuria, macroalbuminuria, and non-proliferative and proliferative retinopathy and CVD in a European cohort of individuals with type 1 diabetes.
Methods
Study population
We used data from the EURODIAB Prospective Complications Study, a European based prospective cohort study [16, 17]. In brief, baseline investigations were performed between 1989 and 1991 on 3,250 patients with type 1 diabetes, defined as clinical diagnosis made before the age of 36, and needing continuous insulin therapy within one year of diagnosis. Patients aged 15–60 years were recruited from 31 centres in 16 European countries. Sample selection was stratified by sex, age group and duration of diabetes to ensure sufficient representation in all categories. These patients were invited for a follow-up examination 7–9 years after the baseline examinations. Of the 3,250 included patients, 1,880 (58 %) returned for re-examination. At follow-up, a cross-sectional nested case–control study of markers of inflammation and endothelial dysfunction and their associations with complications was performed in a subset of patients (n = 543). Cases were selected as those with the greatest vascular complication burden as possible (i.e., individuals with CVD or proliferative retinopathy or macroalbuminuria and individuals with microalbuminuria and some degree of retinopathy, n = 348) and controls were selected as those who were completely free of any complications (i.e., with no evidence of CVD, albuminuria and retinopathy; n = 195) [18]. The present study includes 532 of these patients from the cross-sectional case–control study at follow-up in whom plasma samples were available for determination of vitamin D.
Ethics committee approval conformed to the Declaration of Helsinki was obtained at each centre and all participants provided written informed consent.
Measurement of 25-hydroxyvitamin D2 and 25-hydroxyvitamin D3
Concentrations of 25(OH)D2 and 25(OH)D3 were determined with the use of ultra-performance liquid chromatography (UPLC) tandem mass spectrometry (MS) in plasma samples that were stored at −80 °C until analyses.
Two hundred μL plasma was mixed with 200 μL [d3]-25(OH)D3 (50 nmol/L ethanol) and 20 μL perchloric acid (50 %, v/v), 1600 μL hexane was added and samples were centrifuged for 10 min at 14000 rpm at a temperature of 4 °C. The supernatant was dried under a stream of nitrogen and derivatised with 100 μL 4-phenyl-1,2,4-triazoline-3,5-dione (PTAD, 0,1 mg/mL ethylacetate) for 30 min, both at room temperature. Excess PTAD was removed with 400 μL ethanol and the supernatant was then again dried under a stream of nitrogen. The residue was dissolved in 50 μL acetonitrile and 5 μL was injected for analysis by UPLC (Acquity UPLC, Waters, Milford, USA) and detection by tandem MS in ESI positive multiple reaction monitoring (MRM) mode using a Xevo TQ MS (Waters, Milford, USA). Derivatives were separated on a reversed-phase C18 column (Acquity UPLC BEH C18, 100 x 2.1 mm, 1.7 μm) with a binary gradient of 5 mmol/L formic acid and acetonitril at a flow rate of 500 μL/min. The injection volume was 5 μL and column temperature was set at 35 °C. Quantification of 25(OH)D2 and 25(OH)D3 was performed by calculating the peak area ratio of each unlabeled peak area to the peak area of the internal standard [d3]-25(OH)D3. The MRM transitions for 25(OH)D2 and 25(OH)D3 were 570.3 > 298.1 and 558.2 > 298.1, respectively. The MRM transitions for the internal standard [d3]-25(OH)D3 was 561.2 > 301.1. Electrospray ionization was done at a capillary voltage of 1.5 kV, a source temperature of 150 °C and a desolvation temperature of 600 °C.
For validation purposes, linearity was determined by adding standard solution of 25(OH)D2 and 25(OH)D3 to water and plasma. A six-point calibration curve was prepared for 25(OH)D2 (0–79.6 nmol/L) and 25(OH)D3 (0–16.2 nmol/L). The peak area ratio of 25(OH)D2 and 25(OH)D3 multiplied by the concentration of the internal standard were plotted as a function of the concentration. Calibration curves for 25(OH)D2 and 25(OH)D3 were linear over the described ranges (r2 > 0.99) in both water and plasma. Mean slopes (response factors) for 25(OH)D2 and 25(OH)D3 were 0.9594 [coefficient of variation (CV): 6.1 %] and 0.6212 (CV: 14.9 %), respectively. Inter- and intra-assay CVs for concentrations of 25(OH)D2 were 4.6 % and 3.1 % and for concentrations of 25(OH)D2 were 8.9 % and 9.1 %, respectively.
Microvascular complications
The albumin excretion rate (AER) was measured from duplicate 24-h urine collections using an immunoturbidimetric method that included goat anti-human albumin antisera (Sanofi Diagnostics Pasteur, Chaska, MN, USA) and human serum albumin standards (ORHA 20/21 grade HSA; Behring Diagnostics, Hoechst UK, Hounslow, UK) [19]. Microalbuminuria and macroalbuminuria were defined as AER 20–200 μg/min and >200 μg/min, respectively.
Retinopathy was centrally assessed from retinal photographs by a trained reader of colour retinal photographs using a system of 45° field grading standards for the assessment of retinopathy that was developed for the EURODIAB Prospective Complications Study. Non-proliferative retinopathy was defined as the presence of one or more microaneurysms, haemorrhages and/or hard exudates. Proliferative retinopathy was defined as any new vessel, fibrous proliferation, pre-retinal haemorrhage, vitreous haemorrhage or photocoagulation scar [20].
Cardiovascular disease
CVD was defined as a positive medical history of a cardiovascular event, including myocardial infarction, angina pectoris, coronary artery bypass graft and/or stroke, and/or ischaemic changes on a centrally Minnesota-coded ECG [17].
Covariables
Weight and height were measured with indoor clothing without shoes and body mass index (BMI) was calculated as weight divided by height squared. Smoking habits were ascertained by questionnaire and individuals were categorised into never smokers, ex-smokers and current smokers. Glycated haemoglobin (HbA1c) was measured by a latex enhanced turbidimetric immunoassay. Cholesterol levels were measured with colorimetric tests and HDL cholesterol was measured directly. Blood pressure was recorded twice with a random zero sphygmomanometer (Hawskley, Lancing, UK). The glomerular filtration rate (GFR) was estimated using the Chronic Kidney Disease Epidemiology Collaboration (CKD-EPI) equation [21]. Self-reported physical activity was assessed by a questionnaire [22]. The weekly metabolic equivalent (MET-h) corresponds to the weekly amount of time spent in each sporting activity multiplied by the corresponding MET value. Physical activity was then categorized into none, low (≤sex-specific median) and high (>sex-specific median). Alcohol intake was assessed using the general questionnaire and determined by multiplying the weekly intake of each alcoholic beverage by its ethanol content [23]. Alcohol intake was categorized into abstainers, low (≤70 g/week) and high (>70 g/week). We measured plasma levels of C-reactive protein (CRP) with a highly sensitive in-house ELISA [24] and plasma levels of IL-6 and TNF-α with commercially available ELISA kits (R&D Systems, Oxon, UK) [24], as markers of low-grade inflammation. Soluble vascular cell adhesion molecule-1 (sVCAM-1) and soluble E-selectin (sE-selectin) were measured in duplicate by sandwich enzyme immunoassays (R&D Systems, Oxon, UK), as markers of endothelial dysfunction.
Statistical analyses
All statistical analyses were carried out using the Statistical Package for the Social Sciences, version 20.0 (SPSS IBM Corporation, Armonk, NY, USA), unless specified otherwise. General characteristics were compared between tertiles of 25(OH)D2 and, to account for seasonal variation due to UV light exposure, month-specific tertiles of 25(OH)D3 with the use of ANOVA or χ2 tests for continuous and categorical data, respectively. Seven percent (37 individuals) of the total population had missing values for one (n = 30) or more (n = 7) of the covariates. The percentage of missing values per variable varied from 0.2 % (physical activity) to 2.6 % (TNF-α). We used multiple imputation chained equations to impute those missing values rather than perform complete case analyses in order to decrease bias and increase the power of the analyses [25].
We used multinomial logistic regression analyses to investigate the associations between 25(OH)D2 and 25(OH)D3 levels and the prevalence of microalbuminuria and macroalbuminuria, and of non-proliferative and proliferative retinopathy, respectively. Binary logistic regression analyses were performed to investigate the associations between 25(OH)D2 and 25(OH)D3 levels and the prevalence of CVD. All analyses were adjusted for age and sex [and, in the case of 25(OH)D3, season of examination] (model 1) and additionally for BMI, smoking, HbA1c, total-HDL-cholesterol-ratio, systolic blood pressure, use of antihypertensive medication, eGFR, physical activity, alcohol intake, and for prevalent CVD, albuminuria and retinopathy, as appropriate (model 2). We investigated these associations both with 25(OH)D2 tertiles and month-specific 25(OH)D3 tertiles, and with 25(OH)D2 and 25(OH)D3 levels as continuous variables [additionally adjusting for season of examination in the case of 25(OH)D3].
Decreased kidney function may impair the conversion of 25(OH)D into its active form 1,25(OH)2D [1]. We therefore tested for interaction with eGFR, on the multiplicative scale by adding product terms between eGFR and 25(OH)D2 and 25(OH)D3 levels to the fully adjusted models, and on the additive scale by calculating the relative excess risk due to interaction [26].
Lastly, linear regression analyses were conducted to investigate the associations between 25(OH)D2 and 25(OH)D3 and markers of low-grade inflammation (both individually and comprised in an averaged Z-score of CRP, IL-6 and TNF-α) and endothelial function (both individually and comprised in an averaged Z-score of sVCAM-1 and sE-selectin-1) [27]. Furthermore, in the case of significant associations between 25(OH)D2 and 25(OH)D3 and vascular complications, we additionally adjusted these associations for the low-grade inflammation and endothelial dysfunction scores to investigate to what extent these pathophysiological processes explained (i.e., attenuated) these associations.
Results
In the total population, median (IQR) plasma 25(OH)D2 and 25(OH)D3 concentrations were 1.5 (1.0-2.4) nmol/L and 51 (33–74) nmol/L, respectively. Plasma levels of 25(OH)D2 and 25(OH)D3 were not correlated (rS = −0.04, p = 0.363).
Figure 1 shows plasma levels of 25(OH)D2 and 25(OH)D3 across months of examination. Levels of 25(OH)D3, which are dependent on sunlight exposure, differed according to season of examination, whereas levels of 25(OH)D2 did not. We calculated month-specific tertiles of 25(OH)D3 to account for the variation in 25(OH)D3 between seasons and used these in all further analyses with tertiles of 25(OH)D3. Additional file 1: Figure S1 (supplemental material) shows plasma levels of 25(OH)D2 and 25(OH)D3 according to latitude of the study centre. We found no evidence for decreasing levels of 25(OH)D2 or 25(OH)D3 with increasing latitude.
Fig. 1.
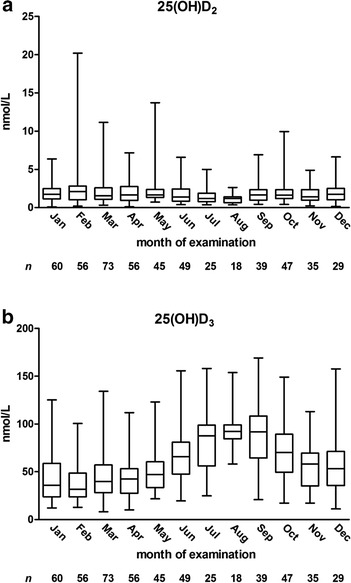
Concentration of 25(OH)D2 (a) and 25(OH)D3 (b) according to month of examination. Boxes indicate medians and interquartile ranges and whiskers represent the minimum and maximum values
Eighty-three and 124 individuals had microalbuminuria and macroalbuminuria, respectively; 146 and 152 individuals had non-proliferative and proliferative retinopathy, respectively, and 131 individuals had CVD.
Population characteristics
Table 1 shows the general characteristics of the EURODIAB Prospective Complications Study population according to tertiles of 25(OH)D2 and month-specific tertiles of 25(OH)D3.
Table 1.
General characteristics of the study population (n = 532) according to tertiles of 25-hydroxyvitamin D2 and month-specific tertiles of 25-hydroxyvitamin D3
| 25-hydroxyvitamin D2 | 25-hydroxyvitamin D3 | |||||
|---|---|---|---|---|---|---|
| T1 (n = 177, 0.08-1.19 nmol/L) | T2 (n = 178, 1.20-2.09 nmol/L) | T3 (n = 177, 2.10-20.2 nmol/L) | T1 (n = 177, 8–86 nmol/L)d | T2 (n = 177, 27–100 nmol/L)d | T3 (n = 178, 43–169 nmol/L)d | |
| Age (years) | 40.5 ± 10.5 | 39.0 ± 9.8 | 39.2 ± 10.0 | 40.9 ± 10.4 | 39.5 ± 10.3 | 38.2 ± 9.4 |
| Male sex (%) | 51 | 47 | 55 | 53 | 52 | 49 |
| Body mass index (kg/m2) | 24.5 ± 3.4 | 24.7 ± 3.1 | 24.3 ± 3.3 | 24.7 ± 3.7 | 24.5 ± 3.1 | 24.2 ± 2.8 |
| HbA1c (%) (mmol/mol) | 8.7 ± 1.7 (72 ± 19) | 8.5 ± 1.7 (69 ± 19) | 8.5 ± 1.5 (69 ± 16) | 9.0 ± 1.8 (75 ± 20) | 8.4 ± 1.5 (68 ± 16) | 8.2 ± 1.5 (66 ± 16) |
| Duration of diabetes (years) | 22.9 ± 9.0 | 20.5 ± 9.7 | 20.9 ± 9.3 | 22.8 ± 9.2 | 22.2 ± 9.9 | 19.4 ± 8.8 |
| Total cholesterol (mmol/L) | 5.4 ± 1.4 | 5.4 ± 1.1 | 5.1 ± 1.1 | 5.4 ± 1.3 | 5.2 ± 1.1 | 5.3 ± 1.2 |
| LDL cholesterol (mmol/L) | 3.2 ± 1.2 | 3.1 ± 1.0 | 3.2 ± 1.0 | 3.2 ± 1.1 | 3.1 ± 1.0 | 3.2 ± 1.1 |
| HDL cholesterol (mmol/L) | 1.6 ± 0.5 | 1.6 ± 0.4 | 1.6 ± 0.4 | 1.6 ± 0.4 | 1.6 ± 0.4 | 1.7 ± 0.4 |
| Total-HDL-cholesterol-ratio | 3.7 ± 1.3 | 3.5 ± 1.4 | 3.3 ± 1.0 | 3.7 ± 1.5 | 3.4 ± 1.1 | 3.3 ± 1.1 |
| Triacylglycerols (mmol/L) | 1.0 (0.8-1.4) | 1.0 (0.7-1.4) | 0.9 (0.7-1.2) | 1.0 (0.7-1.5) | 1.0 (0.8-1.4) | 0.9 (0.7-1.2) |
| Smoking (never/ex/current, %) | 39/32/29 | 39/32/29 | 42/24/34 | 37/28/35 | 42/30/28 | 41/30/29 |
| Physical activity (0/≤mediana/>median, %) | 68/17/15 | 59/20/21 | 60/21/19 | 74/14/12 | 63/20/17 | 50/25/25 |
| Alcohol intake (0/≤70 g per wk/>70 g per wk, %) | 16/53/31 | 19/53/28 | 10/57/33 | 21/53/26 | 13/56/31 | 10/55/35 |
| Systolic blood pressure (mmHg) | 127 ± 22 | 121 ± 19 | 120 ± 18 | 125 ± 21 | 121 ± 20 | 123 ± 18 |
| Diastolic blood pressure (mmHg) | 76 ± 11 | 75 ± 12 | 74 ± 11 | 76 ± 12 | 73 ± 11 | 76 ± 11 |
| Use of antihypertensive medication (%) | 45 | 31 | 19 | 36 | 33 | 26 |
| Use of hormone replacement therapy (% women) | 14 | 11 | 10 | 11 | 8 | 15 |
| Use of oral contraceptive therapy (% women) | 39 | 42 | 47 | 27 | 49 | 50 |
| Estimated glomerular filtration rate (mL/min) | 97 (77–109) | 103 (88–114) | 104 (91–113) | 102 (82–112) | 102 (86–112) | 101 (89–112) |
| C-reactive protein (mg/L) | 1.1 (0.5-2.7) | 1.0 (0.4-2.5) | 1.1 (0.4-2.4) | 1.4 (0.5-3.5) | 0.9 (0.4-2.3) | 0.9 (0.4-2.4) |
| Interleukin-6 (pg/mL) | 2.1 (1.5-4.0) | 1.8 (1.1-3.0) | 1.8 (1.2-3.1) | 2.3 (1.5-4.4) | 1.9 (1.2-3.0) | 1.6 (1.1-2.8) |
| Tumour necrosis factor-α (pg/mL) | 3.2 (2.3-4.6) | 2.7 (2.0-3.3) | 2.6 (2.0-3.2) | 3.1 (2.2-4.3) | 2.7 (2.1-3.5) | 2.7 (2.1-3.4) |
| Low-grade inflammation score (SD)b | 0.27 ± 1.00 | −0.13 ± 0.99 | −0.14 ± 0.97 | 0.26 ± 1.10 | −0.11 ± 0.87 | −0.14 ± 0.97 |
| Soluble E-selectin (ng/mL) | 36 ± 20 | 32 ± 11 | 35 ± 12 | 36 ± 16 | 35 ± 16 | 32 ± 13 |
| Soluble vascular cell adhesion molecule-1 (ng/mL) | 451 ± 174 | 391 ± 97 | 387 ± 98 | 438 ± 169 | 399 ± 106 | 393 ± 103 |
| Endothelial dysfunction score (SD)c | 0.30 ± 1.32 | −0.22 ± 0.74 | −0.08 ± 0.76 | 0.21 ± 1.15 | −0.04 ± 0.97 | −0.17 ± 0.82 |
| Albuminuria (normo/micro/macro, %) | 45/13/42 | 65/17/18 | 73/17/10 | 52/14/34 | 58/20/22 | 74/13/13 |
| Retinopathy (none/non-proliferative/proliferative, %) | 34/30/36 | 49/27/24 | 49/25/26 | 34/33/33 | 44/28/28 | 54/21/25 |
| Cardiovascular disease (%) | 21 | 29 | 24 | 28 | 27 | 20 |
| 25-hydroxyvitamin D2 (nmol/L) | 0.8 (0.6-1.0) | 1.5 (1.4-1.8) | 2.8 (2.4-3.9) | 1.4 (0.9-2.5) | 1.6 (1.1-2.4) | 1.6 (1.1-2.4) |
| 25-hydroxyvitamin D3 (nmol/L) | 46 (28–73) | 58 (37–75) | 49 (33–74) | 27 (21–38) | 48 (39–67) | 77 (62–98) |
Data are presented as means ± SD, medians (interquartile range) or percentages, as appropriate. asex-specific medians for physical activity were 11.3 MET-h/week for men and 6.8 MET-h/week for women; bthe low-grade inflammation score was calculated as the mean Z-score of ln-transformed values of C-reactive protein, interleukin-6 and tumour necrosis factor-α; cthe endothelial dysfunction score was calculated as the mean Z-score of soluble E-selectin and soluble vascular cell adhesion molecule-1; dranges of 25-hydroxyvitamin D3 concentrations overlap between tertiles as tertiles were defined month-specifically (see Methods section)
Individuals with higher 25(OH)D2 and those with higher month-specific 25(OH)D3 concentrations had on average lower values of total-HDL-cholesterol-ratio and markers of low-grade inflammation and endothelial dysfunction compared to those with lower vitamin D concentrations. In addition, they less often used antihypertensive medication and less often had albuminuria and retinopathy.
Finally, those with higher 25(OH)D2 concentrations had on average lower systolic blood pressure, but higher eGFR, whereas individuals with higher month-specific 25(OH)D3 were on average somewhat younger and had lower HbA1c and duration of diabetes, but higher physical activity and alcohol intake (Table 1).
Associations between 25-hydroxyvitamin D2 and albuminuria, retinopathy and cardiovascular disease
Fully adjusted continuous analyses showed that 1 nmol/L higher 25(OH)D2 was non-significantly associated with lower prevalence of microalbuminuria, with an OR (95 % CI) of 0.85 (0.70;1.04), and significantly with macroalbuminuria [0.56 (0.43;0.74)]. Associations between 25(OH)D2 and non-proliferative retinopathy [1.00 (0.85;1.16)], proliferative retinopathy [1.08 (0.93;1.25)] and CVD [1.03 (0.90;1.16)] were not significant (Table 2, model 2). Associations between tertiles of 25(OH)D2 and microvascular complications showed comparable results. However, comparing tertile 2 (T2) vs. T1 of 25(OH)D2, 25(OH)D2 was associated with higher prevalence of CVD [2.22 (1.23;4.01)], whereas T3 vs. T1 was not [1.64 (0.89;3.05)] (Additional file 1: Table S1, model 2).
Table 2.
Associations between 25-hydroxyvitamin D2 levels and prevalent albuminuria, retinopathy and cardiovascular disease
| 25-hydroxyvitamin D2 per 1 nmol/L | ||||
|---|---|---|---|---|
| Model | OR | 95 % CI | p | |
| Microalbuminuria (n = 83) | 1 | 0.94 | 0.81; 1.09 | 0.42 |
| 2 | 0.85 | 0.70; 1.04 | 0.11 | |
| 3 | 0.86 | 0.71; 1.05 | 0.14 | |
| 4 | 0.85 | 0.70; 1.03 | 0.09 | |
| Macroalbuminuria (n = 124) | 1 | 0.45 | 0.35; 0.60 | <0.001 |
| 2 | 0.56 | 0.43; 0.74 | <0.001 | |
| 3 | 0.57 | 0.43; 0.75 | <0.001 | |
| 4 | 0.56 | 0.42; 0.74 | <0.001 | |
| Non-proliferative retinopathy (n = 146) | 1 | 0.91 | 0.80; 1.03 | 0.15 |
| 2 | 1.00 | 0.85; 1.16 | 0.95 | |
| Proliferative retinopathy (n = 152) | 1 | 0.88 | 0.77; 1.00 | 0.06 |
| 2 | 1.08 | 0.93; 1.25 | 0.33 | |
| CVD (n = 131) | 1 | 1.02 | 0.92; 1.14 | 0.70 |
| 2 | 1.03 | 0.90; 1.16 | 0.70 | |
OR, odds ratio indicates the odds of prevalent albuminuria, retinopathy and CVD, per 1 nmol/L higher 25-hydroxyvitamin D2. Model 1: adjusted for age and sex; Model 2: model 1 + BMI, smoking (never, ex, current), HbA1c, total-HDL-cholesterol-ratio, systolic blood pressure, use of antihypertensive medication, eGFR, physical activity (0, ≤sex-specific median, >sex-specific median), alcohol intake (0, ≤70 g/wk, >70 g/wk), and prevalent CVD, albuminuria and retinopathy, as appropriate; Model 3: model 2 + low-grade inflammation score; Model 4: model 2 + endothelial dysfunction score
Associations between 25-hydroxyvitamin D3 and albuminuria, retinopathy and cardiovascular disease
Fully adjusted continuous analyses showed that 10 nmol/L higher 25(OH)D3 was associated with lower prevalence of macroalbuminuria [0.82 (0.72;0.94)], but not with microalbuminuria [0.93 (0.83;1.05)], non-proliferative retinopathy [0.98 (0.87;1.09)], proliferative retinopathy [1.01 (0.90;1.13)] and CVD [1.02 (0.93;1.12)] (Table 3, model 2). Associations between month-specific tertiles of 25(OH)D3 and microvascular complications and CVD showed comparable results (Additional file 1: Table S2, model 2).
Table 3.
Associations between 25-hydroxyvitamin D3 levels and prevalent albuminuria, retinopathy and CVD
| 25-hydroxyvitamin D3 per 10 nmol/L | ||||
|---|---|---|---|---|
| Model | OR | 95 % CI | p | |
| Microalbuminuria (n = 83) | 1 | 0.93 | 0.84; 1.03 | 0.17 |
| 2 | 0.93 | 0.83; 1.05 | 0.26 | |
| 3 | 0.94 | 0.83; 1.06 | 0.30 | |
| 4 | 0.94 | 0.83; 1.06 | 0.30 | |
| Macroalbuminuria (n = 124) | 1 | 0.80 | 0.72; 0.88 | <0.001 |
| 2 | 0.82 | 0.72; 0.94 | 0.003 | |
| 3 | 0.82 | 0.72; 0.94 | 0.005 | |
| 4 | 0.82 | 0.72; 0.94 | 0.005 | |
| Non-proliferative retinopathy (n = 146) | 1 | 0.90 | 0.82; 0.99 | 0.022 |
| 2 | 0.98 | 0.87; 1.09 | 0.66 | |
| Proliferative retinopathy (n = 152) | 1 | 0.90 | 0.83; 0.98 | 0.018 |
| 2 | 1.01 | 0.90; 1.13 | 0.87 | |
| CVD (n = 131) | 1 | 0.99 | 0.91; 1.08 | 0.84 |
| 2 | 1.02 | 0.93; 1.12 | 0.66 | |
OR, odds ratio indicates the odds of prevalent albuminuria, retinopathy and CVD per 10 nmol/L higher 25-hydroxyvitamin D3. Model 1: adjusted for age, sex and season; Model 2: model 1 + BMI, smoking (never, ex, current), HbA1c, total-HDL-cholesterol-ratio, systolic blood pressure, use of antihypertensive medication, eGFR, physical activity (0, ≤sex-specific median, >sex-specific median), alcohol intake (0, ≤70 g/wk, >70 g/wk), and prevalent albuminuria, retinopathy and CVD, as appropriate; Model 3: model 2 + low-grade inflammation score; Model 4: model 2 + endothelial dysfunction score
Additional analyses
Additional adjustment for hormone replacement therapy and/or oral contraceptive therapy did not materially change the results (data not shown).
We found no consistent significant additive or multiplicative interactions between 25(OH)D2 or 25(OH)D3 and eGFR in the associations with microvascular complications and CVD (data not shown).
Additional file 1: Table S3 and S4 show the associations between 25(OH)D2 and 25(OH)D3 levels, respectively, and markers of low-grade inflammation and endothelial dysfunction.
Fully adjusted continuous analyses showed that 1 nmol/L higher 25(OH)D2 was not significantly associated with lower scores of low-grade inflammation and endothelial dysfunction. However, comparing T2 vs. T1 of 25(OH)D2 [−0.239 SD (−0.420;-0.058)] as well as T3 vs. T1 [−0.190 (−0.371;-0.009)], 25(OH)D2 was associated with lower low-grade inflammation. In addition, both 25(OH)D2 T2 vs. T1 [−0.363 (−0.557;-0.170)] and T3 vs. T1 [−0.234 (−0.426;-0.043)] were associated with lower endothelial dysfunction (Table S3, model 2).
Fully adjusted continuous analyses showed that 10 nmol/L higher 25(OH)D3 was inversely associated with lower endothelial dysfunction [−0.040 (−0.073;-0.007)], but not low-grade inflammation [−0.019 (−0.049;0.011)]. In addition, comparing month-specific T2 vs. T1 of 25(OH)D3 [−0.206 (−0.387;-0.024)], but not T3 vs. T1 [−0.131 (−0.317;0.056)], 25(OH)D3, was associated with lower low-grade inflammation and month-specific 25(OH)D3 T3 vs. T1 [−0.215 (−0.416;-0.015)], but not T2 vs. T1 [−0.149 (−0.343;0.046)], was associated with lower endothelial dysfunction (Additional file 1: Table S4, model 2).
We additionally adjusted the associations between 25(OH)D2 and 25(OH)D3 and microalbuminuria and macroalbuminuria for the low-grade inflammation and endothelial dysfunction scores and found that these associations did not materially change after adjustment for low-grade inflammation and endothelial dysfunction (Tables 2 and 3, model 3 and 4, respectively).
Discussion
The present study showed that in individuals with type 1 diabetes, higher circulating 25(OH)D2 as well as 25(OH)D3 were associated with a lower prevalence of macroalbuminuria, but not with retinopathy and CVD. These associations were independent of age, sex, cardiovascular risk factors and markers of low-grade inflammation and endothelial dysfunction and did not differ between individuals with an eGFR below and above 90 mL/min.
The inverse associations between 25(OH)D2 and 25(OH)D3 and macroalbuminuria are in line with a previous prospective study in individuals with type 1 diabetes showing an independent and inverse association between total 25(OH)D and microalbuminuria [11]. Our results extend these previously published results by showing not only associations between 25(OH)D3 and macroalbuminuria, but also similar associations between 25(OH)D2 and macroalbuminuria. Although vitamin D2 and D3 exhibit identical sets of biological responses around the body, primarily through the same vitamin D receptor mediated regulation of gene expression [28], reverse causation due to physical activity and influence of seasonal variation were avoided in these analyses as circulating 25(OH)D2 is not influenced by exposure to UV light. These findings therefore support the association between vitamin D and albuminuria. Other cross-sectional [12] and prospective [13] studies showed no associations between total 25(OH)D [12] or 25(OH)D3 [13] and albuminuria in individuals with type 1 diabetes. Discrepancies between the current findings and these previous findings may be explained by the lower numbers of albuminuria cases in the previous than in the current study. Also, in the study by Joergensen et al. [13], 25(OH)D3 was categorized and vitamin D deficiency was accordingly defined as less than or equal to the lowest 10th percentile of 25(OH)D3 concentration. However, seasonal variation was not adjusted for, which could have resulted in misclassification of vitamin D deficient patients (i.e., possibly incorrectly classifying more patients as vitamin D deficient in winter than in summer), thereby masking potential associations. The single study that showed no association between total 25(OH)D and albuminuria in the general population [29] was also not adjusted for seasonal variation, which may explain the lack of association. In addition, independent and inverse associations between total 25(OH)D and albuminuria have been found in individuals with type 2 diabetes [30, 31] and in the general population [32–34], which further support our current findings in individuals with type 1 diabetes.
We found no independent associations between 25(OH)D2 and 25(OH)D3 and retinopathy. The significant age- and sex-adjusted associations between both 25(OH)D2 and 25(OH)D3 and proliferative retinopathy attenuated and became non-significant after adjustment for other potential confounders (Table 2 and 3), in particular after adjustment for albuminuria status (data not shown). Associations with albuminuria and retinopathy are difficult to tease apart as these disease states strongly correlate with each other. We therefore cannot exclude any direct associations between both 25(OH)D2 and 25(OH)D3 and proliferative retinopathy. In a previous cross-sectional study on individuals with type 1 diabetes, total 25(OH)D has been associated with a lower prevalence of retinopathy [12], a finding that could not be confirmed in another prospective study however [13]. In individuals with type 2 diabetes results have also been conflicting as, similarly, both inverse [31, 35] and no independent associations [35, 36] have been described between total 25(OH)D and prevalence of retinopathy.
The present study did not show a continuous inverse association between 25(OH)D2 and 25(OH)D3 and CVD. Only individuals in the 2nd tertile, but not those in the 3rd tertile of 25(OH)D2, compared to those in the 1st tertile, had a higher prevalence of CVD, which may reflect a chance finding. In the general population, the inverse association between 25(OH)D and CVD has been extensively described in meta-analyses [as summarized in [37]], whereas no studies have been published on the associations between total 25(OH)D, 25(OH)D2 or 25(OH)D3 and prevalent or incident CVD in type 1 diabetes. Larger, prospective studies are needed to further examine the associations between total 25(OH)D, 25(OH)D2 and 25(OH)D3 and the development of retinopathy and CVD in type 1 diabetes.
Potential mechanisms
Vitamin D receptors are present on a large variety of cell types, including most immune cells and vascular endothelial cells [38]. Overall, 1,25(OH)2D controls inflammatory and immune responses, keeping them within physiological boundaries [39]. In addition, vitamin D improves endothelial cell function, regulating endothelial cell-dependent vasodilation [5, 6]. Furthermore, the processes of (low-grade) inflammation and endothelial dysfunction have been associated with vascular complications in individuals with type 1 diabetes [8, 9] and we therefore hypothesized that the associations between 25(OH)D2 and 25(OH)D3 could be explained by these pathophysiological processes. In the current study we indeed found associations between both 25(OH)D2 and 25(OH)D3 on the one hand and markers of low-grade inflammation and endothelial dysfunction on the other. However, associations between 25(OH)D2 and 25(OH)D3 and macroalbuminuria were independent of low-grade inflammation and endothelial dysfunction and may thus rather be mediated by processes other than inflammation and endothelial dysfunction, such as up-regulation of the RAAS [7, 10].
Conversion of 25(OH)D into its active form 1,25(OH)2D is reduced in individuals with decreased kidney function [1]. Therefore, eGFR may modify the associations between 25(OH)D2 and 25(OH)D3 on the one hand and microvascular complications and CVD on the other. However, we found no evidence to support this contention. This may be explained by the low number of individuals with impaired kidney function. Larger prospective studies that include individuals with a larger variety in eGFR are needed to fully address this issue. Similarly, parathyroid hormone stimulates the kidneys to produce 1,25(OH)2D [1] and may therefore also modify the association between vitamin D and vascular complications. In addition, magnesium has an essential role in the synthesis and metabolism of vitamin D and magnesium intake has already been shown to modify the association between vitamin D and risk of disease death in men [40]. Whether or not parathyroid hormone and/or magnesium intake modify the association between vitamin D and microvascular complications and CVD in type 1 diabetes needs to be further investigated.
Strengths and limitations
Strengths of the current study include the measurement of both circulating 25(OH)D2 and 25(OH)D3. This is the first observational cohort study in individuals with type 1 diabetes investigating associations between 25(OH)D2 and vascular complications. In addition, we extensively controlled all associations for potential confounders including season of examination. Furthermore, plasma concentrations of vitamin D were comparable with those previously reported in other cohort studies in individuals with type 1 diabetes [11, 13], which indicates good data integrity of our data.
A drawback of the current study is its cross-sectional design that does not allow conclusions on causality regarding the associations between 25(OH)D2 and 25(OH)D3 and microvascular complications of diabetes. Furthermore, (cross-sectional) observational studies on vitamin D are particularly susceptible to reverse causation as any disease state is likely to reduce physical activity and thereby UV light exposure. However, we could confirm the associations between circulating 25(OH)D3 and albuminuria with similar associations between circulating 25(OH)D2 (which is not directly influenced by exposure to UV light) and albuminuria. In addition, although we have extensively adjusted for cardiovascular risk factors including physical activity, and, in the case of 25(OH)D3 for seasonal variation, residual confounding may still have occurred. In the current study we have no information on the use of vitamin D supplements, which is expected to be a determinant of vitamin D levels and may additionally represent health consciousness and healthy behaviour, which may be related to vascular disease. Last, even though data on the active vitamin D metabolite 1,25(OH)2D were not available for analyses, 25(OH)D concentrations may correlate better with clinical outcomes than 1,25(OH)2D concentrations as most cardiovascular and inflammatory cells express 1αhydroxylase enabling local synthesis of 1,25(OH)2D. Measurement of circulating 1,25(OH)2D does not include locally synthesized 1,25(OH)2D, whereas this local synthesis of 1,25(OH)2D seems particularly important in the non-skeletal actions of vitamin D [39, 41].
Conclusion
In individuals with type 1 diabetes, both higher 25(OH)D2 and 25(OH)D3 are associated with a lower prevalence of macroalbuminuria, but not with retinopathy and CVD. These associations are independent of season of examination and known cardiovascular risk factors such as physical inactivity, and independent of low-grade inflammation and endothelial dysfunction. Larger and prospective studies are needed to further examine the associations between 25(OH)D2 and 25(OH)D3 and the development of microvascular complications and CVD in type 1 diabetes.
Acknowledgements
The research is funded by TI Food and Nutrition, a public–private partnership on pre-competitive research in food and nutrition. The funders had no role in study design, data collection and analysis, decision to publish, or preparation of the manuscript. The EURODIAB study data collection was supported by grants from the Wellcome Trust, European Community and Diabetes UK to NC and JHF. SSSM was supported by the Royal Netherlands Academy of Arts and Sciences.
A complete list of members of the EURODIAB Prospective Complications Study Group is provided in the Electronic Supplementary Material.
Additional file
Concentration of 25(OH)D2 (A) and 25(OH)D3 (B) according to latitude of the study centre. City, country code and, between brackets, latitude of the study centre, and the number of individuals per study centre are displayed on the x-axis. Boxes indicate medians and interquartile ranges and whiskers represent the minimum and maximum values. Table S1. Associations between 25-hydroxyvitamin D2 tertiles and prevalent albuminuria, retinopathy and cardiovascular disease. Table S2. Associations between month-specific 25-hydroxyvitamin D3 tertiles and prevalent albuminuria, retinopathy and CVD. Table S3. Associations between 25-hydroxyvitamin D2 levels and markers of low-grade inflammation and endothelial dysfunction. Table S4. Associations between 25-hydroxyvitamin D3 levels and markers of inflammation and endothelial dysfunction.
Footnotes
Competing interests
The authors declare that they have no competing interests.
Authors’ contributions
LE contributed to analysis and interpretation of data and wrote the manuscript. SJPME and SSSM contributed to analysis and interpretation of data and reviewed/edited the manuscript. JLJMS contributed to acquisition of data and reviewed/edited the manuscript. NC and JHF contributed to conception and design of the study and acquisition of data and reviewed/edited the manuscript. CGS contributed to acquisition of data and reviewed/edited the manuscript. CDAS contributed to analysis and interpretation of data and reviewed/edited the manuscript. All authors approved the final version of the manuscript. CGS and CDAS are the guarantors of this work.
Contributor Information
Lian Engelen, Email: l.engelen@maastrichtuniversity.nl.
Casper G. Schalkwijk, Email: c.schalkwijk@maastrichtuniversity.nl
Simone J. P. M. Eussen, Email: simone.eussen@maastrichtuniversity.nl
Jean L. J. M. Scheijen, Email: j.scheijen@maastrichtuniversity.nl
Sabita S. Soedamah-Muthu, Email: sabita.soedamah-muthu@wur.nl
Nish Chaturvedi, Email: n.chaturvedi@ucl.ac.uk.
John H. Fuller, Email: johnfuller211@btinternet.com
Coen D. A. Stehouwer, Email: cda.stehouwer@mumc.nl
References
- 1.Holick MF. Vitamin D, deficiency. N Engl J Med. 2007;357(3):266–81. doi: 10.1056/NEJMra070553. [DOI] [PubMed] [Google Scholar]
- 2.Equils O, Naiki Y, Shapiro AM, Michelsen K, Lu D, Adams J, et al. 1,25-Dihydroxyvitamin D inhibits lipopolysaccharide-induced immune activation in human endothelial cells. Clin Exp Immunol. 2006;143(1):58–64. doi: 10.1111/j.1365-2249.2005.02961.x. [DOI] [PMC free article] [PubMed] [Google Scholar]
- 3.Schleithoff SS, Zittermann A, Tenderich G, Berthold HK, Stehle P, Koerfer R. Vitamin D supplementation improves cytokine profiles in patients with congestive heart failure: a double-blind, randomized, placebo-controlled trial. Am J Clin Nutr. 2006;83(4):754–9. doi: 10.1093/ajcn/83.4.754. [DOI] [PubMed] [Google Scholar]
- 4.Al-Daghri NM, Guerini FR, Al-Attas OS, Alokail MS, Alkharfy KM, Draz HM, et al. Vitamin D receptor gene polymorphisms are associated with obesity and inflammosome activity. PLoS One. 2014;9(7):e102141. doi: 10.1371/journal.pone.0102141. [DOI] [PMC free article] [PubMed] [Google Scholar]
- 5.Molinari C, Uberti F, Grossini E, Vacca G, Carda S, Invernizzi M, et al. 1alpha,25-dihydroxycholecalciferol induces nitric oxide production in cultured endothelial cells. Cell Physiol Biochem. 2011;27(6):661–8. doi: 10.1159/000330075. [DOI] [PubMed] [Google Scholar]
- 6.Sugden JA, Davies JI, Witham MD, Morris AD, Struthers AD. Vitamin D improves endothelial function in patients with Type 2 diabetes mellitus and low vitamin D levels. Diabet Med. 2008;25(3):320–5. doi: 10.1111/j.1464-5491.2007.02360.x. [DOI] [PubMed] [Google Scholar]
- 7.Li YC, Kong J, Wei M, Chen ZF, Liu SQ, Cao LP. 1,25-Dihydroxyvitamin D(3) is a negative endocrine regulator of the renin-angiotensin system. J Clin Invest. 2002;110(2):229–38. doi: 10.1172/JCI0215219. [DOI] [PMC free article] [PubMed] [Google Scholar]
- 8.Schram MT, Chaturvedi N, Schalkwijk CG, Fuller JH, Stehouwer CD. Markers of inflammation are cross-sectionally associated with microvascular complications and cardiovascular disease in type 1 diabetes–the EURODIAB Prospective Complications Study. Diabetologia. 2005;48(2):370–8. doi: 10.1007/s00125-004-1628-8. [DOI] [PubMed] [Google Scholar]
- 9.Astrup AS, Tarnow L, Pietraszek L, Schalkwijk CG, Stehouwer CD, Parving HH, et al. Markers of endothelial dysfunction and inflammation in type 1 diabetic patients with or without diabetic nephropathy followed for 10 years: association with mortality and decline of glomerular filtration rate. Diabetes Care. 2008;31(6):1170–6. doi: 10.2337/dc07-1960. [DOI] [PubMed] [Google Scholar]
- 10.Patel VB, Parajuli N, Oudit GY. Role of angiotensin-converting enzyme 2 (ACE2) in diabetic cardiovascular complications. Clin Sci (Lond) 2014;126(7):471–82. doi: 10.1042/CS20130344. [DOI] [PubMed] [Google Scholar]
- 11.de Boer IH, Sachs MC, Cleary PA, Hoofnagle AN, Lachin JM, Molitch ME, et al. Circulating vitamin D metabolites and kidney disease in type 1 diabetes. J Clin Endocrinol Metab. 2012;97(12):4780–8. doi: 10.1210/jc.2012-2852. [DOI] [PMC free article] [PubMed] [Google Scholar]
- 12.Kaur H, Donaghue KC, Chan AK, Benitez-Aguirre P, Hing S, Lloyd M, et al. Vitamin D deficiency is associated with retinopathy in children and adolescents with type 1 diabetes. Diabetes Care. 2011;34(6):1400–2. doi: 10.2337/dc11-0103. [DOI] [PMC free article] [PubMed] [Google Scholar]
- 13.Joergensen C, Hovind P, Schmedes A, Parving HH, Rossing P. Vitamin D levels, microvascular complications, and mortality in type 1 diabetes. Diabetes Care. 2011;34(5):1081–5. doi: 10.2337/dc10-2459. [DOI] [PMC free article] [PubMed] [Google Scholar]
- 14.Beveridge LA, Witham MD. Vitamin D and the cardiovascular system. Osteoporos Int. 2013;24(8):2167–80. doi: 10.1007/s00198-013-2281-1. [DOI] [PubMed] [Google Scholar]
- 15.Cashman KD, Kinsella M, McNulty BA, Walton J, Gibney MJ, Flynn A, et al. Dietary vitamin D(2)–a potentially underestimated contributor to vitamin D nutritional status of adults? Br J Nutr. 2014;112(2):193–202. doi: 10.1017/S0007114514000725. [DOI] [PubMed] [Google Scholar]
- 16.Stephenson F, Fuller JH, on behalf of the EURODIAB IDDM Complications Study Group Microvascular and acute complications in IDDM patients: the EURODIAB IDDM Complications Study. Diabetologia. 1994;37(3):278–85. doi: 10.1007/BF00398055. [DOI] [PubMed] [Google Scholar]
- 17.Koivisto VA, Stevens LK, Mattock M, Ebeling P, Muggeo M, Stephenson J, et al. Cardiovascular disease and its risk factors in IDDM in Europe. EURODIAB IDDM Complications Study Group. Diabetes Care. 1996;19(7):689–97. doi: 10.2337/diacare.19.7.689. [DOI] [PubMed] [Google Scholar]
- 18.Chaturvedi N, Schalkwijk CG, Abrahamian H, Fuller JH, Stehouwer CD. Circulating and urinary transforming growth factor beta1, Amadori albumin, and complications of type 1 diabetes: the EURODIAB prospective complications study. Diabetes Care. 2002;25(12):2320–7. doi: 10.2337/diacare.25.12.2320. [DOI] [PubMed] [Google Scholar]
- 19.Chaturvedi N, Bandinelli S, Mangili R, Penno G, Rottiers RE, Fuller JH. Microalbuminuria in type 1 diabetes: rates, risk factors and glycemic threshold. Kidney Int. 2001;60(1):219–27. doi: 10.1046/j.1523-1755.2001.00789.x. [DOI] [PubMed] [Google Scholar]
- 20.Aldington SJ, Kohner EM, Meuer S, Klein R, Sjolie AK. Methodology for retinal photography and assessment of diabetic retinopathy: the EURODIAB IDDM complications study. Diabetologia. 1995;38(4):437–44. doi: 10.1007/BF00410281. [DOI] [PubMed] [Google Scholar]
- 21.Levey AS, Stevens LA, Schmid CH, Zhang YL, Castro AF, 3rd, Feldman HI, et al. A new equation to estimate glomerular filtration rate. Ann Intern Med. 2009;150(9):604–12. doi: 10.7326/0003-4819-150-9-200905050-00006. [DOI] [PMC free article] [PubMed] [Google Scholar]
- 22.Tielemans SM, Soedamah-Muthu SS, De Neve M, Toeller M, Chaturvedi N, Fuller JH, et al. Association of physical activity with all-cause mortality and incident and prevalent cardiovascular disease among patients with type 1 diabetes: the EURODIAB Prospective Complications Study. Diabetologia. 2013;56(1):82–91. doi: 10.1007/s00125-012-2743-6. [DOI] [PubMed] [Google Scholar]
- 23.Beulens JW, Kruidhof JS, Grobbee DE, Chaturvedi N, Fuller JH, Soedamah-Muthu SS. Alcohol consumption and risk of microvascular complications in type 1 diabetes patients: the EURODIAB Prospective Complications Study. Diabetologia. 2008;51(9):1631–8. doi: 10.1007/s00125-008-1091-z. [DOI] [PubMed] [Google Scholar]
- 24.Schram MT, Chaturvedi N, Schalkwijk C, Giorgino F, Ebeling P, Fuller JH, et al. Vascular risk factors and markers of endothelial function as determinants of inflammatory markers in type 1 diabetes: the EURODIAB Prospective Complications Study. Diabetes Care. 2003;26(7):2165–73. doi: 10.2337/diacare.26.7.2165. [DOI] [PubMed] [Google Scholar]
- 25.Sterne JA, White IR, Carlin JB, Spratt M, Royston P, Kenward MG, et al. Multiple imputation for missing data in epidemiological and clinical research: potential and pitfalls. Bmj. 2009;338:b2393. doi: 10.1136/bmj.b2393. [DOI] [PMC free article] [PubMed] [Google Scholar]
- 26.Knol MJ, van der Tweel I, Grobbee DE, Numans ME, Geerlings MI. Estimating interaction on an additive scale between continuous determinants in a logistic regression model. Int J Epidemiol. 2007;36(5):1111–8. doi: 10.1093/ije/dym157. [DOI] [PubMed] [Google Scholar]
- 27.van Bussel BC, Soedamah-Muthu SS, Henry RM, Schalkwijk CG, Ferreira I, Chaturvedi N, et al. Unhealthy dietary patterns associated with inflammation and endothelial dysfunction in type 1 diabetes: the EURODIAB study. Nutr Metab Cardiovasc Dis. 2013;23(8):758–64. doi: 10.1016/j.numecd.2012.04.005. [DOI] [PubMed] [Google Scholar]
- 28.Jones G. Extrarenal vitamin D activation and interactions between vitamin D(2), vitamin D(3), and vitamin D analogs. Annu Rev Nutr. 2013;33:23–44. doi: 10.1146/annurev-nutr-071812-161203. [DOI] [PubMed] [Google Scholar]
- 29.O’Seaghdha CM, Hwang SJ, Holden R, Booth SL, Fox CS. Phylloquinone and vitamin D status: associations with incident chronic kidney disease in the Framingham Offspring cohort. Am J Nephrol. 2012;36(1):68–77. doi: 10.1159/000339005. [DOI] [PMC free article] [PubMed] [Google Scholar]
- 30.Cai X, Hu Z, Chen L, Han X, Ji L. Analysis of the associations between vitamin D and albuminuria or beta-cell function in Chinese type 2 diabetes. Biomed Res Int. 2014;2014:640909. doi: 10.1155/2014/640909. [DOI] [PMC free article] [PubMed] [Google Scholar]
- 31.Ahmadieh H, Azar ST, Lakkis N, Arabi A. Hypovitaminosis d in patients with type 2 diabetes mellitus: a relation to disease control and complications. ISRN Endocrinol. 2013;2013:641098. doi: 10.1155/2013/641098. [DOI] [PMC free article] [PubMed] [Google Scholar]
- 32.Damasiewicz MJ, Magliano DJ, Daly RM, Gagnon C, Lu ZX, Ebeling PR, et al. 25-Hydroxyvitamin D levels and chronic kidney disease in the AusDiab (Australian Diabetes, Obesity and Lifestyle) study. BMC Nephrol. 2012;13:55. doi: 10.1186/1471-2369-13-55. [DOI] [PMC free article] [PubMed] [Google Scholar]
- 33.de Boer IH, Ioannou GN, Kestenbaum B, Brunzell JD, Weiss NS. 25-Hydroxyvitamin D levels and albuminuria in the Third National Health and Nutrition Examination Survey (NHANES III) Am J Kidney Dis. 2007;50(1):69–77. doi: 10.1053/j.ajkd.2007.04.015. [DOI] [PubMed] [Google Scholar]
- 34.Skaaby T, Husemoen LL, Pisinger C, Jorgensen T, Thuesen BH, Rasmussen K, et al. Vitamin D status and 5-year changes in urine albumin creatinine ratio and parathyroid hormone in a general population. Endocrine. 2013;44(2):473–80. doi: 10.1007/s12020-013-9887-0. [DOI] [PubMed] [Google Scholar]
- 35.Patrick PA, Visintainer PF, Shi Q, Weiss IA, Brand DA. Vitamin D and retinopathy in adults with diabetes mellitus. Arch Ophthalmol. 2012;130(6):756–60. doi: 10.1001/archophthalmol.2011.2749. [DOI] [PubMed] [Google Scholar]
- 36.Payne JF, Ray R, Watson DG, Delille C, Rimler E, Cleveland J, et al. Vitamin D insufficiency in diabetic retinopathy. Endocr Pract. 2012;18(2):185–93. doi: 10.4158/EP11147.OR. [DOI] [PMC free article] [PubMed] [Google Scholar]
- 37.Theodoratou E, Tzoulaki I, Zgaga L, Ioannidis JP. Vitamin D and multiple health outcomes: umbrella review of systematic reviews and meta-analyses of observational studies and randomised trials. BMJ. 2014;348:g2035. doi: 10.1136/bmj.g2035. [DOI] [PMC free article] [PubMed] [Google Scholar]
- 38.Lavie CJ, Lee JH, Milani RV. Vitamin D and cardiovascular disease will it live up to its hype? J Am Coll Cardiol. 2011;58(15):1547–56. doi: 10.1016/j.jacc.2011.07.008. [DOI] [PubMed] [Google Scholar]
- 39.Norman PE, Powell JT. Vitamin D and cardiovascular disease. Circ Res. 2014;114(2):379–93. doi: 10.1161/CIRCRESAHA.113.301241. [DOI] [PubMed] [Google Scholar]
- 40.Mursu J, Nurmi T, Voutilainen S, Tuomainen TP, Virtanen JK. The association between serum 25-hydroxyvitamin D3 concentration and risk of disease death in men: modification by magnesium intake. Eur J Epidemiol. 2015;30(4):343–7. doi: 10.1007/s10654-015-0006-9. [DOI] [PubMed] [Google Scholar]
- 41.Mosekilde L. Vitamin D, requirement and setting recommendation levels: long-term perspectives. Nutr Rev. 2008;66(10 Suppl 2):S170–7. doi: 10.1111/j.1753-4887.2008.00103.x. [DOI] [PubMed] [Google Scholar]