Abstract
The activation/deactivation processes for G-protein coupled receptors (GPCRs) have been computationally studied for several different classes, including rhodopsin, the β2 adrenergic receptor, and the M2 muscarinic receptor. Despite determined cocrystal structures of the adenosine A2A receptor (A2AAR) in complex with antagonists, agonists and an antibody, the deactivation process of this GPCR is not completely understood. In this study, we investigate the convergence of two apo simulations, one starting with an agonist-bound conformation (PDB: 3QAK)14 and the other starting with an antagonist-bound conformation (PDB: 3EML)11. Despite the two simulations not completely converging, we were able to identify distinct intermediate steps of the deactivation process characterized by the movement of Y2887.53 in the NPxxY motif. We find that Y2887.53 contributes to the process by forming hydrogen bonds to residues in transmembrane helices 2 and 7 and losing these interactions upon full deactivation. Y1975.58 also plays a role in the process by forming a hydrogen bond only once the side chain moves from the lipid interface to the middle of the helical bundle.
Keywords: GPCR, adenosine A2A, activation, molecular dynamics, NPxxY
Introduction
Adenosine receptors are a class of G protein-coupled receptors (GPCRs) that mediate several cellular processes by binding endogenously to adenosine.1 On binding of adenosine or other agonists, the A2AAR subtype of the adenosine receptor undergoes a conformational change and couples to Gs in the peripheral tissues and Golf in the brain to stimulate the cAMP-PKA pathway. In the immune system, activation leads to immunosuppression by inhibiting proinflammation cytokines, including TNF-α and INF-γ.2–5 In the brain, A2AAR is present in the dopamine-rich areas, such as the Globus pallidus, and works by inhibiting dopaminergic activity by increasing gamma-aminobutyric acid (GABA) or directly interacting with the D2 dopamine receptor.5,6 Thus, antagonists of A2AAR, like caffeine, increase dopaminergic activity, making such inhibitors possible therapeutics for Parkinson's disease and Alzheimer's disease.5–7 Additionally, antagonism of A2AAR is thought to decrease lymphocyte migration across the blood brain barrier (BBB) to the central nervous system, making such antagonists potential candidates for treating BBB diseases such as multiple sclerosis.8
The X-ray structure of A2AAR has been solved in complex with several different ligands including antagonists,9,10 an inverse agonist ZM251385,11 an antibody12 and agonists13,14 including UK-432097.14 Each of these structures reveals an extracellular N-terminus, seven transmembrane (TM1–7) alpha helices, three extracellular loops (ECL1–3), three intracellular loops (ICL1–3) and an intracellular C-terminus. Compared with the inverse-agonist bound structure,11 the UK-432097 agonist bound structure14 shows the side-chain dihedral switch of F2015.62 and Y1975.58 from inside the helical bundle to outside the helical bundle. Furthermore, there is a χ1 side-chain dihedral switch of Y2887.53 from trans in the inverse-agonist bound structure to gauche in the antagonist bound structure. These structural features cause the distance between the hydroxyl oxygen of Y1975.58 and Y2887.53 to be 15.7 Å in the agonist bound structure and 9.58 Å in the inverse-agonist bound structure (Fig. 1). In the active structure, there is an outward tilt of W2466.48 causing the displacement from the intracellular end to be ∼3 Å. As described below, these differences vary from other active GPCRs.
Figure 1.
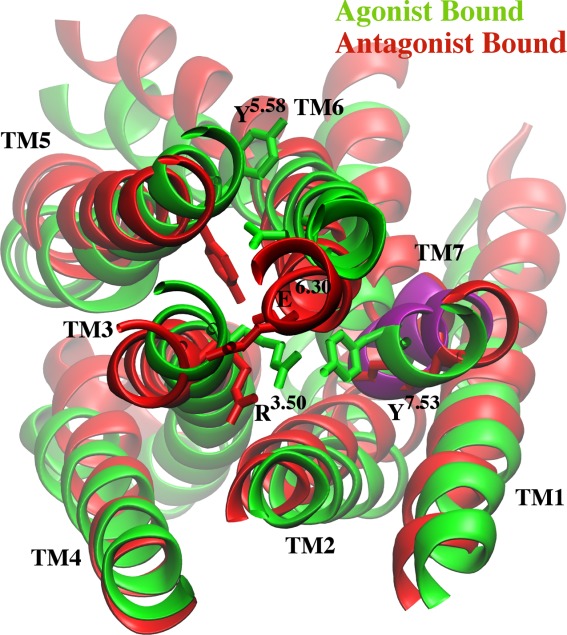
A cartoon representation of the starting antagonist-bound apo (red) and the agonist-bound apo (green) structures. Key residues Y1975.58, Y2287.53, E2286.30, and R1023.50 are highlighted as sticks. The NPxxY motif is shown in purple.
Activation of several GPCRs is characterized by a structural rearrangement of TM5, TM6, and TM7 to accommodate coupling of the G-protein. Upon activation, a salt bridge between R3.50 and E6.30, often called the “ionic lock,” is disrupted and the χ1 dihedral angle of W6.48 switches from the gauche to trans conformation, which breaks interactions between D2.50, N7.49, and S7.45. This rearrangement facilitates the side-chain relocation of Y5.58 and Y7.53, allowing the two tyrosines to interact through either a direct hydrogen bond or through water molecules. In the currently available active structures, the distance between the hydroxyl oxygen of Y5.58 and Y7.53 is 4.28 Å in β2 adrenergic receptor (β2AR),15 5.43 Å in rhodopsin,16 and 4.21 Å in the M2 muscarinic receptor.17 This is coupled with displacement of the intracellular end of TM6, which can vary from 7 Å in rhodopsin,16,18 to 10.4 Å in the M2 receptor,17,19 and 14 Å in the β2 adrenergic receptor (β2AR).15,20
Previous computational studies have investigated the activation/deactivation process of GPCRs, and the role of side-chain dihedral switches in it.21–24 In a study by Dror et al., the deactivation process of β2AR was characterized from several μs of conventional molecular dynamic (MD) simulations on the Anton supercomputer. The group started with an agonist bound structure and was able to identify distinct conformations during the course of deactivation.21 During the first step of deactivation, TM7 adopts the inactive conformation followed by the movement of both TM5 and TM6. In another study by Miao et al., accelerated molecular dynamics (aMD) was used to identify the pathway from the inactive M2 receptor to the active receptor. Using the enhanced sampling, the group was able to identify two intermediate conformations on the pathway and observe the direct interaction between Y5.58 and Y7.53 in the active structures.24 In a third study by Li et al., the deactivation process of A2AAR was found to involve the separation of TM4, TM5, and TM3 and a rearrangement of TM6, and deactivation caused the helices to bundle together. Additionally, three separate conformations for the “toggle switch” W2466.48 were identified for apo, active, and inactive structures.22
One consistent feature of the active structures of β2AR, the M2 receptor and rhodopsin is the interaction between Y5.58 and Y7.53. This interaction is absent in the A2AAR agonist bound structure however. Moreover, Y1975.58 is facing the lipid interface, causing the distance between the two residues to be greater than 15 Å. For the A2AAR receptor, open questions include what is the role of these groups in the activation/deactivation process. In this study, we performed MD simulations on the apo form of two starting structures of A2AAR, the agonist-bound (PDB: 3QAK) and the antagonist-bound (PDB: 3EML), and examined the convergence of these two simulations over ∼1.6 μs. We found the two sampled ensembles of each of these two structures do not converge, although the agonist-bound apo structure is more dynamic and approaches inactivation more significantly. By studying these simulations, we were able to identify two intermediate steps between active and inactive structures based on the dynamics of the NPxxY motif. Interestingly, the antagonist-bound apo structure remains in the inactive conformation, and eventually forms the ionic lock, which was observed to be broken in the inactive crystal structures.9–12
Results
Simulation convergence
Starting with the agonist-bound (PDB: 3QAK) and the antagonist-bound (PDB: 3EML) structures of A2AAR with both ligands removed, sufficiently long simulations should generate converged ensembles, given that both structures have the same sequence and are modeled in the same environment. With the final length of the Anton simulations, ∼1.6 μs starting from the agonist-bound conformation and ∼1.8 μs starting from the antagonist-bound conformation, convergence did not occur. Both simulations deviate from their starting structures, with the initial antagonist-bound apo simulation stabilizing at ∼1 μs and the initial agonist-bound apo simulation continuously sampling different phase space [Supporting Information Fig. 1(A,B)]. The most flexible regions for both simulations are ECL2 and ICL3, which is in agreement with several other GPCR computational studies.23,25 The intracellular end of TM5 is slightly more flexible in the initial agonist-bound apo simulation compared to the initial antagonist-bound apo simulation with the root mean squared deviation (RMSF) being 1.5 Å and 1 Å, respectively (Supporting Information Fig. 2). TM7 is also more flexible in the initial agonist-bound apo simulation, with the RMSF being ∼2 Å and ∼1 Å, respectively.
Figure 2.
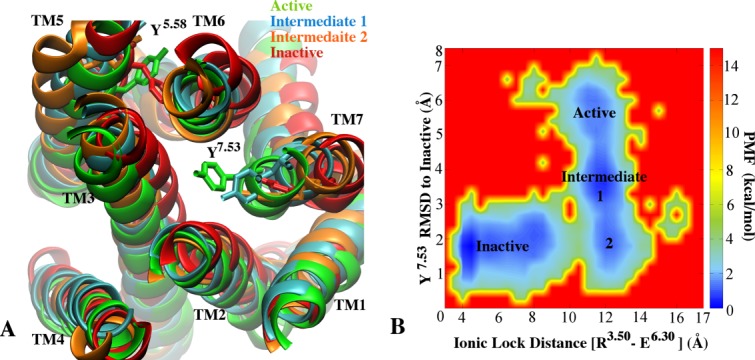
Deactivation of Adenosine A2AAR from the initial agonist-bound apo conformation to the initial antagonist-bound apo conformation: A: The aligned active (green), inactive (red), intermediate one (blue) and intermediate two (orange) structures identified during the deactivation process. Residues Y1975.58 and Y2887.53 are shown as sticks. B: The potential of mean force (PMF) is calculated as a function of the distance between the ionic lock (R1023.50 - E2286.30) and the RMSD of Y2887.53 in the NPxxY motif relative to the inactive structure.
To further characterize the convergence of the ensembles, we used principal component analysis (PCA) to reduce the dimensionality of the atomic motion and extrapolate correlations from the simulations. We calculated the first two components, PC1 and PC2, from all of the backbone atoms and observed that these two components account for only ∼40% of the variance of the simulations. These projections reveal some overlap between the antagonist-bound apo starting structure and the subsequent simulation, and no overlap between the agonist-bound apo starting structure and that subsequent simulation. Additionally, there is no overlap between the two simulations [Supporting Information Fig. 3(A)]. The first two principal components of all of the backbone atoms contain information about motions of the extracellular and intracellular loops. To examine convergence of the TM helices, we performed additional PC analysis from the backbone atoms of specific helices. Both TM1 and TM2 show large sampling areas, and overlap between both simulations [Supporting Information Fig. 3(B,C)]. TM3 is more modest and there is no overlap between both simulations, suggesting the movements from this helix do not converge [Supporting Information Fig. 3(D)], and the movement of TM4 is also stable with the two simulations converging somewhat [Supporting Information Fig. 4(A)]. The largest differences are between TM5, TM6, and TM7 [Supporting Information Fig. 4(B−D)]. The antagonist-bound apo simulation shows two distinct populations in TM5, while the agonist-bound apo simulation shows large motion, which was also observed from characterizing the RMSF of this helix [Supporting Information Fig. 4(B)]. In TM6, there is no overlap between the antagonist-bound apo starting structure and the subsequent simulation, and there is a large motion for the antagonist-bound simulation, while the agonist-bound simulation is more stable [Supporting Information Fig. 4(C)]. In TM7, there is no overlap between the agonist-bound apo starting structure and the subsequent simulation. For the agonist-bound apo simulation, there are three distinct conformations sampled, which drift toward those of the antagonist-bound apo simulation. The antagonist-bound apo simulation is very stable, sampling only one conformation, consistent with the RMSF results [Supporting Information Fig. 4(D)]. These data suggest that there are large differences between TM5, TM6, and TM7 in the near agonist-bound ensemble compared to the near antagonist-bound ensemble.
Figure 3.
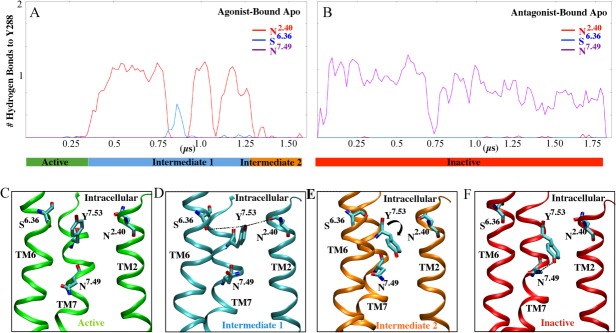
The hydrogen bond network of Y2887.53 during A2AAR deactivation: A: The number of hydrogen bonds formed with Y2887.53 during the initial agonist-bound apo simulation. A bar below the x-axis shows the time evolution of the active, intermediate one and intermediate two conformations in green, blue and orange, respectively. B: The number of hydrogen bonds formed with Y2887.53 during the initial antagonist-bound apo structure with the inactive conformation shown in red. C: Cartoon representation of the hydrogen bonds identified in the active trajectory. Y2887.53 is shown as a stick. D: Cartoon representation of the hydrogen bonds identified in intermediate one. Residues S2346.36, Y2887.53, and, N422.40 shown as sticks. E: Cartoon representation of hydrogen bonds in intermediate two. I292CTERM and Y2887.53 shown as sticks. F: Cartoon representations of hydrogen bonds in inactive trajectories. N2847.49, Y2887.53, and I292CTERM are shown as sticks.
Figure 4.
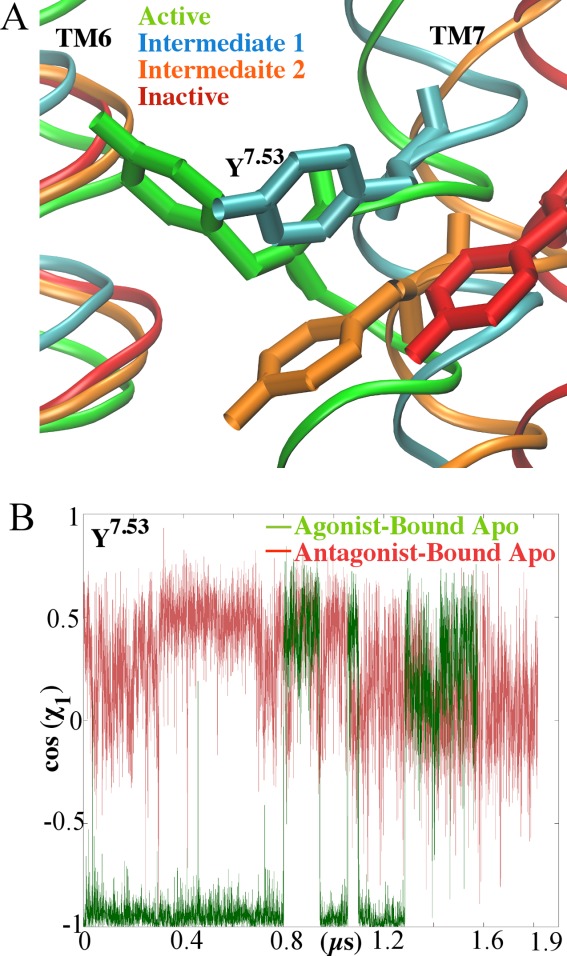
Time course of the χ1 Y2887.53 side-chain dihedral: A: Cartoon representation of the conformation of Y2887.53. The aligned active (green), inactive (red), intermediate one (blue) and intermediate two (orange) structures are shown as ribbons. (B) The initial agonist-bound apo simulation is shown in green and the initial antagonist-bound simulation is shown in red.
Reaction coordinates
Although the ensembles of the two simulations do not converge completely, key steps can be identified from the evolution of the initial agonist-bound apo simulation towards the inactive structure. A representative coordinate of the inactive structure is the distance between R1023.50 and E2286.30, the “ionic lock”.24,25 The root mean squared deviation (RMSD) of Y2887.53 in the NPxxY motif from the starting structure and the distance between the ionic lock side-chains identify three different conformations evolving from the initial agonist-bound apo simulation. A final conformation can be identified from the initial antagonist-bound apo simulation. A potential of mean force profile was calculated with these reaction coordinates to isolate all four conformations from the two simulations [Fig. 2(A,C)]. From this profile, we discern four main states, and furthermore suggest a hypothesis for deactivation. Because these simulations are not fully converged, the PMF is only qualitatively meaningful, and is used here to help locate the active, intermediate, and inactive conformations.
The profile for the active and inactive conformations is reproduced in shorter MD simulations originating from the starting agonist-bound apo and antagonist-bound apo structures. The RMSD of Y2887.53 and the distance between the ionic lock is nearly identical in the shorter 200 ns antagonist-bound apo simulation and four separate 50 ns agonist-bound apo simulations compared with the longer ∼1.8 μs antagonist-bound apo simulation and ∼1.6 μs agonist-bound apo simulation, respectively (Supporting Information Fig. 5).
Figure 5.
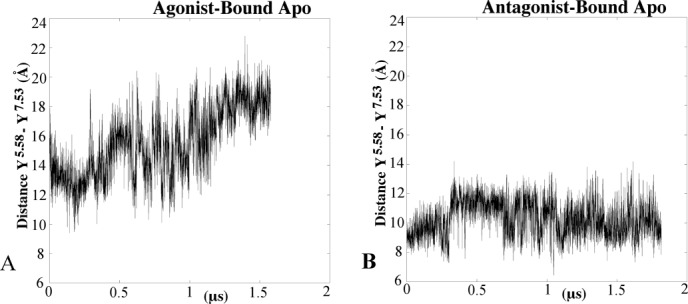
The distance between the hydroxyl atoms for Y1975.58 and Y2887.53 for the agonist-bound simulation (A) and the antagonist bound simulation (B).
Deactivation
When the receptor transitions from the active to the intermediate 1 structures, there is a formation of hydrogen bonds with Y2887.53 (Fig. 3). This hydrogen bond network is highly dynamic. During the first 250ns of the agonist-bound apo simulation, Y2887.53 forms no hydrogen bonds, and this time corresponds to the active conformations. This differs from other active structures, such as rhodopsin, M2 muscarinic and β2AR, in that Y2887.53 forms hydrogen bonds with Y1975.58 either directly or through a water-mediated bond.21,24–26 In the intermediate 1 conformation, Y2887.53 alternates hydrogen bonds with S2346.36, N2847.49 of the NPxxY motif and N422.40. In intermediate 2, the Y2887.53 side chain dihedral switches from trans to gauche, which causes a break in hydrogen bonds from residues in TM2 and TM6 (Fig. 3). During the initial antagonist-bound apo simulation, Y2887.53 forms a hydrogen bond with N2847.49 during the entire simulation. These hydrogen bonds reduce the tilt of the backbone atoms of TM7 ∼4 Å. While the first step of ‘deactivation’ is the formation of hydrogen bonds, the next step is the side-chain dihedral switch of Y2887.53 from trans to gauche (Fig. 4). This switch contributes to the movement of TM7, which tilts outwards ∼3 Å compared with the starting structure. The gauche conformation of Y2887.53 is maintained throughout the initial antagonist-bound apo simulation. During the initial agonist-bound apo simulation, Y1975.58 remains in the lipid interface, similar to the inactive conformation of rhodopsin27 and in the trans side-chain dihedral conformation (Supporting Information Fig. 6). In the initial antagonist-bound apo simulation, this residue faces the helical bundle and remains in the gauche conformation, similar to the active conformations of M2, rhodopsin, and β2AR.16,17,27 This conformation prevents the hydrogen bond between Y2887.53 and Y1975.58 from forming. The distance between the hydroxyl oxygen of these residues remains above 9 Å throughout the entire agonist-bound apo simulation (Fig. 5). In the antagonist-bound apo simulation, due to the conformational switch of Y1975.58 the distance between these two residues decreases. Supporting Information Figure 6 plots the distance between Y1975.58 and I983.46, which represents the helical bundle. This distance is greater than 10 Å for the majority of the initial agonist-bound apo simulation, while Y1975.58 remains in the lipid interface. In the initial antagonist-bound apo simulation, the distance stays larger than 8 Å, while Y1975.58 remains near the helical bundle. Additionally, the movement of Y1975.58 is highly coordinated with F2015.62 (Supporting Information 7A and 7B). During the initial antagonist-bound apo simulation, the ionic lock between R1023.50 and E2286.30 forms for ∼500 ns (Fig. 6), but it does not form in the agonist-bound apo simulation (Supporting Information Fig. 8). This lock is characteristic of complete inactivation of GPCRs26 (Fig. 6).
Figure 6.
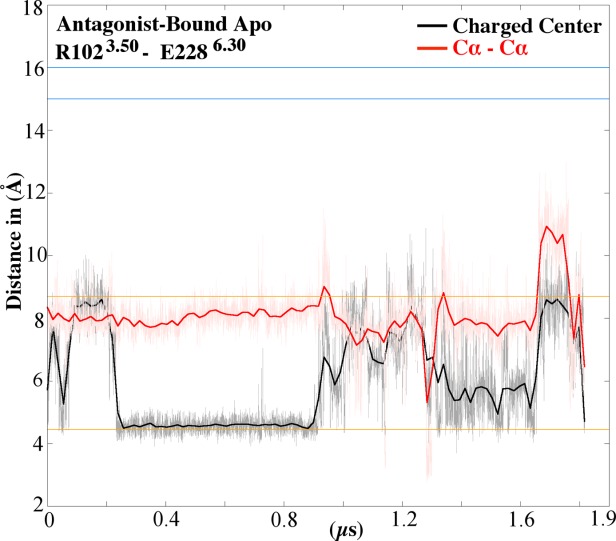
Distance between the R1023.50 – E2286.30 ionic lock groups in the initial antagonist-bound apo simulation: The smoothed distance between charged centers of R1023.50 and E2286.30 is plotted in black and the distance between the Cα atoms in red, while the raw data in gray and pink, respectively. The distance between the charged center and Cα for inactive rhodopsin (4.5 Å and 8.6 Å, respectively), shown as orange lines (PDB ID: 1F88).18 The distance between the charged center and Cα for active rhodopsin (16 Å and 14.6 Å, respectively), shown as blue lines (PDB ID: 3CAP).47
Discussion
Molecular dynamic simulations allow us to visualize the time evolution of molecular motion. In this study, we simulated two A2AAR structures, an agonist-bound and an antagonist-bound both with the ligands removed. Two partial lipids and five stearic acid molecules were crystallized with the agonist-bound14 and antagonist-bound11 structures, respectively, but were also removed for the simulations. Lipid composition has an effect on the fluidity of the membrane and can play a part in GPCR stability and function. In rhodopsin, the changes between the MI and MII states are dependent on the lipid environment.28 Additionally, a recent study compared the molecular dynamics of A2AAR in a POPC bilayer and a POPE bilayer and showed large differences in the interhelical motions depending on the environment.29 This suggests that changing the lipid environment may have an effect on the rearrangement of TM5, TM6, and TM7 and the time scale of deactivation.
Given the same system starting in different areas of phase space, one would expect convergence of phase space sampling from both simulations given a long enough time scale. In a study by Dror et al., the deactivation process of β2AR took between 400 ns to 4.5 μs to fully complete,21 and experimental data suggests that it takes ∼40 ms for the intracellular displacement of TM6 to occur.30 After an investigation of the agonist-bound apo and the antagonist-bound apo simulations, it was determined that the given timescale, ∼1.6 μs for each, was not long enough to observe convergence of the ensembles yet interesting phenomena were observed with respect to deactivation upon which hypotheses can be suggested and tested.
The largest differences between the simulations occurred in TM5, TM6, and TM7. A PMF was constructed to determine the approximate probability distribution of the simulations using the RMSD of Y2887.53 and the distance between the ionic lock groups as reaction coordinates. From this analysis, we can see three different conformations from the agonist-bound simulation and one from the antagonist-bound simulation. In the agonist-bound simulation, Y2887.53 participates in a change in the hydrogen bond network, eventually reducing the tilt of TM7 by ∼4 Å. Additionally, Y1975.58 faces the lipid interface during the agonist-bound simulation, and faces the helical bundle during the antagonist-bound simulation. The conformation of Y1975.58 prevents an interaction between Y1975.58 and Y2887.53, which is key for activation. On the basis of these results, it is likely that the starting crystal structure of the agonist-bound A2AAR is not in the full active conformation.
The changes in the agonist-bound apo simulation only occur after a sodium ion interacts with D522.50. This residue had an estimated pKA of 8.91 in the agonist-bound structure, but was left deprotonated because it was in solvent in the antagonist-bound structure. In the Anton agonist-bound apo simulation, a sodium ion enters the sodium-binding site, which includes D522.50, S913.39, and N2807.46, at 44 ns, and remains in this site for 74% of the simulation. The rearrangement of TM7 after sodium binding is consistent with a previous study.31
Materials and Methods
The residues were numbered using the Ballesteros and Weinstein format of X.YY, where X is the transmembrane helix number, one through seven, and YY is the relative number from the most conserved residue of the transmembrane helix, labeled 50.32
System setup
The starting structure for the agonist-bound simulation was solved in complex with the agonist UK-432097 (PDB: 3QAK)14 at 2.71 Å resolution, and the antagonist-bound structure of A2AAR was determined in complex with ZM241385 (PDB: 3EML)11 at 2.6 Å resolution. Two partial lipids were crystallized with 3QAK and five stearic acid molecules were crystallized with 3EML. Both structures were crystallized with a T4 lysozyme fused to the ICL3. The T4 lysozyme, lipid molecules, and the ligands were removed and the missing EC2 and IC3 loops and missing residues were modeled using Modeller.33 All hydrogens were added using the psfgen plugin on VMD34 and internal water molecules were added with Doswer.35 PROPKA36 was used to predict the pKA of all titratable residues. All titratable residues were left in their dominant protonation state at pH 7.0, except D52 and H155, which were deprotonated.
The four disulfide bonds resolved in the crystal structures, Cys712.69 – Cys1595.20, Cys743.22-Cys1464.67, Cys773.25-Cys1665.27, and Cys259ECL3 -Cys262ECL3, were maintained. The psfgen plugin on VMD34 was used to generate the system topology in the CHARMM format,37 the palmitoyl–oleoyl-phosphatidyl-choline (POPC) lipid molecules were added using the membrane plugin in VMD,34 and the system was solvated using the Solvate plugin.34 The net charge of the receptor structures was neutralized and 0.15M NaCl was added. The final initial agonist-bound apo system, used for five MD simulations, had a total of 170 POPC lipid molecules, 23 sodium ions, 32 chloride ions and 5,392 water molecules with a total of 76,216 atoms. The initial antagonist-bound apo system, used for two MD simulations, had 169 POPC molecules, 23 sodium ions, 33 chloride ions, and 5,410 water molecules with a total of 77,289 atoms. Periodic boundary conditions were applied to both simulation systems.
Molecular dynamic simulations
All molecular dynamics simulations were initially performed using NAMD 2.8b3.38 The CHARMM27 with CMAP parameter set was used for the protein,39,40 and the CHARMM36 for the POPC lipid molecules.37 The cutoff distance for the van der Waals and short range electrostatics was 12 Å, and the particle mesh ewald method was applied for the calculation of long range electrostatic interactions.41 A 2 fs time step and a multiple-time-stepping algorithm38 were used with bonded and short range non bonded interactions computed for each time step, and long range electrostatics every two time steps. Bonds involving hydrogen atoms were constrained with RATTLE.42
Initially, the lipid tails were minimized for 5000 steps and simulated for 3 ns with NVT at 300 K. Next, the protein atoms were relaxed for 5 ns with NPT conditions with 10 kcal/(mol*Å2) harmonic restraints applied. All structures were simulated for an additional 5 ns with only the Cα atoms restrained with 5 kcal/(mol*Å2) harmonic restraints. One antagonist-bound apo simulation and one agonist-bound apo simulation were simulated for 100 ns with everything released in NPT conditions. The production runs on Anton43 were initiated from the final structures of these two MD runs.
The coordinate and velocity files were converted from the NAMD format to Anton using a script (Supplementary Information). The initial agonist-bound apo structure and the antagonist-bound apo structure were then simulated on Anton for 1.57 μs and 1.75 μs, respectively. M-SHAKE was applied to the hydrogen-containing bonds,44 and a simulation time step of 2 fs was used. The cutoff distance for the van der Waals and short range electrostatics was 13.5 Å and the Gaussian Split Ewald method45 with a 64 × 64 × 64 grid, σ = 2.51 Å and σs = 1.77 Å, was applied for the calculation of long range electrostatic interactions. Trajectory snapshots were saved every 240 ps for analysis.
Five control simulations with everything released in NPT conditions, including one 200 ns antagonist-bound apo simulation and four 50 ns agonist-bound apo simulations were performed using NAMD.38
Calculation of potential of mean force
The potential mean of force (PMF) was used to study changes in free energy based on the sampling space of both Anton simulations as a function of directed reaction coordinates. To identify key changes in “deactivation,” the distance between the ionic lock groups and the RMSD of Y2887.53 were chosen as reaction coordinates due to their role in activation. The PMF obtained was calculated using the following Eq. 1:46
| 1 |
where ξJ and ξI are the reaction coordinates, kB is the Boltzmann constant, T is the temperature, and ρ is the probability distribution.
Acknowledgments
The authors thank Aaron Freidman and Dahlia Goldfeld for valuable discussion. Computing time was provided on the Anton supercomputer, courtesy of D.E. Shaw Research.
Supporting Information
Additional Supporting Information may be found in the online version of this article.
Supplementary Information
References
- Jacobson KA. Introduction to adenosine receptors as therapeutic targets. In: Wilson CN, Mustafa SJ, editors. Adenosine receptors in health and disease. Berlin Heidelberg: Springer; 2009. [Google Scholar]
- Mills JH, Kim DG, Krenz A, Chen JF, Bynoe MS. A2A adenosine receptor signaling in lymphocytes and the central nervous system regulates inflammation during experimental autoimmune encephalomyelitis. J Immunol. 2012;188:5713–5722. doi: 10.4049/jimmunol.1200545. [DOI] [PMC free article] [PubMed] [Google Scholar]
- Hasko G, Linden J, Cronstein B, Pacher P. Adenosine receptors: therapeutic aspects for inflammatory and immune diseases. Nat Rev Drug Discov. 2008;7:759–770. doi: 10.1038/nrd2638. [DOI] [PMC free article] [PubMed] [Google Scholar]
- Vincenzi F, Corciulo C, Targa M, Merighi S, Gessi S, Casetta I, Gentile M, Granieri E, Borea PA, Varani K. Multiple sclerosis lymphocytes upregulate A2A adenosine receptors that are antiinflammatory when stimulated. Eur J Immunol. 2013;43:2206–2216. doi: 10.1002/eji.201343314. [DOI] [PubMed] [Google Scholar]
- Chen J-F, Eltzschig HK, Fredholm BB. Adenosine receptors as drug targets—what are the challenges? Nat Rev Drug Discov. 2013;12:265–286. doi: 10.1038/nrd3955. [DOI] [PMC free article] [PubMed] [Google Scholar]
- Morelli M, Carta AR, Jenner P. Adenosine A2A receptors and Parkinson's Disease. In: Wilson CN, Mustafa SJ, editors. Adenosine receptors in health and disease. Berlin Heidelberg: Springer; 2009. pp. 589–615. [DOI] [PubMed] [Google Scholar]
- Chen J-F, Chern Y. Impacts of methylxanthines and adenosine receptors on neurodegeneration: human and experimental studies. In: Fredholm BB, editor. Methylaxanthines. Berlin Heidelberg: Springer; 2011. pp. 267–310. [DOI] [PubMed] [Google Scholar]
- Mills JH, Thompson LF, Mueller C, Waickman AT, Jalkanen S, Niemela J, Airas L, Bynoe MS. CD73 is required for efficient entry of lymphocytes into the central nervous system during experimental autoimmune encephalomyelitis. Proc Natl Acad Sci USA. 2008;105:9325–9330. doi: 10.1073/pnas.0711175105. [DOI] [PMC free article] [PubMed] [Google Scholar]
- Doré AS, Robertson N, Errey JC, Ng I, Hollenstein K, Tehan B, Hurrell E, Bennett K, Congreve M, Magnani F, Tate CG, Weir M, Marshall FH. Structure of the adenosine A2A receptor in complex with ZM241385 and the xanthines XAC and caffeine. Structure. 2011;19:1283–1293. doi: 10.1016/j.str.2011.06.014. [DOI] [PMC free article] [PubMed] [Google Scholar]
- Congreve M, Andrews SP, Doré AS, Hollenstein K, Hurrell E, Langmead CJ, Mason JS, Ng IW, Tehan B, Zhukov A, Weir M, Marshall FH. Discovery of 1,2,4-triazine derivatives as adenosine A2A antagonists using structure based drug design. J Med Chem. 2012;55:1898–1903. doi: 10.1021/jm201376w. [DOI] [PMC free article] [PubMed] [Google Scholar]
- Jaakola V-P, Griffith MT, Hanson MA, Cherezov V, Chien EYT, Lane JR, Ijzerman AP, Stevens RC. The 2.6 angstrom crystal structure of a human A2A adenosine receptor bound to an antagonist. Science. 2008;322:1211–1217. doi: 10.1126/science.1164772. [DOI] [PMC free article] [PubMed] [Google Scholar]
- Hino T, Arakawa T, Iwanari H, Yurugi-Kobayashi T, Ikeda-Suno C, Nakada-Nakura Y, Kusano-Arai O, Weyand S, Shimamura T, Nomura N, Cameron AD, Kobayashi T, Hamakubo T, Iwata S, Murata T. G-protein-coupled receptor inactivation by an allosteric inverse-agonist antibody. Nature. 2012;482:237–240. doi: 10.1038/nature10750. [DOI] [PMC free article] [PubMed] [Google Scholar]
- Lebon G, Warne T, Edwards PC, Bennett K, Langmead CJ, Leslie AGW, Tate CG. Agonist-bound adenosine A2A receptor structures reveal common features of GPCR activation. Nature. 2011;474:521–525. doi: 10.1038/nature10136. [DOI] [PMC free article] [PubMed] [Google Scholar]
- Xu F, Wu H, Katritch V, Han GW, Jacobson KA, Gao ZG, Cherezov V, Stevens RC. Structure of an agonist-bound human A2A adenosine receptor. Science. 2011;332:322–327. doi: 10.1126/science.1202793. [DOI] [PMC free article] [PubMed] [Google Scholar]
- Rasmussen SGF, DeVree BT, Zou Y, Kruse AC, Chung KY, Kobilka TS, Thian FS, Chae PS, Pardon E, Calinski D, Mathiesen JM, Shah STA, Lyons JA, Caffrey M, Gellman SH, Steyaert J, Skiniotis G, Weis WI, Sunahara RK, Kobilka BK. Crystal structure of the β2 adrenergic receptor–Gs protein complex. Nature. 2011;477:549–555. doi: 10.1038/nature10361. [DOI] [PMC free article] [PubMed] [Google Scholar]
- Scheerer P, Park JH, Hildebrand PW, Kim YJ, Krauß N, Choe H-W, Hofmann KP, Ernst OP. Crystal structure of opsin in its G-protein-interacting conformation. Nature. 2008;455:497–502. doi: 10.1038/nature07330. [DOI] [PubMed] [Google Scholar]
- Kruse AC, Ring AM, Manglik A, Hu J, Hu K, Eitel K, Hubner H, Pardon E, Valant C, Sexton PM, Christopoulos A, Felder CC, Gmeiner P, Steyaert J, Weis WI, Garcia KC, Wess J, Kobilka BK. Activation and allosteric modulation of a muscarinic acetylcholine receptor. Nature. 2013;504:101–106. doi: 10.1038/nature12735. [DOI] [PMC free article] [PubMed] [Google Scholar]
- Palczweski K, Kumasaka T, Hori T, Behnke CA, Motoshima H, Fox BA, Le Trong I, Teller DC, Okada T, Stenkamp RE, Yamamota M, Miyano M. Crystal structure of rhodopsin: a G protein-coupled receptor. Science. 2000;289:739–745. doi: 10.1126/science.289.5480.739. [DOI] [PubMed] [Google Scholar]
- Haga K, Kruse AC, Asada H, Yurugi-Kobayashi T, Shiroishi M, Zhang C, Weis WI, Okada T, Kobilka BK, Haga T, Kobayashi T. Structure of the human M2 muscarinic acetylcholine receptor bound to an antagonist. Nature. 2012;482:547–551. doi: 10.1038/nature10753. [DOI] [PMC free article] [PubMed] [Google Scholar]
- Cherezov V, Rosenbaum DM, Hanson MA, Rasmussen SG, Thian FS, Kobilka TS, Choi HJ, Kuhn P, Weis WI, Kobilka BK, Stevens RC. High-resolution crystal structure of an engineered human beta2-adrenergic G protein-coupled receptor. Science. 2007;318:1258–1265. doi: 10.1126/science.1150577. [DOI] [PMC free article] [PubMed] [Google Scholar]
- Dror RO, Arlow DH, Maragakis P, Mildorf TJ, Pan AC, Xu H, Borhani DW, Shaw DE. Activation mechanism of the B2-adrenergic receptor. Proc Natl Acad Sci USA. 2011;108:18684–18689. doi: 10.1073/pnas.1110499108. [DOI] [PMC free article] [PubMed] [Google Scholar]
- Li J, Jonsson AL, Beuming T, Shelley JC, Voth GA. Ligand-dependent activation and deactivation of the human adenosine A2A receptor. J Am Chem Soc. 2013;135:8749–8759. doi: 10.1021/ja404391q. [DOI] [PMC free article] [PubMed] [Google Scholar]
- Pang X, Yang M, Han K. Antagonist binding and induced conformational dynamics of GPCR A2A adenosine receptor. Proteins. 2013;81:1399–1410. doi: 10.1002/prot.24283. [DOI] [PubMed] [Google Scholar]
- Miao Y, Nichols SE, Gasper PM, Metzger VT, McCammon JA. Activation and dynamic network of the M2 muscarinic receptor. Proc Natl Acad Sci USA. 2013;110:10982–10989. doi: 10.1073/pnas.1309755110. [DOI] [PMC free article] [PubMed] [Google Scholar]
- Leioatts N, Suresh P, Romo TD, Grossfield A. Structure-based simulations reveal concerted dynamics of GPCR activation. Proteins. 2014;82:2538–2551. doi: 10.1002/prot.24617. [DOI] [PMC free article] [PubMed] [Google Scholar]
- Tehan BG, Bortolato A, Blaney FE, Weir MP, Mason JS. Unifying family A GPCR theories of activation. Pharmacol Therap. 2014;143:51–60. doi: 10.1016/j.pharmthera.2014.02.004. [DOI] [PubMed] [Google Scholar]
- George L, Arnau C, Leonardo P. The G-protein coupled receptor family: actors with many faces. Curr Pharm Des. 2012;18:175–185. doi: 10.2174/138161212799040529. [DOI] [PubMed] [Google Scholar]
- Oates J, Watts A. Uncovering the intimate relationship between lipids, cholesterol and GPCR activation. Curr Opin Struct Biol. 2011;21:802–807. doi: 10.1016/j.sbi.2011.09.007. [DOI] [PubMed] [Google Scholar]
- Ng HW, Laughton CA, Doughty SW. Molecular dynamics simulations of the adenosine A2a receptor in POPC and POPE lipid bilayers: effects of membrane on protein behavior. J Chem Inform Model. 2014;54:573–581. doi: 10.1021/ci400463z. [DOI] [PubMed] [Google Scholar]
- Vilardaga J-P, Bunemann M, Krasel C, Castro M, Lohse MJ. Measurement of the millisecond activation switch of G protein-coupled receptors in living cells. Nature Biotechnol. 2003;21:807–812. doi: 10.1038/nbt838. [DOI] [PubMed] [Google Scholar]
- Gutierrez-de-Teran H, Massink A, Rodriguez D, Liu W, Han GW, Joseph JS, Katritch I, Heitman LH, Xia L, Ijzerman AP, Cherezov V, Katritch V, Stevens RC. The role of a sodium ion binding site in the allosteric modulation of the A(2A) adenosine G protein-coupled receptor. Structure. 2013;21:2175–2185. doi: 10.1016/j.str.2013.09.020. [DOI] [PMC free article] [PubMed] [Google Scholar]
- Ballesteros JA, Weinstein H. Integrated methods for the construction of three-dimensional models and computational probing of structure-dunction relations in G protein-coupled receptor. Methods Neurosci. 1995;25:366–428. [Google Scholar]
- Eswar N, Webb B, Marti-Renom MA, Madhusudhan MS, Eramian D, Shen M-Y, Pieper U, Sali A. Comparative protein structure modeling using MODELLER. Current Protoc Protein Sci. 2007;50:2.9.1–2.9.31. doi: 10.1002/0471140864.ps0209s50. [DOI] [PubMed] [Google Scholar]
- Humphrey W, Dalke A, Schulten K. VMD: visual molecular dynamics. J Mol Graph Model. 1996;14:33–38. doi: 10.1016/0263-7855(96)00018-5. [DOI] [PubMed] [Google Scholar]
- Gumbart J, Trabuco LG, Schreiner E, Villa E, Schulten K. Regulation of the protein-conducting channel by a bound ribosome. Structure. 2009;17:1453–1464. doi: 10.1016/j.str.2009.09.010. [DOI] [PMC free article] [PubMed] [Google Scholar]
- Li H, Robertson AD, Jensen JH. Very fast empirical prediction and rationalization of protein pKa values. Proteins. 2005;61:704–721. doi: 10.1002/prot.20660. [DOI] [PubMed] [Google Scholar]
- Klauda JB, Venable RM, Freites JA, O'Connor JW, Tobias DJ, Mondragon-Ramirez C, Vorobyov I, MacKerell AD, Pastor RW. Update of the CHARMM all-atom additive force field for lipids: validation on six lipid types. J Phys Chem B. 2010;114:7830–7843. doi: 10.1021/jp101759q. [DOI] [PMC free article] [PubMed] [Google Scholar]
- Phillips JC, Braun R, Wang W, Gumbart J, Tajkhorshid E, Villa E, Chipot C, Skeel RD, Kalé L, Schulten K. Scalable molecular dynamics with NAMD. J Comp Chem. 2005;26:1781–1802. doi: 10.1002/jcc.20289. [DOI] [PMC free article] [PubMed] [Google Scholar]
- MacKerell AD, Feig M, Brooks CL. Improved treatment of the protein backbone in empirical force fields. J Am Chem Soc. 2004;126:398–699. doi: 10.1021/ja036959e. 3rd. [DOI] [PubMed] [Google Scholar]
- Mackerell AD, Bellott M, Jr, Evanseck JD, Field MH, Fischer S, Gao J, Guo H, Ha S, Joseph-McCarthy D, Kuchnir L, Kuczera K, Lau FTK, Mattos C, Michnick S, Ngo T, Nguyen DT, Prodhom B, Reiher WE, Roux B, Schlenkrich M, Smith JC, Stote R, Watanabe M, Wiorkieqicz-Kuczera J, Yin D, Karplus M. All-atom empirical potential for molecular modeling and dynamics studies of proteins. J Chem Phys. 1998;102:3586–3616. doi: 10.1021/jp973084f. [DOI] [PubMed] [Google Scholar]
- Essmann U, Perera L, Berkowitz ML, Darden T, Lee H, Pedersen LG. A smooth particle mesh Ewald method. J Chem Phys. 1995;103:8577–8577. [Google Scholar]
- Andersen HC. Rattle: A “Velocity” version of the Shake algorithm for molecular dynamics calculations. J Comp Phys. 1983;52:24–34. [Google Scholar]
- Shaw DE, Dror RO, Salmon JK, Grossman JP, Mackenzie KM, Bank JA, Young C, Deneroff MM, Baston B, Bowers KK, Chow E, Eastwood MP, Ierardi DJ, Klepeis JL, Kuskin JS, Larson RH, Lindorff-Larsen K, Maragakis P, Moraes MA, Piana S, Shan Y, Towles B. 2009. ) Millisecond-scale molecular dynamics simulations on Anton, In: Proceedings of the 2009 ACM/IEEE Conference on Supercomputing (SC09), ACM Press, Portland, OR.
- Krautles V, Van Gunsteren WF, Hunenberger PH. A fast SHAKE algorithm to solve distance constraint equations for small molecules in molecular dynamic simulations. J Comp Chem. 2001;22:501–508. [Google Scholar]
- Shan Y, Klepeis JL, Eastwood MP, Dror RO, Shaw DE. Gaussian split Ewald: a fast Ewald mesh method for molecular simulation. J Chem Phys. 2005;122:54101. doi: 10.1063/1.1839571. [DOI] [PubMed] [Google Scholar]
- Roux B. The calculation of the potential of mean force using computer simulations. Comp Phys Commun. 1995;91:275–282. [Google Scholar]
- Park JH, Scheerer P, Hofmann KP, Choe H-W, Ernst OP. Crystal structure of the ligand-free G-protein-coupled receptor opsin. Nature. 2008;454:183–187. doi: 10.1038/nature07063. [DOI] [PubMed] [Google Scholar]
Associated Data
This section collects any data citations, data availability statements, or supplementary materials included in this article.
Supplementary Materials
Supplementary Information


