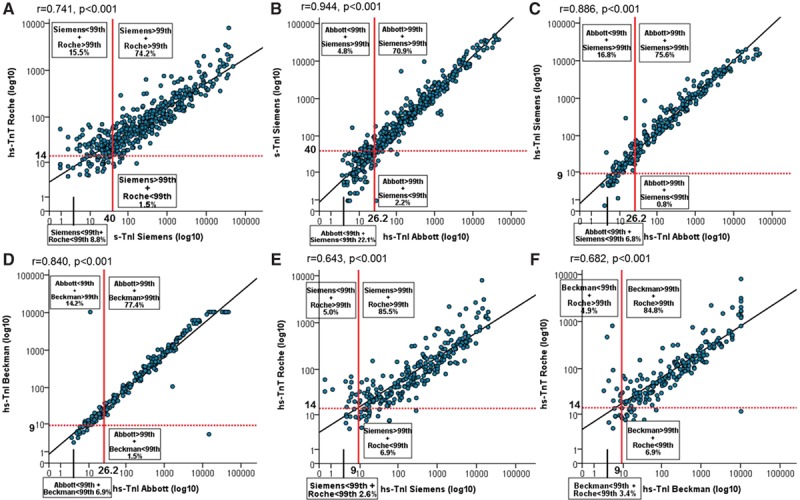
Figure 4.

Distribution of sensitive cardiac troponin (s-Tn) and high-sensitivity cardiac troponin (hs-Tn) I and T values at presentation in quadrants according to the approved uniform clinical decision values in patients with an adjudicated diagnosis of acute myocardial infarction. A, Pairs of hs-TnT and s-TnI Ultra (Siemens); (B) pairs of hs-TnI (Abbott) and s-TnI Ultra (Siemens); (C) pairs of hs-TnI (Abbott) and hs-TnI (Siemens); (D) pairs of hs-TnI (Abbott) and hs-TnI (Beckman Coulter); (E) pairs of hs-TnT and hs-TnI (Siemens); and (F) pairs of hs-TnT and hs-TnI (Beckman Coulter).
