89Zr-oxine complex cell labeling enables highly sensitive in vivo cell tracking with PET without interfering with cell survival, proliferation, or function.
Abstract
Purpose
To develop a clinically translatable method of cell labeling with zirconium 89 (89Zr) and oxine to track cells with positron emission tomography (PET) in mouse models of cell-based therapy.
Materials and Methods
This study was approved by the institutional animal care committee. 89Zr-oxine complex was synthesized in an aqueous solution. Cell labeling conditions were optimized by using EL4 mouse lymphoma cells, and labeling efficiency was examined by using dendritic cells (DCs) (n = 4), naïve (n = 3) and activated (n = 3) cytotoxic T cells (CTLs), and natural killer (NK) (n = 4), bone marrow (n = 4), and EL4 (n = 4) cells. The effect of 89Zr labeling on cell survival, proliferation, and function were evaluated by using DCs (n = 3) and CTLs (n = 3). Labeled DCs (444–555 kBq/[5 × 106] cells, n = 5) and CTLs (185 kBq/[5 × 106] cells, n = 3) transferred to mice were tracked with microPET/CT. In a melanoma immunotherapy model, tumor targeting and cytotoxic function of labeled CTLs were evaluated with imaging (248.5 kBq/[7.7 × 106] cells, n = 4) and by measuring the tumor size (n = 6). Two-way analysis of variance was used to compare labeling conditions, the Wilcoxon test was used to assess cell survival and proliferation, and Holm-Sidak multiple tests were used to assess tumor growth and perform biodistribution analyses.
Results
89Zr-oxine complex was synthesized at a mean yield of 97.3% ± 2.8 (standard deviation). It readily labeled cells at room temperature or 4°C in phosphate-buffered saline (labeling efficiency range, 13.0%–43.9%) and was stably retained (83.5% ± 1.8 retention on day 5 in DCs). Labeling did not affect the viability of DCs and CTLs when compared with nonlabeled control mice (P > .05), nor did it affect functionality. 89Zr-oxine complex enabled extended cell tracking for 7 days. Labeled tumor-specific CTLs accumulated in the tumor (4.6% on day 7) and induced tumor regression (P < .05 on day 7).
Conclusion
We have developed a 89Zr-oxine complex cell tracking technique for use with PET that is applicable to a broad range of cell types and could be a valuable tool with which to evaluate various cell-based therapies.
© RSNA, 2015
Introduction
Cell-based therapies for cancer involving dendritic cell (DC) vaccines and adoptive transfer of activated ex vivo expanded cells (eg, T and natural killer [NK] cells) have proven effective in a variety of settings (1–4). The emergence of genetically engineered T cells expressing chimeric antigen receptor (5–7), together with modulations of immune checkpoints (eg, inhibition of PD1/PDL-1 system) (8,9), has renewed interest in cell-based therapies. Therapy efficacy relies on the successful trafficking of cells to their intended targets. Currently, monitoring transferred cell migration requires biopsy in patients, making it difficult to assess the effect of cell modifications on enhancing migration to the target organs.
Existing preclinical cell tracking techniques have limited clinical applications. Bioluminescence imaging with use of luciferase reporter genes and optical imaging with use of dye-labeled cells are not practical for whole-body imaging because of the limited tissue penetration of light (10). Moreover, bioluminescence imaging requires transfection of luciferase, whose immunogenicity cannot be excluded (11,12). Magnetic resonance (MR) imaging with iron nanoparticle–loaded cells has limited sensitivity due to the negative contrast of iron superimposed on a highly heterogeneous background (13–15). Although techniques that use perfluorocarbon agents to label cells ex vivo and visualize positive signals with fluorine 19 (19F) MR imaging have been rapidly developing, the requirement of a dedicated coil installation and relatively weak signal of 19F could still be constraints (16–19).
Radiolabeling of cells has several potential advantages and disadvantages. Administered radiolabeled cells can be monitored in the whole body with very high label-to-background ratios by using single photon emission computed tomography (SPECT) and positron emission tomography (PET). Because SPECT has inherently lower sensitivity and lower resolution compared with those of PET, indium 111–oxine labeling, the classic cell labeling method (20–22), requires relatively high levels of radioactivity, which could induce cellular damage. Another SPECT cell labeling agent, technetium 99m (99mTc) hexamethylpropyleneamine oxime, cannot be used for long-term cell tracking because of the short half-life of 99mTc (6 hours). Furthermore, efflux of 99mTc from the cells creates undesirable background signals (23–25). When compared with SPECT, PET is at least 10 times more sensitive, potentiating reduction of radioexposure of the cells by one log (26). Fluorine 18 (18F) fluorodeoxyglucose (FDG) has been used to label cells ex vivo, however, the half-life of 18F is short (109.7 minutes); moreover, dormant or inactivated cells with low glucose metabolism take up insufficient 18F FDG, and the cells can release 18F FDG via phosphatase activity (27,28).
To lower radiation exposure while still obtaining high sensitivity, resolution, specificity, and sufficient duration to track the cells over multiple days, a long-lived positron-emitting radioisotope is required. Zirconium 89 (89Zr) is a cyclotron-produced PET isotope with a half-life of 3.27 days. The purpose of this study was to develop a clinically translatable method of cell labeling using 89Zr and oxine (hereafter, 89Zr-oxine complex) to track cells with PET in mosue models of cell-based therapy.
Materials and Methods
The authors (N.S., H.W., G.L.G., P.L.C.) have filed U.S. Patent Application No. 61/973,706 for generation and application of the 89Zr-oxine complex used in this study.
Mice and Cells
All animal experiments were approved by the institutional animal care committee. C57BL/6 wild-type, recombination-activating gene 1 (RAG1)-deficient, and OT-1 T-cell receptor (TCR) transgenic mice against ovalubumin (OVA) were purchased from Jackson Laboratories (Bar Harbor, Me). DCs and NK cells were derived from bone marrow, and naïve cytotoxic T cells (CTLs) were purified from the spleen. DCs were activated by lipopolysaccharide stimulation, and CTLs were activated by TCR stimulation (Appendix E1 [online]). EL4 is a murine lymphoma cell line (American Type Culture Collection, Manassas, Va). B16 murine melanoma cells expressing OVA (B16-OVA) were a gift from J.G. Frelinger and E.M. Lord (29).
89ZrCl4 Production
89Zr was produced at the institutional cyclotron facility by using the nuclear reaction Y (p, 2n)89Zr and an in-house GE PETtrace beamline (GE Healthcare, Piscataway, NJ) (30), with modifications to a previously described method (31) (Appendix E2 [online]). Eluted 89Zr-oxalate solution was loaded onto a C18 Sep-Pak cartridge (Waters, Milford, Mass) and washed with water. 89ZrCl4 was obtained after elution with 1-N HCl (0.5 mL).
Synthesis of 89Zr-Oxine Complex
Nonradioactive Zr(oxine)4 standard was synthesized by following a method reported previously (32). 89Zr-oxine complex was generated by conjugating oxine to 89Zr at room temperature. Oxine in 0.04 N HCl (102 µL, 20 mmol/L) and 89ZrCl4 (60 µL, 25.9–40.5 MBq) were mixed in the presence of Tween 80 (4 µL, 20%) (Sigma-Aldrich, St Louis, Mo). A total of 220 µL NaHCO3 (500 mmol/L) was slowly added to this solution while it was spun in a vortex, thereby allowing chelation of 89Zr by oxine to take place while neutral oxine was released from its acidic forms. Final pH ranged from 7.0 to 7.2. Synthesis yield was determined with high-performance liquid chromatography analyses and chloroform extraction (Appendix E3 [online]).
89Zr-Oxine Complex Cell Labeling
For various in vitro experiments, cells were labeled with 89Zr-oxine complex as follows. 89Zr-oxine solution (88–660 kBq) and 106 cells in phosphate-buffered saline were incubated at room temperature for 15 minutes at 1:25 or 1:50 volume ratios. For comparison, labeling was also performed in serum-free medium or in complete culture medium at 37°C or 4°C. The cells were washed with complete medium twice and with phosphate-buffered saline once. For in vivo imaging, 0.37–1.67 kBq of 89Zr-oxine complex was added to 5 × 10⁶ cells at a 1:25 volume ratio.
Determination of Viability of Cells and Release of 89Zr from Dead Cells
After 89Zr-oxine complex labeling, DCs were cultured with granulocyte-macrophage colony stimulating factor (20 ng/mL), and CTLs underwent TCR activation followed by withdrawal of the stimulation. At various time points, the number of surviving cells was counted by using trypan blue. Radioactivity of the cell pellet was measured with a gamma counter (WIZARD2 Automatic Gamma Counter; Perkin Elmer, Waltham, Mass) to determine the activity retained in the cells. Three activity standards were also counted each time for the decay correction.
Determination of Functionality of 89Zr-Oxine–labeled Cells
89Zr-oxine–labeled and nonlabeled CTLs were stimulated with TCRs and evaluated for their expression of CD3, CD8, CD44, CD25, CD69, interferon-γ, and interleukin-2 with flow cytometry (FACSCalibur; BD Biosciences, San Jose, Calif). Similarly, DCs were stimulated with lipopolysaccharide, and surface expression of CD11c, CD80, CD86, CD40, and major histocompatibility complex class I and II was examined. In another experiment, 106 89Zr-labeled DCs were loaded with OVA in the presence of lipopolysaccharide overnight, transferred to RAG1 knockout mice expressing Thy1.2 that were preinjected 1 day before with 5 × 10⁶ Thy1.1+ naïve OT-1 CTLs labeled with 5-chloromethylfluorescein diacetate (CMFDA) (Life Technologies, Grand Island, NY). Peripheral blood and splenocytes were collected 3.5 days later, and CMFDA dilution in OT-1 CTLs was analyzed by using flow cytometry gated on Thy1.1+CD8+ T cells. All antibodies were purchased from eBiosciences (San Diego, Calif), and flow cytometry data were analyzed by using FlowJo software (Tree Star, Ashland, Ore).
TrackIng of 89Zr-labeled DCs and T Cells with MicroPET/CT
For tracking, 5 × 10⁶ 89Zr-labeled DCs (444–555 kBq) and naïve CTLs (148–185 kBq) were transferred to mice intraveneously (n = 5 and n = 3, respectively). For the immunotherapy model, RAG1 knockout mice inoculated with 4 × 10⁶ B16-OVA cells injected intramuscularly in the right flank were, 7 days later, intravenously transferred with 106 wild-type splenocytes; this was followed 6 hours later by 7.7 × 10⁶ 89Zr-labeled OT-1 CTLs (248.5 kBq) activated by OVA peptide. MicroPET/CT images (BioPET, Bioscan, Washington, DC) were acquired for up to 7 days (400–700-keV energy window, 5–40-minute emission scan per bed position, total of two bed positions). Images were reconstructed with a three-dimensional ordered-subsets expectation maximization algorithm. The maximum intensity projection images were fused with CT images by using InVivoScope software (Bioscan). Radioactivity in the tumor and whole body was quantified by setting a volume of interest on the tumor and whole body on the acquired images with MIMvista software (MIM Software, Cleveland, Ohio). Tumor size was measured by using a caliper, and volume (V, measured in cubic millimeters) was calculated with the following formula: V = 1/2 x L x W 2, where L is length and W is width (89Zr-labeled OT-1 CTL–treated mice, n = 6; nontreated mice, n = 5).
Statistical Analysis
P values less than .05, calculated by using GraphPad Prism software (GraphPad Software, La Jolla, Calif), were considered to indicate a significant difference. Two-way analysis of variance was used to compare labeling conditions (n = 3), the Wilcoxon test was used to obtain two-sided global P values for cell survival or proliferation (n = 3), and Holm-Sidak multiple tests were used for tumor growth (n = 6 vs n = 5 for treated vs control mice, three tests were included) and biodistribution analyses (n = 5, six tests for percentage injected dose and nine tests for percentage injected dose per gram of tissue).
Results
89Zr-Oxine Complex Was Synthesized in an Aqueous Condition
The synthesis of 89Zr-oxine complex was accomplished with 97.3% ± 2.8 (standard deviation, n = 8) yield within several minutes, as determined with chloroform extraction analyses. The formed complex showed one radioactive peak at high-performance liquid chromatography (Fig E1a [online]) with retention time of the peak (tR) relevant to the Zr(oxine)4 standard with a time delay for reaching the radioactive detector (tR[oxine], 9.75 min; tR[Zr{oxine}4], 8.35 min; tR[89Zr-oxine complex], 8.74 min). The formed complex (Fig E1b [online]) was used for cell labeling without further purification.
89Zr-Oxine Labeling Did Not Depend on Active Cellular Incorporation
To determine the optimal labeling conditions, we compared cell labeling at 37°C, room temperature, and 4°C by using EL4 cells. The highest radioactivity incorporation was achieved when cells were labeled at room temperature or 4°C in phosphate-buffered saline ([5.8 or 5.7] × 106 cpm, respectively; P < .05 vs cells labeled at 37°C [3.9 × 10⁶ cpm]) (Fig 1a). This suggests that cell labeling does not depend on active cellular internalization of the 89Zr-oxine complex. The labeling efficiency slightly decreased when labeled in serum-free media at room temperature or 4°C. Use of complete cell media at room temperature or 4°C decreased the labeling efficiency to about 60%–76% of that in phosphate-buffered saline (P < .05). The labeling at 37°C was low under all buffer conditions.
Figure 1a:
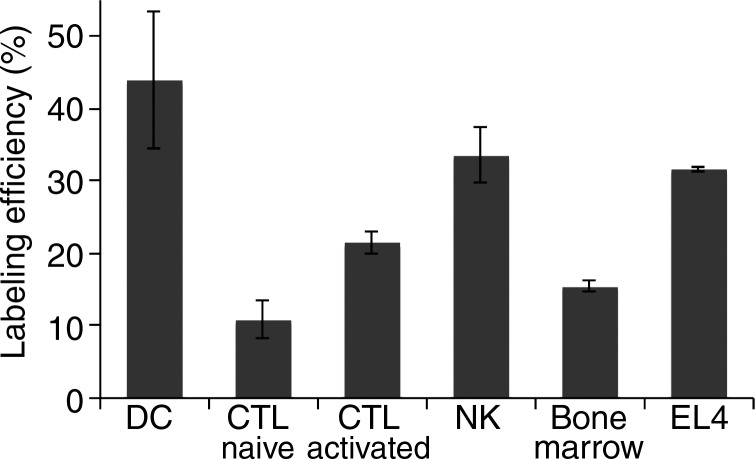
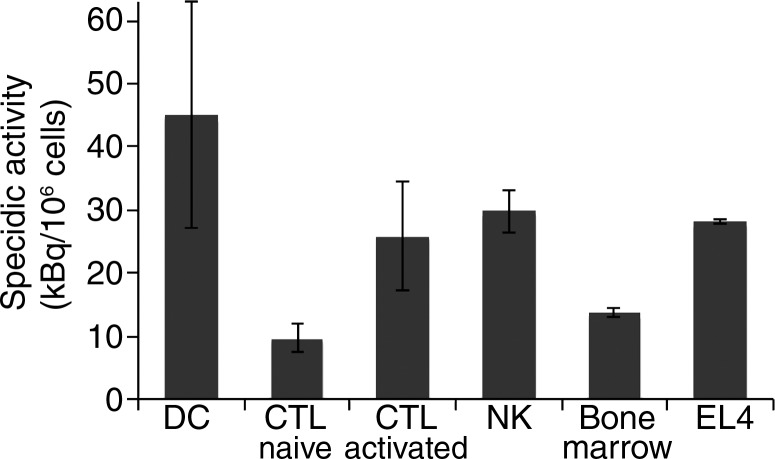
Graphs show 89Zr-oxine labeling of various cell types did not require active cellular incorporation. (a) One million EL4 cells were incubated with the 89Zr-oxine complex at 1:50 volume ratios in phosphate-buffered saline (PBS), serum-free medium, or complete medium at 37°C, room temperature (RT ), or 4°C for 15 minutes. Radioactivity associated with the cells was determined (n = 3, representative of two independent experiments, Y indicates P < .05 at two-way analysis of variance). (b) Labeling efficiency and (c) specific activity of DCs, naïve and activated CTLs, and NK, bone marrow, and EL4 cells (DC and naïve and activated CTLs: n = 4; NK, bone marrow, and EL4 cells: n = 3). Error bars indicate standard deviation.
89Zr-Oxine Complex Labeled a Variety of Cell Types
Next, we determined if the 89Zr-oxine complex could be used to label various cell types commonly used in cell-based therapies. The 89Zr-oxine complex successfully labeled all the cell types tested, with labeling efficiencies ranging from 13.0% ± 1.4 (naïve CTLs) to 43.9% ± 17.4 (DCs) (Fig 1b). Accordingly, the specific activity ranged from 9.7 kBq/106 cells ± 2.2 for naïve CTLs to 45.0 kBq/106 cells ± 18.0 for DCs (Fig 1c).
Figure 1b:
Graphs show 89Zr-oxine labeling of various cell types did not require active cellular incorporation. (a) One million EL4 cells were incubated with the 89Zr-oxine complex at 1:50 volume ratios in phosphate-buffered saline (PBS), serum-free medium, or complete medium at 37°C, room temperature (RT ), or 4°C for 15 minutes. Radioactivity associated with the cells was determined (n = 3, representative of two independent experiments, Y indicates P < .05 at two-way analysis of variance). (b) Labeling efficiency and (c) specific activity of DCs, naïve and activated CTLs, and NK, bone marrow, and EL4 cells (DC and naïve and activated CTLs: n = 4; NK, bone marrow, and EL4 cells: n = 3). Error bars indicate standard deviation.
Figure 1c:
Graphs show 89Zr-oxine labeling of various cell types did not require active cellular incorporation. (a) One million EL4 cells were incubated with the 89Zr-oxine complex at 1:50 volume ratios in phosphate-buffered saline (PBS), serum-free medium, or complete medium at 37°C, room temperature (RT ), or 4°C for 15 minutes. Radioactivity associated with the cells was determined (n = 3, representative of two independent experiments, Y indicates P < .05 at two-way analysis of variance). (b) Labeling efficiency and (c) specific activity of DCs, naïve and activated CTLs, and NK, bone marrow, and EL4 cells (DC and naïve and activated CTLs: n = 4; NK, bone marrow, and EL4 cells: n = 3). Error bars indicate standard deviation.
Labeling with 89Zr-Oxine Complex Did Not Interfere with Cell Survival or Proliferation
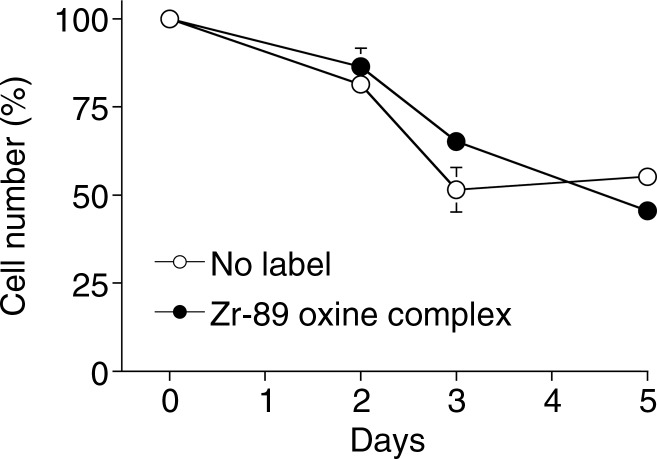
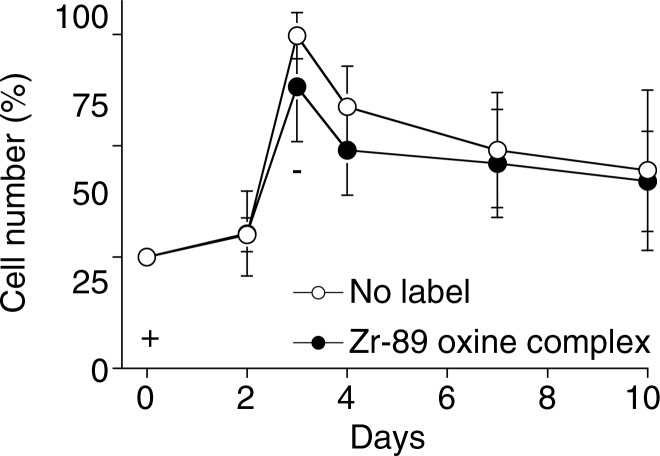
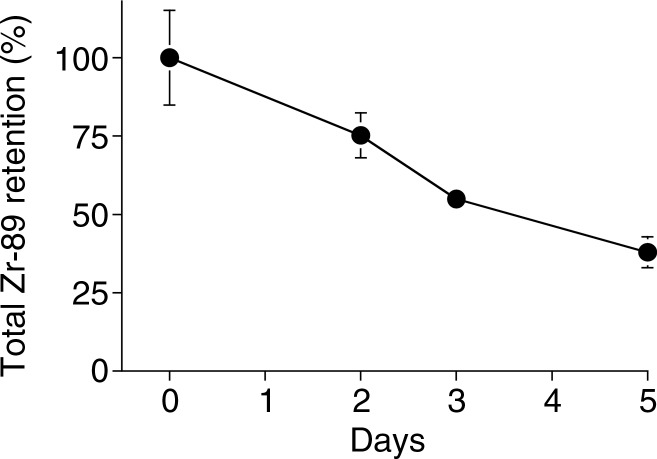
Because it is critical that the labeled cells remain viable and functional, we examined survival and proliferation of the cells after labeling. 89Zr-oxine–labeled mature DCs demonstrated similar survival as compared with nonlabeled cells up to 5 days after labeling (Fig 2a, P = .75). In addition, proliferation was examined for 89Zr-oxine–labeled CTLs. We first determined the maximum tolerated radioactive dose for radiosensitive CTLs by using preactivated OT-1 CTLs labeled at increasing specific activities. At specific activities less than 88.8 kBq/106 cells, the effect of labelling on proliferation was minimal compared with nonlabeled cells (Fig E2 [online]). Thus, we labeled CTLs at approximately 37 kBq/106 cells that still enabled PET imaging. Labeled CTLs rapidly proliferated at TCR stimulation and underwent contraction when the stimulation was terminated, similar to nonlabeled control cells (Fig 3a, P = .125).
Figure 2a:
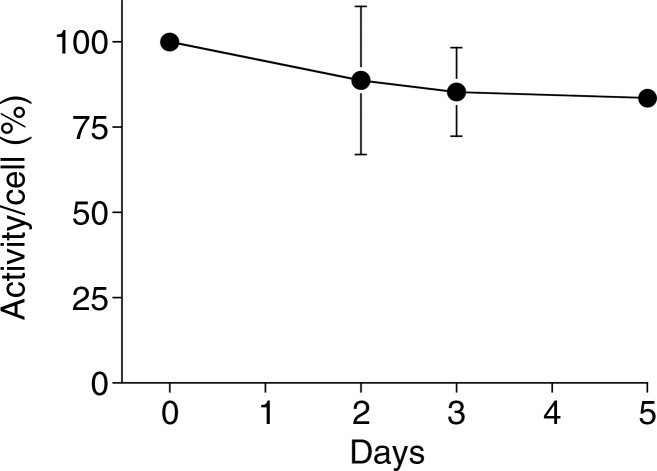
Graphs show 89Zr-oxine labeling did not interfere with survival of DCs. (a) DCs with and without 89Zr-oxine labeling showed similar viability (n = 3, representative of two independent experiments, two-sided global P = .75 at Wilcoxon test). (b) 89Zr-oxine complex associated with DCs was parallel to the number of surviving DCs. (c) The specific activity of DCs was maintained. Error bars indicate standard deviation.
Figure 3a:
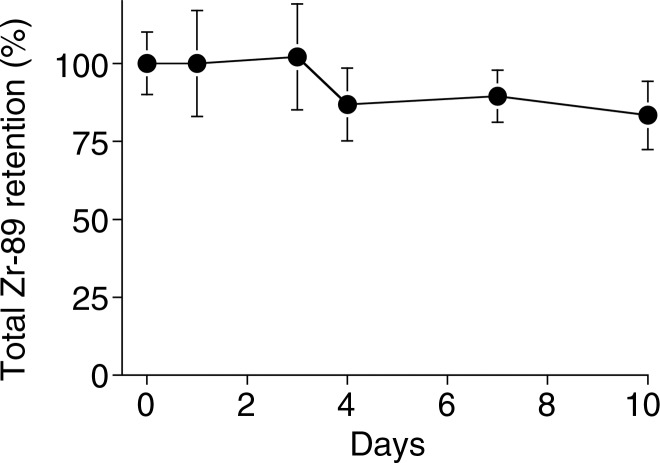
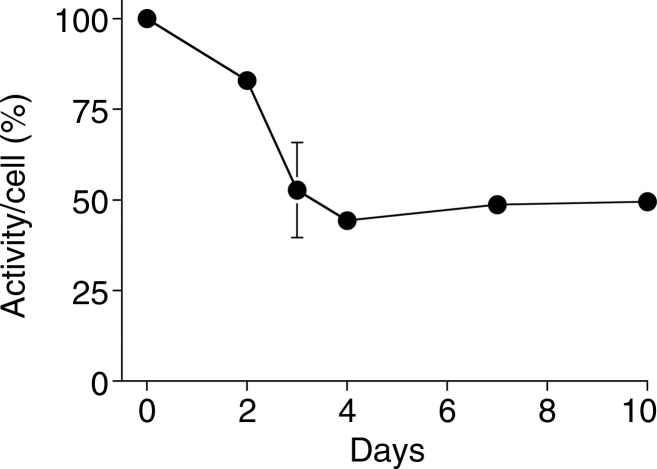
Graphs show 89Zr-oxine labeling did not interfere with survival and proliferation of CTLs. (a) CTLs with and without 89Zr-oxine labeling underwent similar proliferation at TCR stimulation on day 0 (+) followed by a contraction phase after withdrawal of the stimulation on day 3 (-) (n = 3, representative of two independent experiments, two-sided global P = .125 at Wilcoxon test). (b) 89Zr-oxine complex was retained in CTLs during rapid proliferation. A decrease was observed when the cell number decreased in the contraction phase. (c) The specific activity of CTLs declined during the expansion phase but was maintained after the contraction phase. Error bars indicate standard deviations.
Figure 2b:
Graphs show 89Zr-oxine labeling did not interfere with survival of DCs. (a) DCs with and without 89Zr-oxine labeling showed similar viability (n = 3, representative of two independent experiments, two-sided global P = .75 at Wilcoxon test). (b) 89Zr-oxine complex associated with DCs was parallel to the number of surviving DCs. (c) The specific activity of DCs was maintained. Error bars indicate standard deviation.
Figure 2c:
Graphs show 89Zr-oxine labeling did not interfere with survival of DCs. (a) DCs with and without 89Zr-oxine labeling showed similar viability (n = 3, representative of two independent experiments, two-sided global P = .75 at Wilcoxon test). (b) 89Zr-oxine complex associated with DCs was parallel to the number of surviving DCs. (c) The specific activity of DCs was maintained. Error bars indicate standard deviation.
Figure 3b:
Graphs show 89Zr-oxine labeling did not interfere with survival and proliferation of CTLs. (a) CTLs with and without 89Zr-oxine labeling underwent similar proliferation at TCR stimulation on day 0 (+) followed by a contraction phase after withdrawal of the stimulation on day 3 (-) (n = 3, representative of two independent experiments, two-sided global P = .125 at Wilcoxon test). (b) 89Zr-oxine complex was retained in CTLs during rapid proliferation. A decrease was observed when the cell number decreased in the contraction phase. (c) The specific activity of CTLs declined during the expansion phase but was maintained after the contraction phase. Error bars indicate standard deviations.
89Zr activity associated with DCs was stable and mirrored the number of surviving DCs, resulting in a stable specific activity (Fig 2) (retained 89Zr per cell, 83.5% ± 1.8 on day 5). Total radioactivity associated with the CTLs did not decrease, while T cells underwent cell division; however, radioactivity decreased during the contraction phase (Fig 3). As a result, specific activity of the CTLs decreased during the expansion phase but did not change during the contraction phase (Fig 3c). These results suggest that once 89Zr is incorporated into cells, it remains within the cells during cell division, although it is likely released upon cell death.
Figure 3c:
Graphs show 89Zr-oxine labeling did not interfere with survival and proliferation of CTLs. (a) CTLs with and without 89Zr-oxine labeling underwent similar proliferation at TCR stimulation on day 0 (+) followed by a contraction phase after withdrawal of the stimulation on day 3 (-) (n = 3, representative of two independent experiments, two-sided global P = .125 at Wilcoxon test). (b) 89Zr-oxine complex was retained in CTLs during rapid proliferation. A decrease was observed when the cell number decreased in the contraction phase. (c) The specific activity of CTLs declined during the expansion phase but was maintained after the contraction phase. Error bars indicate standard deviations.
Labeling with 89Zr-Oxine Complex Did Not Interfere with Functionality of DCs and CTLs
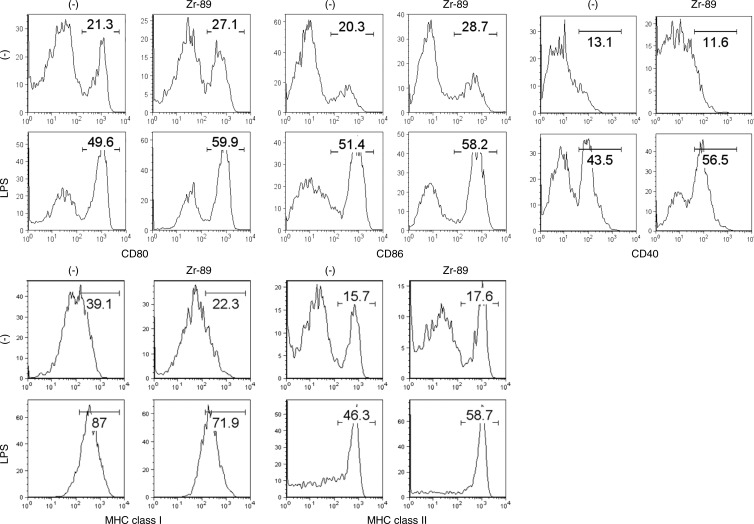
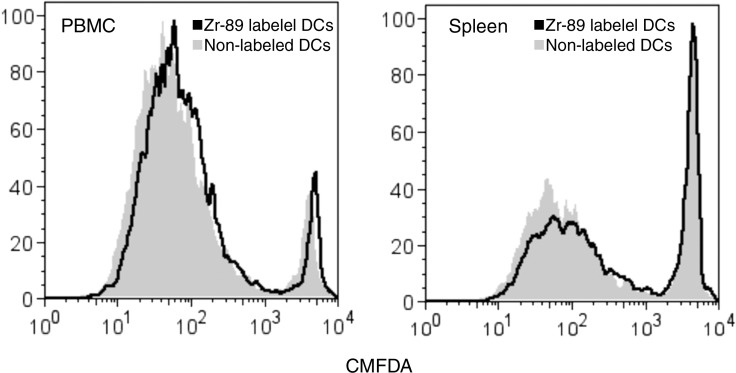
To determine if 89Zr-oxine–labeled cells remain functional, labeled DCs were stimulated with a Toll-like receptor ligand, lipopolysaccharide. 89Zr-oxine labeling slightly up-regulated the expression of CD80 and CD86 on DCs prior to lipopolysaccharide activation. After overnight stimulation with lipopolysaccharide, 89Zr-oxine–labeled DCs up-regulated CD80, CD86, CD40, and major histocompatibility complex molecules, similar to nonlabeled DCs (Fig 4a). When mice pretransferred with CMFDA-labeled naïve OT-1 CTLs were immunized using 89Zr-oxine–labeled DCs loaded with OVA, labeled DCs were capable of presenting the antigen and inducing OT-1 CTL activation and nonlabeled DCs (Fig 4b).
Figure 4a:
Flow cytometry data show 89Zr-oxine–labeled DCs maintained their functional activity. (a) 89Zr-oxine–labeled DCs showed upregulation of co-receptors and major histocompatibility complex (MHC) molecules comparable to nonlabeled cells (representative data of three experiments). (b) Graphs show in vivo transferred 89Zr-oxine–labeled OVA-loaded DCs were capable of inducing activation of pretransferred antigen-specific CMFDA-labeled OT-1 T cells (representative data of three experiments).
Figure 4b:
Flow cytometry data show 89Zr-oxine–labeled DCs maintained their functional activity. (a) 89Zr-oxine–labeled DCs showed upregulation of co-receptors and major histocompatibility complex (MHC) molecules comparable to nonlabeled cells (representative data of three experiments). (b) Graphs show in vivo transferred 89Zr-oxine–labeled OVA-loaded DCs were capable of inducing activation of pretransferred antigen-specific CMFDA-labeled OT-1 T cells (representative data of three experiments).
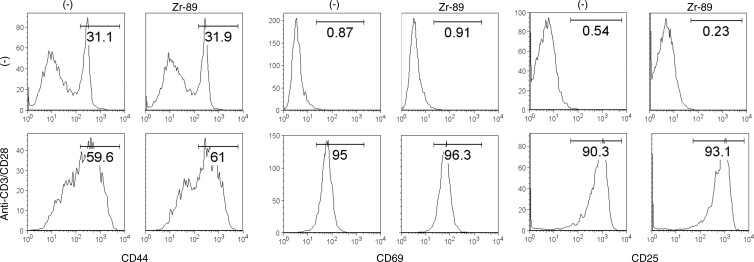
We further determined the effect of 89Zr-oxine labeling on CTL function. TCR stimulation induced up-regulation of CD69, CD25, and CD44 markers in the 89Zr-oxine–labeled and nonlabeled CTLs at similar levels (Fig 5a). The labeling did not impair the production of interferon-γ and interleukin-2 (Fig 5b), suggesting that the cytotoxic functions of CTLs were maintained after labeling.
Figure 5a:
Flow cytometry data show 89Zr-oxine–labeled and nonlabeled CTLs were activated by TCR stimulation equally. (a) 89Zr-oxine–labeled and nonlabeled CTLs expressed CD44, CD69, and CD25 at similar levels at the resting state and upregulated these markers after TCR stimulation (representative data of three experiments). (b) 89Zr-oxine–labeled cells were capable of producing interferon-γ (FN-γ) and interleukin-2 (IL-2) at TCR activation (representative data of three experiments). Red line indicate TCR-stimulated cells. Blue line indicates unstimulated cells.
Figure 5b:
Flow cytometry data show 89Zr-oxine–labeled and nonlabeled CTLs were activated by TCR stimulation equally. (a) 89Zr-oxine–labeled and nonlabeled CTLs expressed CD44, CD69, and CD25 at similar levels at the resting state and upregulated these markers after TCR stimulation (representative data of three experiments). (b) 89Zr-oxine–labeled cells were capable of producing interferon-γ (FN-γ) and interleukin-2 (IL-2) at TCR activation (representative data of three experiments). Red line indicate TCR-stimulated cells. Blue line indicates unstimulated cells.
89Zr-Oxine Complex Enabled Visualization of DCs and CTLs in Vivo at MicroPET/CT
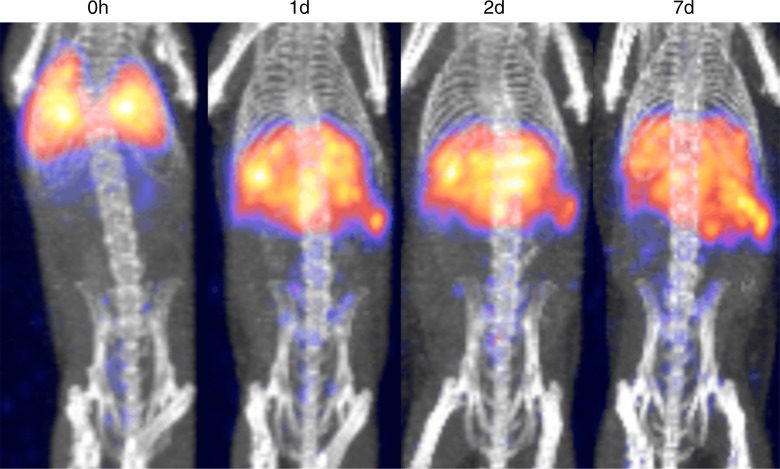
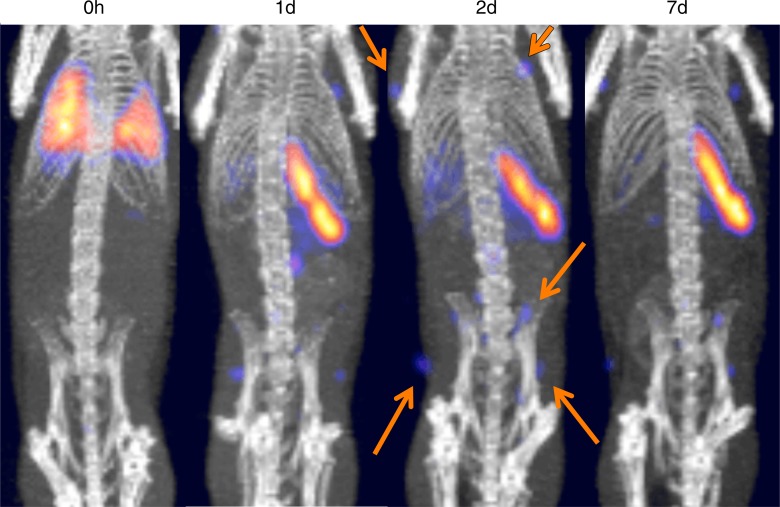
DCs labeled with 89Zr-oxine complex were visualized in vivo with microPET/CT. DCs (444–555 kBq/[5 × 106] cells) initially were distributed in the lungs and gradually migrated to the spleen and liver by day 1, where they stayed for the remainder of the 7-day imaging period (Fig 6a). This distribution was confirmed with a biodistribution study in which we analyzed the radioactivity of each organ harvested from the mice on days 1 and 7 (Appendix E4, Fig E3 [online]). The low activity seen in the kidneys and femur (6.7% injected dose per gram of tissue [ID/g] and 13.6% ID/g, respectively, at day 7) was likely due to free 89Zr released from dead cells.
Figure 6a:
MicroPET/CT images show differential trafficking of DCs and naïve CTLs over 7 days in wild-type mice. (a) DCs migrated to the spleen and liver after transiting the lungs (representative images of five experiments). (b) Naïve CTLs mainly homed to the spleen and lymph nodes (representative images of three experiments). Arrows indicate examples of lymph node accumulation of CTLs.
CTLs labeled with 89Zr-oxine complex (185 kBq/5 × 106 cells) were tracked over 7 days. In contrast to DCs, CTLs mainly distributed in the spleen and lymph nodes after migrating out from the lungs (Fig 6b).
Figure 6b:
MicroPET/CT images show differential trafficking of DCs and naïve CTLs over 7 days in wild-type mice. (a) DCs migrated to the spleen and liver after transiting the lungs (representative images of five experiments). (b) Naïve CTLs mainly homed to the spleen and lymph nodes (representative images of three experiments). Arrows indicate examples of lymph node accumulation of CTLs.
89Zr-Oxine–labeled CTLs Targeted Tumor
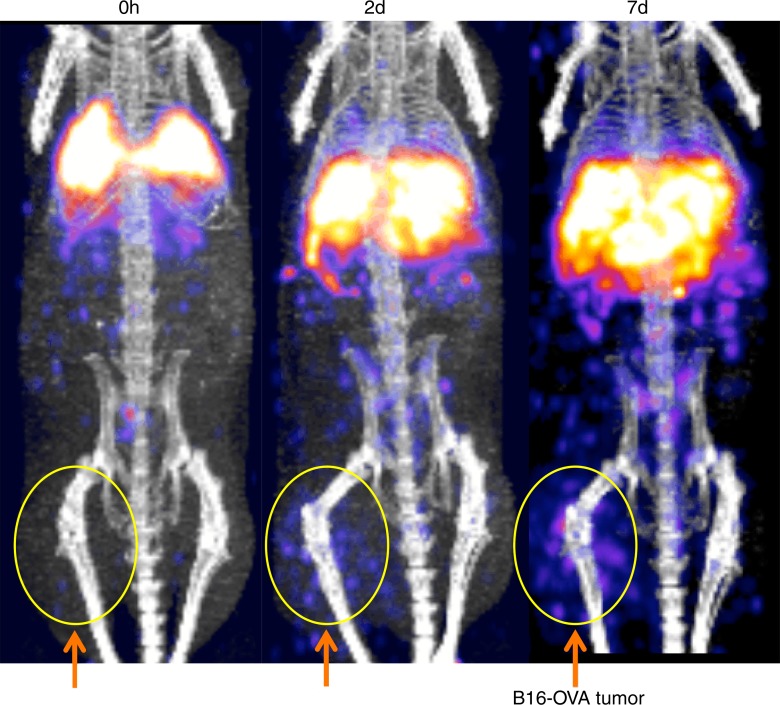
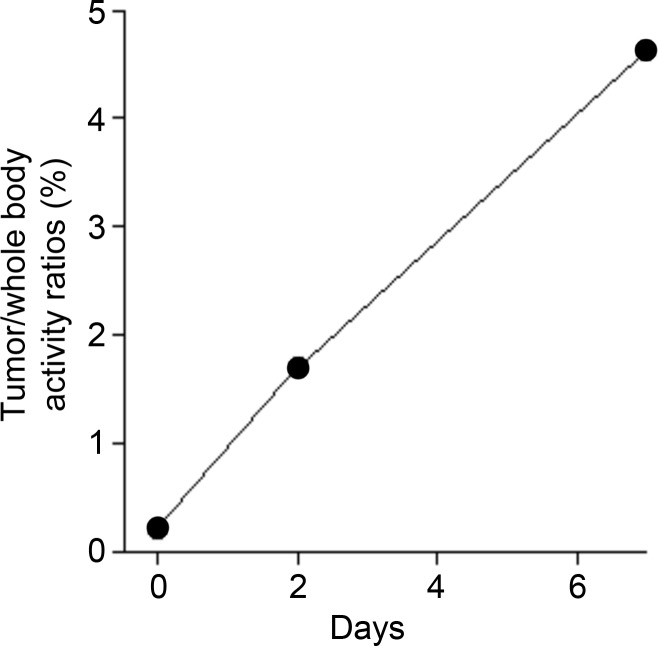
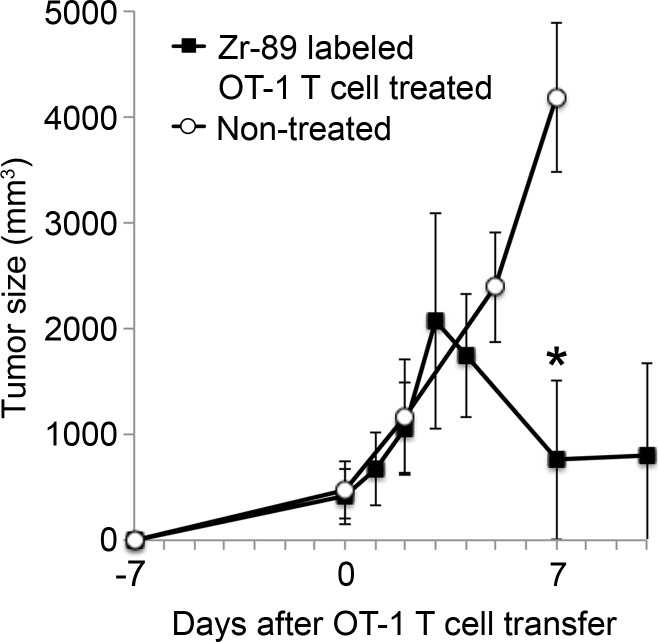
The tumor-targeting properties of ex vivo activated CTLs labeled with the 89Zr-oxine complex were examined in a melanoma immunotherapy model. RAG1 knockout mice bearing B16-OVA tumor (approximately 1 cm in diameter) were injected with 106 wild-type splenocytes, then 6 hours later adoptively transferred with 89Zr-oxine–labeled OT-1 CTLs (248.5 kBq/[7.7 × 106] cells). Serial imaging revealed accumulation of OT-1 CTLs in the tumor over time (Fig 7a, 7b) (tumor/whole-body activity, 4.6% at day 7), leading to regression of the B16-OVA tumor (Fig 7c), which indicates that cytotoxic action of CTLs was maintained after 89Zr-oxine labeling. Tumors in untreated control mice reached 20 mm in diameter, and mice were euthanized on day 7 in accordance with the institutional animal handling protocol (P < .001 at day 7 according to Holm-Sidak multiple tests that included three tests corresponding to days 2, 5, and 7).
Figure 7a:
89Zr-oxine–labeled OT-1 CTLs migrated to B16-OVA tumor. (a) MicroPET/CT images of 89Zr-oxine–labeled OT-1 CTLs in RAG1 knockout mice bearing B16-OVA melanoma tumor revealed migration of a small fraction of CTLs to the tumor (arrows) (representative images of six experiments). (b) Graph shows activity accumulated in the tumor quantified in a increased over time. (c) B16-OVA tumors regressed after the transfer of 89Zr-oxine–labeled activated OT-1 CTLs, indicating that the labeled OT-1 CTLs maintained their cytotoxic function (n = 6). Untreated mice were sacrificed on day 7, as the tumor diameter reached 20 mm (n = 5). * P = 2.84 × 10⁻⁵ on day 7 according to Holm-Sidak multiple tests that included three tests corresponding to days 2, 5, and 7. Error bars indicate standard deviations.
Figure 7b:
89Zr-oxine–labeled OT-1 CTLs migrated to B16-OVA tumor. (a) MicroPET/CT images of 89Zr-oxine–labeled OT-1 CTLs in RAG1 knockout mice bearing B16-OVA melanoma tumor revealed migration of a small fraction of CTLs to the tumor (arrows) (representative images of six experiments). (b) Graph shows activity accumulated in the tumor quantified in a increased over time. (c) B16-OVA tumors regressed after the transfer of 89Zr-oxine–labeled activated OT-1 CTLs, indicating that the labeled OT-1 CTLs maintained their cytotoxic function (n = 6). Untreated mice were sacrificed on day 7, as the tumor diameter reached 20 mm (n = 5). * P = 2.84 × 10⁻⁵ on day 7 according to Holm-Sidak multiple tests that included three tests corresponding to days 2, 5, and 7. Error bars indicate standard deviations.
Figure 7c:
89Zr-oxine–labeled OT-1 CTLs migrated to B16-OVA tumor. (a) MicroPET/CT images of 89Zr-oxine–labeled OT-1 CTLs in RAG1 knockout mice bearing B16-OVA melanoma tumor revealed migration of a small fraction of CTLs to the tumor (arrows) (representative images of six experiments). (b) Graph shows activity accumulated in the tumor quantified in a increased over time. (c) B16-OVA tumors regressed after the transfer of 89Zr-oxine–labeled activated OT-1 CTLs, indicating that the labeled OT-1 CTLs maintained their cytotoxic function (n = 6). Untreated mice were sacrificed on day 7, as the tumor diameter reached 20 mm (n = 5). * P = 2.84 × 10⁻⁵ on day 7 according to Holm-Sidak multiple tests that included three tests corresponding to days 2, 5, and 7. Error bars indicate standard deviations.
Discussion
The ability to track a wide variety of cells is of potential importance to improving cell-based therapies. For adoptive immunotherapies for cancers that use T or NK cells, the effect of cell modification on tumor-targeting properties has clear implications for the success of these therapies. With bone marrow transplantation, modifying cells, conditions, or both to increase engraftment in the bone marrow and reduce graft-versus-host disease are desirable goals. Visualization and quantification of these therapeutic cells labeled with 89Zr-oxine complex at PET could provide direct feedback on whether modifications to cells, delivery methods (eg, injection route), and conditioning of the recipient (eg, cytokine injection) augmented the migration of the cells to the target organ or tissue.
The synthesis of 89Zr-oxine complex was accomplished in an aqueous solution with simple steps of mixing, which resulted in more than 97% of 89Zr being converted to the complex, allowing us to add the resulting solution to the cell suspension for labeling without further purification. Synthesis performed in an aqueous solution has substantial advantages over synthesis methods that use an organic solvent and require time-consuming procedures to evaporate the solvent and collect the lipophilic product with another solvent, as was recently reported (33). Our method eliminated the long preparation time and equipment required for these procedures. In addition, the previously described synthesis yield was limited to about 60% versus the greater than 97% yield for the technique described in our article.
We have shown that 89Zr-oxine complex can be used to label various cell types with sufficient efficiency to enable imaging. The labeling efficiency and specific activity seemed mainly determined by cell size. Since labeling occurred at 4°C, we infer that 89Zr-oxine complex does not require active cellular incorporation and supports the concept that neutral and lipid-soluble oxine conjugates permeabilize the cell membrane (20,34). Use of complete medium decreased the labeling efficiency, possibly due to interfering serum proteins and lipids that bind the 89Zr-oxine complex via transient noncovalent bonding, such as hydrogen bonds, π effect, and hydrophobic bonds. At 37°C, nonspecific interaction of the complex and the cells would become weaker, leading to lower labeling efficiency. Once labeled, 89Zr stably remained within live cells. Because interference with cellular functionality could cause a discrepancy between the localization of cells detected with imaging and the actual trafficking when cells were not labeled, we used DCs and CTLs, two major cell types used in immunotherapy, to conduct various assays to investigate if 89Zr-oxine labeling interferes with cellular function. Our in vitro and in vivo data showed that the labeled cells maintained their functionality when the optimal specific activity of less than 88.8 kBq/106 cells was achieved. With this specific activity, we expect the effect of labeling to have a minimal (<20%) effect on the proliferation and survival of most radiosensitive cell types, including CTL. Imaging and biodistribution showed preferential migration of 89Zr-oxine–labeled cells to organs according to the cell type. For example, DCs, after egressing from the lungs, distributed to the liver and spleen, whereas naïve CTLs distributed mainly to the spleen, with a small fraction homing to the lymph nodes. Additionally, activated CTLs accumulated within the tumors expressing the specific antigen, ultimately resulting in a dramatic tumor reduction, indicating that the labeled CTLs maintained their cytotoxic function in vivo. It is difficult to compare our results with those reported previously (33) because the prior data largely derived from immortalized cell lines that can be significantly different from primary cells (eg, high expression of antiapoptotic molecules resulting in radioresistance) and because toxicity studies were not conducted.
These images could be obtained at remarkably low levels of radioactivity (eg, 145–185 kBq). While this level might seem insufficient to obtain images with clinical PET/CT scanners, we note that the recipient has no inherent background radioactivity, making even small amounts of activity from the cells detectable with modern PET/CT scanners. We previously verified this phenomenon by using another 89Zr-based cell labeling agent at comparable radioactive doses in 35-kg swine imaged with a clinical PET/CT scanner (35); thus, we are confident that the 89Zr-oxine complex has sufficient labeling efficiency (13.0%–43.9%) to track cells in humans. The fact that the 89Zr-oxine complex enables cell visualization with only a minimum radioactive dose is a significant advantage over conventional SPECT cell labeling agents that usually require a labeled dose exceeding 3.7 MBq in patients. It is also critical to minimize radiotoxicity to the cells of interest.
This study had several limitations. Only two cell types (DCs and CTLs) were fully evaluated. Further evaluation of 89Zr-oxine complex in NK and bone marrow cells that were confirmed at labeling in this study would be valuable. Since the cells are labeled ex vivo, as they divide after the transfer, the specific activity (activity per cell) is reduced. To the extent the dividing cells remain in the same location, the aggregate radioactivity will be maintained. However, there would be an obligate reduction in radioactivity at proliferation sites where the cells migrate away. An additional limitation and a potential pitfall is that small amounts of 89Zr will be released after cell death, resulting in accumulation of 89Zr in the bone due to chelation by hydroxylapatite (36), in addition to clearance from the kidneys. However, this is a slow process that occurs as the labeled cells die as compared with live cells homing to the bone marrow. Free 89Zr taken up by the bone and 89Zr signal from cells homing to the bone marrow could be differentiated in humans, in whom the size of the bone marrow cavity is sufficiently large. In addition, we could perform continuous infusion of deferoxamine, a chelating agent used in clinical practice, to capture the free 89Zr released from the dead cells and excrete it from the kidneys. Further study of these points would facilitate translation of this technique.
Practical applications: Synthesis of the 89Zr-oxine complex was accomplished in an aqueous solution by simple steps of mixing, and optimal cell labeling was achieved at room temperature. The simplicity of this preparation process makes this technique readily applicable to various clinical settings. To date, we have confirmed the ability of the complex to label various primary cells used in therapies (DCs, CTLs, NK cells, and bone marrow) and lymphoma cells, and we have confirmed that labeling does not interfere with functionality of DCs and CTLs. Thus, we are confident that this method has the potential to be a useful tool across a broad range of cell-based therapies.
Advances in Knowledge
■ 89Zr-oxine complex developed for cell tracking with PET permeabilized the cell membrane and was stably retained within the cells (labeling efficiency range, 13.0%–43.9%; mean retention, 83.5% ± 1.8 [standard deviation] on day 5 in dendritic cells), enabling extended in vivo tracking for at least 7 days.
■ Labeling cells with 89Zr-oxine complex did not interfere with cellular survival, proliferation, or functionality when cells were labeled at a specific activity of less than 2.4 kBq/106 cells.
■ 89Zr-oxine complex enabled high-sensitivity imaging, with a radioactivity dose of only 145–185 kBq in mice.
Implication for Patient Care
■ This method has the potential to enable tracking of cells in human cell-based therapies, which could lead to the design of more successful treatments for cancer.
APPENDIX
SUPPLEMENTAL FIGURES
Acknowledgments
Acknowledgement
We thank Stephen Adler, PhD for providing help in image processing.
Received December 11, 2014; revision requested January 2, 2015; revision received January 19; accepted January 23; final version accepted January 28.
The content of this publication does not necessarily reflect the views or policies of the Department of Health and Human Services, nor does mention of trade names, commercial products, or organizations imply endorsement by the U.S. Government.
Funding: This research was supported by the National Institutes of Health (grants ZIA BC 010657 and HHSN261200800001E).
Abbreviations:
- B16-OVA
- B16 murine melanoma cells expressing OVA
- CMFDA
- chloromethylfluorescein diacetate
- CTL
- cytotoxic T cell
- DC
- dendritic cell
- NK
- natural killer
- OVA
- ovalubumin
- TCR
- T-cell receptor
Disclosures of Conflicts of Interest: N.S. Activities related to the present article: none to disclose. Activities not related to the present article: has filed a U.S. patent application for generation and application of the 89Zr-oxine complex. Other relationships: none to disclose. H.W. Activities related to the present article: none to disclose. Activities not related to the present article: has filed a U.S. patent application for generation and application of the 89Zr-oxine complex. Other relationships: none to disclose. K.O.A. disclosed no relevant relationships. L.P.S. disclosed no relevant relationships. G.L.G. Activities related to the present article: none to disclose. Activities not related to the present article: has filed a U.S. patent application for generation and application of the 89Zr-oxine complex. Other relationships: none to disclose. P.L.C. Activities related to the present article: none to disclose. Activities not related to the present article: has filed a U.S. patent application for generation and application of the 89Zr-oxine complex. Other relationships: none to disclose.
References
- 1.Palucka K, Banchereau J. Cancer immunotherapy via dendritic cells. Nat Rev Cancer 2012;12(4):265–277. [DOI] [PMC free article] [PubMed] [Google Scholar]
- 2.O’Neill DW, Adams S, Bhardwaj N. Manipulating dendritic cell biology for the active immunotherapy of cancer. Blood 2004;104(8):2235–2246. [DOI] [PubMed] [Google Scholar]
- 3.Kater AP, van Oers MH, Kipps TJ. Cellular immune therapy for chronic lymphocytic leukemia. Blood 2007;110(8):2811–2818. [DOI] [PubMed] [Google Scholar]
- 4.Körbling M, Freireich EJ. Twenty-five years of peripheral blood stem cell transplantation. Blood 2011;117(24):6411–6416. [DOI] [PubMed] [Google Scholar]
- 5.Grupp SA, Kalos M, Barrett D, et al. Chimeric antigen receptor-modified T cells for acute lymphoid leukemia. N Engl J Med 2013;368(16):1509–1518. [DOI] [PMC free article] [PubMed] [Google Scholar]
- 6.Sadelain M, Brentjens R, Rivière I. The basic principles of chimeric antigen receptor design. Cancer Discov 2013;3(4):388–398. [DOI] [PMC free article] [PubMed] [Google Scholar]
- 7.Shi H, Liu L, Wang Z. Improving the efficacy and safety of engineered T cell therapy for cancer. Cancer Lett 2013;328(2):191–197. [DOI] [PubMed] [Google Scholar]
- 8.Bachy E, Coiffier B. Anti-PD1 antibody: a new approach to treatment of lymphomas. Lancet Oncol 2014;15(1):7–8. [DOI] [PubMed] [Google Scholar]
- 9.Westin JR, Chu F, Zhang M, et al. Safety and activity of PD1 blockade by pidilizumab in combination with rituximab in patients with relapsed follicular lymphoma: a single group, open-label, phase 2 trial. Lancet Oncol 2014;15(1):69–77. [DOI] [PMC free article] [PubMed] [Google Scholar]
- 10.Choy G, Choyke P, Libutti SK. Current advances in molecular imaging: noninvasive in vivo bioluminescent and fluorescent optical imaging in cancer research. Mol Imaging 2003;2(4):303–312. [DOI] [PubMed] [Google Scholar]
- 11.Wang X, Rosol M, Ge S, et al. Dynamic tracking of human hematopoietic stem cell engraftment using in vivo bioluminescence imaging. Blood 2003;102(10):3478–3482. [DOI] [PubMed] [Google Scholar]
- 12.Limberis MP, Bell CL, Wilson JM. Identification of the murine firefly luciferase-specific CD8 T-cell epitopes. Gene Ther 2009;16(3):441–447. [DOI] [PMC free article] [PubMed] [Google Scholar]
- 13.de Vries IJ, Lesterhuis WJ, Barentsz JO, et al. Magnetic resonance tracking of dendritic cells in melanoma patients for monitoring of cellular therapy. Nat Biotechnol 2005;23(11):1407–1413. [DOI] [PubMed] [Google Scholar]
- 14.Kadayakkara DK, Korrer MJ, Bulte JW, Levitsky HI. Paradoxical decrease in the capture and lymph node delivery of cancer vaccine antigen induced by a TLR4 agonist as visualized by dual-mode imaging. Cancer Res 2015;75(1):51–61. [DOI] [PMC free article] [PubMed] [Google Scholar]
- 15.Kircher MF, Allport JR, Graves EE, et al. In vivo high resolution three-dimensional imaging of antigen-specific cytotoxic T-lymphocyte trafficking to tumors. Cancer Res 2003;63(20):6838–6846. [PubMed] [Google Scholar]
- 16.Ahrens ET, Zhong J. In vivo MRI cell tracking using perfluorocarbon probes and fluorine-19 detection. NMR Biomed 2013;26(7):860–871. [DOI] [PMC free article] [PubMed] [Google Scholar]
- 17.Barnett BP, Ruiz-Cabello J, Hota P, et al. Use of perfluorocarbon nanoparticles for non-invasive multimodal cell tracking of human pancreatic islets. Contrast Media Mol Imaging 2011;6(4):251–259. [DOI] [PMC free article] [PubMed] [Google Scholar]
- 18.Srinivas M, Turner MS, Janjic JM, Morel PA, Laidlaw DH, Ahrens ET. In vivo cytometry of antigen-specific t cells using 19F MRI. Magn Reson Med 2009;62(3):747–753. [DOI] [PMC free article] [PubMed] [Google Scholar]
- 19.Temme S, Bönner F, Schrader J, Flögel U. 19F magnetic resonance imaging of endogenous macrophages in inflammation. Wiley Interdiscip Rev Nanomed Nanobiotechnol 2012;4(3):329–343. [DOI] [PubMed] [Google Scholar]
- 20.Thakur ML, Coleman RE, Welch MJ. Indium-111-labeled leukocytes for the localization of abscesses: preparation, analysis, tissue distribution, and comparison with gallium-67 citrate in dogs. J Lab Clin Med 1977;89(1):217–228. [PubMed] [Google Scholar]
- 21.McAfee JG, Thakur ML. Survey of radioactive agents for in vitro labeling of phagocytic leukocytes. I. Soluble agents. J Nucl Med 1976;17(6):480–487. [PubMed] [Google Scholar]
- 22.Roca M, de Vries EF, Jamar F, Israel O, Signore A. Guidelines for the labelling of leucocytes with (111)In-oxine. Inflammation/Infection Taskgroup of the European Association of Nuclear Medicine. Eur J Nucl Med Mol Imaging 2010;37(4):835–841. [Published correction appears in Eur J Nucl Med Mol Imaging 2010;37(6):1234.] [DOI] [PMC free article] [PubMed] [Google Scholar]
- 23.Coakley AJ, Mountford PJ. 99mTc-HMPAO for labelling leucocytes in infection. Lancet 1987;1(8523):44. [DOI] [PubMed] [Google Scholar]
- 24.Peters AM, Danpure HJ, Osman S, et al. Clinical experience with 99mTc-hexamethylpropylene-amineoxime for labelling leucocytes and imaging inflammation. Lancet 1986;2(8513):946–949. [DOI] [PubMed] [Google Scholar]
- 25.de Vries EF, Roca M, Jamar F, Israel O, Signore A. Guidelines for the labelling of leucocytes with (99m)Tc-HMPAO. Inflammation/Infection Taskgroup of the European Association of Nuclear Medicine. Eur J Nucl Med Mol Imaging 2010;37(4):842–848. [DOI] [PMC free article] [PubMed] [Google Scholar]
- 26.Rahmim A, Zaidi H. PET versus SPECT: strengths, limitations and challenges. Nucl Med Commun 2008;29(3):193–207. [DOI] [PubMed] [Google Scholar]
- 27.Botti C, Negri DR, Seregni E, et al. Comparison of three different methods for radiolabelling human activated T lymphocytes. Eur J Nucl Med 1997;24(5):497–504. [DOI] [PubMed] [Google Scholar]
- 28.Wolfs E, Struys T, Notelaers T, et al. 18F-FDG labeling of mesenchymal stem cells and multipotent adult progenitor cells for PET imaging: effects on ultrastructure and differentiation capacity. J Nucl Med 2013;54(3):447–454. [DOI] [PubMed] [Google Scholar]
- 29.Brown DM, Fisher TL, Wei C, Frelinger JG, Lord EM. Tumours can act as adjuvants for humoral immunity. Immunology 2001;102(4):486–497. [DOI] [PMC free article] [PubMed] [Google Scholar]
- 30.Szajek L, Barker W, Shielah C, Plascjak P. Targetry, semi-remote processing, and quality control for routine production of Zr-89 for PET studies. J Nucl Med 2013;54(Suppl 2):1015. [Google Scholar]
- 31.Holland JP, Sheh Y, Lewis JS. Standardized methods for the production of high specific-activity zirconium-89. Nucl Med Biol 2009;36(7):729–739. [DOI] [PMC free article] [PubMed] [Google Scholar]
- 32.Kathirgamanathan P, Surendrakumar S, Antipan-Lara J, et al. Discovery of two new phases of zirconium tetrakis(8-hydroxyquinolinolate): synthesis, crystal structure and their electron transporting characteristics in organic light emitting diodes (OLEDs). J Mater Chem 2011;21(6):1762–1771. [Google Scholar]
- 33.Charoenphun P, Meszaros LK, Chuamsaamarkkee K, et al. [(89)Zr]Oxinate4 for long-term in vivo cell tracking by positron emission tomography. Eur J Nucl Med Mol Imaging 2015;42(2):278–287. [DOI] [PMC free article] [PubMed] [Google Scholar]
- 34.Thakur ML, Segal AW, Louis L, Welch MJ, Hopkins J, Peters TJ. Indium-111-labeled cellular blood components: mechanism of labeling and intracellular location in human neutrophils. J Nucl Med 1977;18(10):1022–1026. [PubMed] [Google Scholar]
- 35.Pantin JM, Hoyt RF, Jr, Aras O, et al. Optimization of intrabone delivery of hematopoietic progenitor cells in a swine model using cell radiolabeling with [89]zirconium. Am J Transplant 2015 Feb 5. [Epub ahead of print] [DOI] [PMC free article] [PubMed] [Google Scholar]
- 36.Abou DS, Ku T, Smith-Jones PM. In vivo biodistribution and accumulation of 89Zr in mice. Nucl Med Biol 2011;38(5):675–681. [DOI] [PMC free article] [PubMed] [Google Scholar]
Associated Data
This section collects any data citations, data availability statements, or supplementary materials included in this article.


