

Abstract
Recent studies have shown that explicit solvent molecular dynamics (MD) simulation followed by structural averaging can consistently improve protein structure models. In this study, we investigate the origin of improvements from averaging. We first show that improvement upon averaging is not limited to explicit water MD simulation, as consistent improvements are also observed for more efficient implicit solvent MD or Monte Carlo minimization simulations. We next examine the changes in model accuracy brought about by averaging at the individual residue level, and find that these changes are correlated with the extent of residue fluctuation. Residues undergoing large fluctuations tend to diverge, and these deviations are dampened by averaging. Residues undergoing medium sized fluctuations often improve significantly, and averaging amplifies these improvements. These observations are consistent with an energy landscape model in which the magnitude of the energy gradient towards the native structure decreases with increasing distance from the native state.
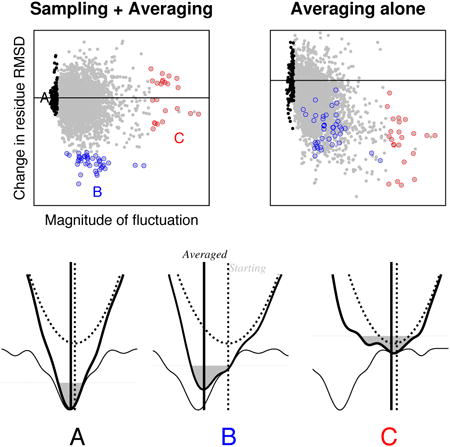
Graphical abstract
Introduction
In the current protein-structure-rich era, an important challenge in the protein structure prediction field is the structure refinement problem (Nugent, Cozzetto, & Jones, 2014). The ultimate aim of protein structure refinement is to improve homology models to the level of experimentally determined structures. Feig and coworkers recently made a breakthrough in this area (Mirjalili & Feig, 2012), (Mirjalili, Noyes, & Feig, 2014), obtaining consistent blind improvements to homology models in the recent Critical Assessments of techniques for protein Structure Prediction (CASP10) experiment (Nugent, Cozzetto, & Jones, 2014), (Moult, Fidelis, Kryshtafovych, Schwede, & Tramontano, 2014).
Although the results of Mirjalili et al. are very encouraging, the origins of these improvements are not completely clear. Their approach employed explicit water molecular dynamics (MD) simulations with a molecular mechanics force field (Best, et al., 2012) and restraints to the starting coordinates, followed by filtering the sampled ensemble using a knowledge-based potential (Yang & Zhou, 2008) and, finally, generating a single representative model using structural averaging. A first question is practical: can this expensive calculation be made more efficient so as to be more broadly applicable? A second question is more fundamental: what aspect of the Mirjalili et al.'s protocol contributes to the “consistency” of refinement, which has been a long standing challenge in the field (Moult, Fidelis, Kryshtafovych, Schwede, & Tramontano, 2014)
Here we investigate these questions by adapting Mirjalili et al.'s approach to less computationally intensive sampling methods. We show that structural averaging has a clearly beneficial effect independent of simulation type (MD versus Monte Carlo Minimization (MCM)) and force field (explicit versus implicit water model). We show that in an ensemble of trajectories, the improvements in the close to correct regions are generally similar to one another and hence are reinforced by averaging, while the divergences in the incorrect regions are generally different from one another and hence dampened by averaging.
Results
Robust improvements in homology models using short implicit solvation simulations
We show that consistent refinement can be achieved using short simulations with an implicit solvation model. Implicit solvent simulation using Rosetta (Leaver-Fay, et al., 2014) CartesianRefiner (see METHODS) followed by filtering and averaging consistently improves homology models by three different quality measures (Figure 1A). In terms of GDT-HA (high accuracy global distance test) (Kopp, Bordoli, Battey, Kiefer, & Schwede, 2007), 77.5% of the targets improve, 5% remain the same, and 17.5% worsen. For the targets worsened by refinement, the decrease in GDT-HA is less than 2.0 (out of 100.0) in all cases. The fractions improved are 72.5% and 77.5% based on Cα lDDT (local distance difference test) (Mariani, Biasini, Barbato, & Schwede, 2013) and RMSD, respectively. Changes in radius of gyration are subtle, indicating that the improvements are not an artifact of uniformly compressing or expanding structures. The stereochemistry also improves: the Molprobity (Chen, et al., 2010) scores improve for 92.5% of targets from an average of 2.44 (with standard deviation 0.86) to 1.42 (with standard deviation 0.62), and similar with Gaia (Kota, Ding, Ramachandran, & Dokholyan, 2011) (see Supplementary Table S1 for details). The improvements in RMSD are smaller than those with GDT-HA and Cα-LDDT, as has been found for explicit water MD simulations (Mirjalili & Feig, 2012), suggesting that trajectory-averaging-based refinement approaches are rather conservative in refining incorrect parts of the structures (GDT-HA and Cα-LDDT are more tolerant of large local errors).
Figure 1.

Consistent refinement using implicit solvent simulations. Data are from running Rosetta CartesianRefiner, a combined approach of molecular dynamics (MD) and Monte Carlo Minimization (MCM) simulations with implicit solvent models (see METHODS for details). A) Comparison of starting (X-axis) and refined models (Y-axis) by four measures: GDT-HA (high-accuracy global distance test) (Kopp, Bordoli, Battey, Kiefer & Schwede, 2007), Cα lDDT (local distance difference test) (Mariani, Biasini, Barbato, & Schwede, 2013), RMSD (Å), and radius of gyration (Å). GDT-HA measures the fraction of residues within 0.5, 1.0, 2.0, and 4.0 Å to the native position after structural superimposition. Cα lDDT measures the similarity of Cα-Cα pairwise distance map within 5 Å cutoff without structural superimposition. Overall, the fraction of targets improved by refinement is 77.5%, 72.5%, 77.5% with average improvements by 1.56, 1.13 (in percent), 0.13Å in GDT-HA, Cα LDDT, and RMSD, respectively. B) Correlation between the improved fraction of structures in sampled trajectory (by GDT-HA, X-axis) and GDT-HA change of the final model brought by refinement (Y-axis). Each dot represents a single target among 40 test cases. Averaging results in improvements over the starting model when more than 15% of the structures (dotted line) sampled in the trajectory are closer to the native structure than the starting model.
Structural averaging can generate improved models even when less than half of the structures sampled in a trajectory are closer to the native structure than the starting model. The change in GDT-HA (ΔGDT-HA) (Kopp, Bordoh, Battey, Kiefer, & Schwede, 2007) from the starting models to the ensemble-averaged models is correlated with the fraction of improved structures in each ensemble (compared to the starting models). Even when only 15% of the sampled structures are improved over the starting structure, the average structure is not worse than the starting structure. Averaging outperforms selecting a structure: i) with lowest Rosetta energy, ii) with lowest statistical potential (Zhou & Skolnick, 2011), and iii) nearest to the cluster center. The first two approaches, which purely rely on energy functions -- the first used in sampling, and the second “orthogonal” to that used in sampling -- do not provide consistent improvements (with an average ΔGDT-HA of 0.0). Clustering only produces marginal improvements (with an average ΔGDT-HA of 0.5), while averaging yields an average ΔGDT-HA of 1.56.
The consistency of improvement upon averaging is similar using MD and MCM simulations (Table 1). Using ensembles from MD trajectories, 80.0% of targets improve or stay on par with an average GDT-HA increase of 1.2. Similarly, using MCM-based methods structure quality improved or stayed on par for 75% of targets, with an average GDT-HA increase of 0.6. Combining models generated using different methods yields improved results (Table 1). These results suggest that the robustness of the improvement is not dependent on the sampling method as long as the trajectory samples reasonable structural diversity. Restraints to the starting structure are important: unrestrained simulations yield only marginal improvements in structure accuracy even after averaging (Figure S1; mean GDT-HA increase is 0.38).
Table 1.
Effect of structural averaging using different sampling methods.
| Sampling sources | ΔGDT-HA1) | Fraction equal or improved (%) |
|---|---|---|
|
| ||
| MCM only2) | 0.56 | 75.0% |
| MD only3) | 1.18 | 80.0% |
| Selecting 1 method by statistical potential4) | 0.86 | 57.5% |
| Uniformly 3 methods5) | 1.04 | 77.5% |
| Whole methods | 1.44 | 77.5% |
|
| ||
| Selecting 3 method by the selection rule6) | 1.56 | 82.5% |
|
| ||
| Same as above but without restraint | 0.38 | 47.5% |
Average GDT-HA change from the starting models. Final models are generated by averaging the selected trajectories on first column.
Result using the trajectories only from a Monte Carlo Minimization (MCM) method Rosetta FastRelax (Tyka, et al., 2011) protocol.
Result using the trajectories only from implicit solvent molecular dynamics (MD) simulation.
Result using three methods uniformly instead of selecting based on the selection rule described below.
Default method taken in this study. Three methods are selected based on their median statistical potential score (Zhou & Skolnick, 2011) on their trajectory.
Analysis of refinement at the individual residue level
To determine the origins of the improvement in model accuracy, it is instructive to consider the effects of refinement on the accuracy of placement of individual residues. We first examined the fluctuations in atomic positions of individual residues over samples of ∼100 structures generated from MCM and MD trajectories for each of 40 different targets. We found that the magnitude of these fluctuations are correlated with the deviation of the starting position of the residues from their positions in the native structure: residues close to the native structure (< 1.0 Å) to start out fluctuate relatively little (0.32 Å with standard deviation 0.12 Å), while those that are far from the native structure (> 4.0 Å) undergo considerable fluctuations (0.45 Å with standard deviation 0.26 Å) (Figure 2A).
Figure 2.

Analysis of the effect of averaging at the individual residue level. A) The magnitude of the fluctuations in the coordinates of a residue during the trajectories increases with increasing distance of the starting coordinates from the native structure. The first and third quartiles are shown as error bars. From B) to D), residue model quality changes are plotted (Y-axis) as a function of the fluctuations of the residue during the simulation (X-axis, root-mean-square fluctuation in Å) for the 40 targets in the study. B) The mean value of the per-residue change in RMSD (ΔRMSD) for each member of the ensemble. ΔRMSD values are computed for each residue in each member of the ensemble, and the resulting ΔRMSD values are then averaged. C) The per-residue ΔRMSD of the ensemble averaged structure. Members of the ensemble are first structurally averaged, and then the per-residue ΔRMSD is computed for this averaged structure. D) The difference between the pre (panel B) and post (panel C) structural averaging per-residueΔRMSDs. The Y-axis indicates the contribution of structural averaging: negative values represent improvements upon averaging. Residues with low fluctuation (< 0.2 Å) or high fluctuation (>1.0 Å) or with large improvements (< -0.4 Å) in the averaged structures are indicated with black, red and blue circles respectively. Residue-level model quality is measured by residue RMSD on a 9-residue window with the target residue at the center. For comparison, the same analyses on unrestrained simulations are provided in Figure S1.
The role of structural averaging
The impact of structural averaging at the residue level can be measured by the difference between “average accuracy in the individual members of the ensemble” (Figure 2B) and “accuracy in the averaged structure” (Figure 2C). The first of these quantities reports on sampling in the individual trajectories. As shown in Figure 2B (blue), residues undergoing intermediate levels of fluctuations (0.3-0.6Å) often improve considerably in the trajectories. These improvements are offset by a general deterioration in accuracy of residues undergoing larger levels of fluctuations (Figure 2B, red); as described above these are the residues that in the starting structure are furthest from the native structure. Averaging further increases the structural improvements in the intermediate fluctuation range (Figure 2C, blue), and considerably reduces the deterioration in accuracy of the residues undergoing large fluctuations (Figure 2C, red). The effects of averaging are isolated in Figure 2D by subtracting the individual trajectory results in Figure 2B from the post averaging results in Figure 2C. Compared to the ensemble structures, averaging improves residue accuracy across the fluctuation range, with the magnitude of the improvement increasing with the fluctuation magnitude.
The net improvements to the starting structures during refinement are consistent with these observations. In Table 2, residues are binned based on the magnitude of their fluctuations, and the average change in RMSD is computed for residues in each bin. The biggest contribution to improvement comes from the medium size fluctuation bin (RMSF range from 0.42 to 0.53 Å). The net RMSD during refinement in this bin changes from -13.3 (average value of ensemble structures) to -58.0 Å (averaged structure). In regions undergoing large fluctuations (RMSF range over 0.64 Å, red circles in Figure 2), significant errors in the ensemble of structures (+24.0 Å) are reduced considerably by averaging (-5.0 Å). Because the magnitude of residue level fluctuations is correlated with distance from the native structure, similar trends are observed when residues are binned based on their RMSD to the native structure in the starting model. Except for residues essentially already in the correct positions, which have no further room for improvement, residues closer to their native positions tend to show lower fluctuations (Figure 2A), bigger decreases in net RMSD (Figure 3A), and higher frequencies of improvement (Figure 3B). Residues far from their native positions tend to move further away in the individual trajectories, and these divergences are to some extent cancelled out by averaging.
Table 2.
Dependence of net change in RMSD during refinement on magnitude of fluctuations.
| RMSF range (Å) | %res1) | ΔRMSD (Å)2), ensemble average | ΔRMSD (Å) 2), averaged structure | Δper residue5) (Å) | |||
|---|---|---|---|---|---|---|---|
| net3) | Per residue | net3) | per residue | contribution4) | |||
| ∼0.24 | 10% | +4.9 | +0.010 | +0.2 | 0.000 | 0% | -0.010 |
|
| |||||||
| 0.24∼0.28 | 10% | -4.8 | -0.010 | -17.7 | -0.037 | 10% | -0.027 |
|
| |||||||
| 0.28∼0.34 | 20% | -0.6 | -0.001 | -29.1 | -0.030 | 16% | -0.029 |
|
| |||||||
| 0.34∼0.42 | 20% | -5.7 | -0.006 | -45.5 | -0.047 | 26% | -0.041 |
|
| |||||||
| 0.42∼0.53 | 20% | -13.3 | -0.014 | -58.8 | -0.061 | 33% | -0.047 |
|
| |||||||
| 0.53∼0.64 | 10% | +2.3 | +0.005 | -20.3 | -0.042 | 12% | -0.047 |
|
| |||||||
| 0.64∼1.41 | 10% | +24.0 | +0.050 | -5.0 | -0.010 | 3% | -0.060 |
|
| |||||||
| Sum | 100% | +6.9 | +0.001 | -176.1 | -0.036 | 100% | -0.037 |
Percentage of residues in the indicated RMSF range.
RMSD change from starting structures. Negative values are improvements.
Sum over all residues in the RMSF bin.
Contribution to net improvement in percent. Positive values are improvements.
Per residue ΔRMSD change from ensemble average to the averaged structure; the improvement resulting purely from structure averaging. Negative values are improvements.
Figure 3.

Dependence of per-residue changes during refinement on starting RMSD to the native structure. A) Dependence of per-residue ΔRMSD (see Fig 2 legend) on starting RMSD to the native structure. The first and third quartiles are shown as error bars. B) The fraction of residues improved as a function of starting RMSD to the native structure. In C) and D), the distribution of per-residue improvements C) before and D) after structural averaging are shown as histograms. Black and white columns in the panels correspond to restrained and unrestrained simulations, respectively.
The effects of averaging are similar but even more pronounced for the trajectories carried out in the absence of restraints. The overall shape of the dependence of the effect of averaging on fluctuation magnitude (Figure S1) is similar although the absolute magnitude of the fluctuations is larger. The mean RMSD per residue in the absence of restraints decreases from 1.1Å to -0.02Å upon averaging, and in the presence of restraints, from 0.0Å to -0.04Å. The distributions of the RMSD changes in the presence and absence of restraints are shown in the lower panels of Figure 3. Much of the improvement by averaging in unrestrained simulation results from dampening of the largest fluctuations: ∼30% of residues have mean deviations of greater than 0.5Å before averaging, and only ∼5% after. Hence the contributions of averaging and the trajectory restraints to the overall success of refinement are independent: averaging leads to considerably improvements in either case, and the restraints considerably improve the ensemble structures being averaged.
The role of explicit water and loop modeling in refinement problem
Despite its successful reproduction of robust refinement, our implicit solvent approach shows a smaller extent of improvement on average compared to explicit water simulations. For same 40 targets, the GDT-HA improvement is 1.56 in this study, compared to 2.8 by long explicit solvent simulations (Mirjalili & Feig, 2012). While some of this reduction is due to the reduced sampling of our approach (approximately 100-fold less), there is also a clear limitation in implicit solvent simulations, as pointed out in other studies (Fennel, Kehoe, & Dill, 2010). When the 40 target proteins are categorized based on the importance of explicit waters, there are 8 cases with more than 5 buried water molecules hydrogen bonding to the protein, 22 cases where there are few explicit-water-protein hydrogen bonds, and 10 cases where the water–protein interactions are uncertain (due to NMR or low-resolution crystal structures). The ΔGDT-HA for the 22 targets that do not have buried water-protein interactions are comparable between the two methods, 2.1 to 2.4; for the remaining 18 targets the differences are dramatic, 0.8 to 3.1, for implicit and explicit solvent simulations, respectively.
A common limitation of trajectory averaging, with methods based on both implicit and explicit solvent, is in refinement of relatively incorrect regions, where dynamics or minimization alone is insufficient to move the backbone into the native energy attractor. Complementary to this approach are loop and terminus backbone modeling methods (Park & Seok, 2012) (Stein & Kortemme, 2013). To highlight this complementarity, we show an example combining both methods on a homology model of CASP target TR723, with starting GDT-HA=66.0 and RMSD=2.2 Å. Applying the approach from the previous section, there is a GDT-HA improvement of 3.3 but no change in RMSD, with improvements entirely in the core region. If we apply RosettaCM (Song, et al., 2013) to reconstruct the N-terminus on top of the model with refined core, we further improve GDT-HA and RMSD by 4.6 and 0.4 Å, respectively. Achieving consistent improvements in model quality through loop modeling will likely require additional method development.
Discussion
Our analysis of trajectory averaging at the individual residue level suggests that the increase in success of refinement upon averaging results from the superposition of two limiting effects. The trajectories may be viewed as diffusive processes in very high dimensional spaces; in one limit, the free energy landscape is flat, and in the other, harmonic. In the first limit, which dominates for residues which start out far from the native structure and free energy minimum, averaging dampens the random (and hence non-reinforcing) changes to the starting structure. In the second limit, which holds for residues closer to the native structure and free energy minimum, averaging better locates the position of the harmonic minimum than any individual structure since it is unlikely for the many structural degrees of freedom to all move in the right direction in a single trajectory.
An alternative explanation of the improvement due to ensemble averaging is that it better describes the ensemble of structures present in a crystal during X-ray data collection. While it is possible some of this improvement stems from this effect, it is unlikely this is responsible for the majority of the improvement. First, averaging yields improved results independent of starting model quality, even when the starting model is quite non-native and unlike the structures sampled in the crystal environment. Second, successful refinement of targets whose native structures are determined by NMR suggests that the result is not crystal specific (and NMR measurements are a different ensemble average).
The “Anna Karenina” principle is a generalization of the novel's opening sentence: “Happy families are all alike; every unhappy family is unhappy in its own way”. In the context of the protein refinement problem: residues near the native structure experience forces in the direction of the native minimum and undergo consistent motions, while “unhappy” residues far from the native minimum experience diverse forces and undergo diverse motions. This picture helps rationalize why iteratively reapplying trajectory-averaging-based refinement approaches does not result in continued improvements. The large improvements in structure quality come from the residues at intermediate distances from the native structure; once these become close to native further improvements in the structure require improvements in the more divergent regions where the large fluctuations are mostly canceled out by averaging. Improvements in model quality beyond the first iteration will likely require improvements in energy functions so that a larger fraction of residues feel a strong force towards the native conformation.
The physical basis for the “Anna Karenina” effect in structure refinement is that native interactions must generally be stronger and consistent (less frustrated) (Taketomi, Ueda, & Go, 1975)(Bryngelson, Onuchic, Socci, & Wolynes, 1995) than non-native interactions for the folded state to be a sufficiently deep energy minimum to overcome the large entropic cost to folding. Fragments of structure close to this energy minimum experience consistent forces, while fragments of structure far from the minimum experience less consistent and more rapidly varying forces—hence in different trajectories there is much more variation in the motions undergone in the latter than in the former.
Experimental Procedures
Data set
For validation of the method, targets consisted of all refinement category targets from CASP8 to CASP10. Targets with a starting model with GDT-HA below 40.0 were removed, as conservative refinement is likely limited in those cases. In total, 40 targets were used. Parameter optimization was done on separate set composed of homology models from server predictions on other CASP targets.
Rosetta CartesianRefiner: Improved sampling efficiency by multi-method approach
Here we describe the CartesianRefiner protocol developed for protein homology model refinement implemented within Rosetta (Leaver-Fay, et al., 2014). The protocol begins with a homology model and returns a single refined model; no additional information, e.g. template structure, known contacts, and so on, is assumed. First, a given starting structure is distributed into multiple trajectories on each of 7 different methods utilizing either MD or MCM simulations. Individual methods vary in their energy functions, initial structure preparation, and simulation parameters. In all methods, Cα atoms of all residues are restrained through harmonic force at their starting positions with the restraint strength of 1.0 REU (Rosetta Energy Unit)/mol. The four MD methods are combinations of two energy functions and two variants on the side-chain initialization protocol. The energy functions are the standard Rosetta energy as well as FACTS energy: standard Rosetta energy employs an effective solvation term (Lazaridis & Karpuls, 1999) while FACTS energy describes the solvation effect by Generalized Born / Surface Area (GB/SA) approach using FACTS model (Haberthur & Caflisch, 2008). Side-chains were initially optimized using the Rosetta packer (Leaver-Fay, et al., 2014) with either standard energy weights, or “softened” energy weights inspired from other refinement methods (Heo, Park, & Seok, 2013) where van der Waals interactions are dampened to reduce the sensitivity to inaccurate initial backbone placement. For each MD method 12 replicas of 20 ps simulations are performed from which structures are collected every 1 ps. Temperature is set uniformly at 150K, which roughly corresponds to room temperature with Rosetta energy (Liu, Kellog, & Liang, 2012). The three MCM methods employed are: Rosetta FastRelax (Tyka, et al., 2011) with standard Rosetta energy in Cartesian space and torsion space (Conway, Tyka, DiMaio, Konerding, & Baker, 2014), and finally FastRelax in Cartesian space with FACTS energy described above. FastRelax protocol consists of several rounds of Monte Carlo side-chain modeling and energy minimization while slowly ramping up and down the weight of the repulsive part of the Van der Waals potential to anneal the structure. Once sampling is done, trajectories from three methods among seven are selected based on their median statistical potential score (Zhou & Skolnick, 2011), followed by sampling enrichment to double the ensemble structures. Finally, structural averaging is carried out on the ensemble, combining the structures with lowest 50% statistical potential from each method.
There are two reasons for using different methods simultaneously. First, it allows for diverse sampling within a short simulation time. As pointed out above, diverse sampling is crucial for deriving sufficient statistics on residue fluctuations. Second, it increases the probability of any sampled structure to overcome energetic barriers. Energetic barriers may differ depending on the starting model, thus, they may be more easily overcome by employing different sampling techniques and energy functions. This is especially important, as short simulations may not guarantee enough sampling.
The overall simulation time for a 200-residue target is about 30 CPU-hours on a 2.0 GHz Intel Xeon CPU. The simulation time scales linearly to the number of protein residues. Our approach is on the order of hundreds of times faster when compared to explicit water simulations by Mirjalili et al. carried out using the NAMD package (Phillips, et al., 2005). Rosetta CartesianRefiner is freely available to academic users as part of the Rosetta software suite. Detail of usage is provided in Supplemental Information.
Supplementary Material
Highlights.
Consistent refinement upon averaging is found in implicit water MD/MCM simulations
The origin of refinement upon averaging is addressed in residue level
Improvements upon averaging is related to the extent of residue fluctuations
Improvements consist of amplifying improvements and dampening divergences
Acknowledgments
This work was supported by US National Institutes of Health under award numbers R01GM092802 (H.P. and D.B.). An award of computer time was provided by the Innovative and Novel Computational Impact on Theory and Experiment (INCITE) program. This research used resources of the Argonne Leadership Computing Facility, which is a DOE Office of Science User Facility supported under Contract DE-AC02-06CH11357.
Footnotes
Author Contributions: H.P., F.D, and D.B. designed research; H.P. performed research; H.P. and F.D. developed methods; H.P. and D.B. analyzed data; and H.P., F.D, and D.B. wrote the paper.
The authors declare no conflict of interest.
Publisher's Disclaimer: This is a PDF file of an unedited manuscript that has been accepted for publication. As a service to our customers we are providing this early version of the manuscript. The manuscript will undergo copyediting, typesetting, and review of the resulting proof before it is published in its final citable form. Please note that during the production process errors may be discovered which could affect the content, and all legal disclaimers that apply to the journal pertain.
References
- Best RB, Zhu X, Shim J, Lopes PE, Mittal J, Feig M, et al. Optimization of the Additive CHARMM All-Atom Protein Force Field Targeting Improved Sampling of the Backbone φ, Ψ and Side-Chain χ1 and χ2 Dihedral Angles. J Chem Theory Comput. 2012;8(9):3257–3273. doi: 10.1021/ct300400x. [DOI] [PMC free article] [PubMed] [Google Scholar]
- Bryngelson JD, Onuchic JN, Socci ND, Wolynes PG. Funnels, pathways, and the energy landscape of protein folding: A synthesis. Proteins. 1995;21:167–195. doi: 10.1002/prot.340210302. [DOI] [PubMed] [Google Scholar]
- Chen VB, Headd JJ, Keedy DA, Immormino RM, Kapral GJ, Murray LW, et al. MolProbity: all-atom structure validation for macromolecular crystallography. Acta Crystallographica D. 2010;66:12–21. doi: 10.1107/S0907444909042073. [DOI] [PMC free article] [PubMed] [Google Scholar]
- Conway P, Tyka MD, DiMaio F, Konerding DE, Baker D. Relaxation of backbone bond geometry improves protein energy landscape modeling. Protein Sci. 2014;23(1):47–55. doi: 10.1002/pro.2389. [DOI] [PMC free article] [PubMed] [Google Scholar]
- Fennel CJ, Kehoe CW, Dill KA. Modeling aqueous solvation with semi-explicit assembly. Proc Natl Acad Sci. 2010;108:3234–3239. doi: 10.1073/pnas.1017130108. [DOI] [PMC free article] [PubMed] [Google Scholar]
- Haberthur U, Caflisch A. FACTS: Fast analytical continuum treatment of solvation. J Comput Chem. 2008;29:701–715. doi: 10.1002/jcc.20832. [DOI] [PubMed] [Google Scholar]
- Heo L, Park H, Seok C. GalaxyRefine: protein structure refinement driven by side-chain repacking. Nucleic Acids Res. 2013;41(W):W384–W388. doi: 10.1093/nar/gkt458. [DOI] [PMC free article] [PubMed] [Google Scholar]
- Kopp J, Bordoli L, Battey JN, Kiefer F, Schwede T. Assessment of CASP7 predictions for template-based modeling targets. Proteins. 2007;69(S8):36–56. doi: 10.1002/prot.21753. [DOI] [PubMed] [Google Scholar]
- Kota P, Ding F, Ramachandran S, Dokholyan NV. Gaia: automated quality assessment of protein structure models. Bioinformatics. 2011:2209–2215. doi: 10.1093/bioinformatics/btr374. [DOI] [PMC free article] [PubMed] [Google Scholar]
- Lazaridis T, Karpuls M. Effective energy function for proteins in solution. 1999;35(2):133–152. doi: 10.1002/(sici)1097-0134(19990501)35:2<133::aid-prot1>3.0.co;2-n. [DOI] [PubMed] [Google Scholar]
- Leaver-Fay A, Tyka MD, Lewis SM, Lange OF, Thopson J, Jacak R, et al. Rosetta3: an object-oriented software suite for the simulation and design of macromolecules. Methods Enzymol. 2014;487:545–574. doi: 10.1016/B978-0-12-381270-4.00019-6. [DOI] [PMC free article] [PubMed] [Google Scholar]
- Liu Y, Kellog E, Liang H. Canonical and micro-canonical analysis of folding of trpzip2: An all-atom replica exchange Monte Carlo simulation study. J Chem Phys. 2012;137045103(4) doi: 10.1063/1.4738760. [DOI] [PubMed] [Google Scholar]
- Mariani V, Biasini M, Barbato A, Schwede T. lDDT: a local superposition-free score for comparing protein structures and models using distance difference tests. Bioinformatics. 2013;29(21):2722–2728. doi: 10.1093/bioinformatics/btt473. [DOI] [PMC free article] [PubMed] [Google Scholar]
- Mirjalili V, Feig M. Protein structure refinement through structure selection and averaging from molecular dynamics ensembles. J Comput Chem Theory. 2012;(9):1294–1303. doi: 10.1021/ct300962x. [DOI] [PMC free article] [PubMed] [Google Scholar]
- Mirjalili V, Noyes K, Feig M. Physics-based protein structure refinement through multiple molecular dynamics trajectories and structure averaging. Proteins. 2014;82(S2):196–207. doi: 10.1002/prot.24336. [DOI] [PMC free article] [PubMed] [Google Scholar]
- Moult J, Fidelis K, Kryshtafovych A, Schwede T, Tramontano A. Critical assessment of methods of protein structure prediction (CASP) - round X. Proteins. 2014;82(S2):1–6. doi: 10.1002/prot.24452. [DOI] [PMC free article] [PubMed] [Google Scholar]
- Nugent T, Cozzetto D, Jones DT. Evaluation of predictions in the CASP10 model refinement category. Proteins. 2014;82(S2):98–111. doi: 10.1002/prot.24377. [DOI] [PMC free article] [PubMed] [Google Scholar]
- Park H, Seok C. Refinement of unreliable local regions in template-based protein models. Proteins. 2012;80(8):1974–1986. doi: 10.1002/prot.24086. [DOI] [PubMed] [Google Scholar]
- Phillips JC, Braun R, Wang W, Gumbart J, Tajkhoshid E, Elizabeth V, et al. Scalable molecular dynamics with NAMD. J Comput Chem. 2005;26:1781–1802. doi: 10.1002/jcc.20289. [DOI] [PMC free article] [PubMed] [Google Scholar]
- Song Y, DiMaio F, Wang RYR, Kim DE, Miles C, Brunette T, et al. High resolution comparative modeling with RosettaCM. Structure. 2013;21(10):1735–1742. doi: 10.1016/j.str.2013.08.005. [DOI] [PMC free article] [PubMed] [Google Scholar]
- Stein A, Kortemme T. Improvements to robotics-inspired conformational sampling in rosetta. PLoS One. 2013;8(5):e63090. doi: 10.1371/journal.pone.0063090. [DOI] [PMC free article] [PubMed] [Google Scholar]
- Taketomi H, Ueda Y, Go N. Studies on protein folding, unfolding and fluctuations by computer simulation. I. The effect of specific amino acid sequence represented by specific inter-unit interactions. Int J Pept Protein Res. 1975;7:445–459. [PubMed] [Google Scholar]
- Tyka MD, Keedy DA, Andre I, DiMaio F, Song Y, Richardson DC, et al. Alternate states of proteins revealed by detailed energy landscape mapping. J Mol Biol. 2011;405:607–618. doi: 10.1016/j.jmb.2010.11.008. [DOI] [PMC free article] [PubMed] [Google Scholar]
- Yang Y, Zhou Y. Ab initio folding of terminal segments with secondary structures reveals the fine difference between two closely related all-atom statistical energy functions. Protein Sci. 2008;17(7):1212–1219. doi: 10.1110/ps.033480.107. [DOI] [PMC free article] [PubMed] [Google Scholar]
- Zhou H, Skolnick J. GOAP: A generalized orientation-dependent, all-atom statistical potential for protein structure prediction. Biophyis J. 2011;101(8):2043–2052. doi: 10.1016/j.bpj.2011.09.012. [DOI] [PMC free article] [PubMed] [Google Scholar]
Associated Data
This section collects any data citations, data availability statements, or supplementary materials included in this article.