Abstract
To model the Fåhræus–Lindqvist effect, Haynes’ marginal zone theory is used, following previous works, i.e., a core layer of uniform red blood cells (RBCs) is assumed to be surrounded by an annular plasma layer in which no RBCs are present. A simplified trial-and-error solution procedure is provided to determine the size of the core region and the hematocrit level in that zone in addition to the apparent viscosity, given the (upstream) large vessel hematocrit level and the average hematocrit level in the (downstream) small vessel. To test the model, a set of experimental data is selected to provide not only apparent viscosity data but also the average hematocrit levels in small tubes of different diameters. The results are found to support Haynes’ marginal theory, with no fitting parameters used in the computations. Viscous dissipation is determined. The use of the mechanical energy balance is found to lead to results that are consistent with those based on the momentum balance, while leaving the average hematocrit level undetermined and required by either experimental data or an additional equation based on further theoretical work. The present analysis is used to model bifurcation using published empirical correlations quantifying the Fåhræus effect and phase separation. The model equations are extended to microvascular networks with repeated bifurcations.
Keywords: Fåhræus effect, Red blood cell, Axial accumulation, Viscous dissipation, Blood viscosity, Bifurcation, Microvascular network, Arterioles, Cell depletion
Introduction
As blood flow occurs from a large vessel to a small-diameter one (less than about 0.3 mm), the hematocrit level decreases (Fåhræus effect) [1]. A decrease in the apparent viscosity as the vessel diameter decreases also occurs (Fåhræus and Lindqvist effect) [2].
A review of the Fåhræus and Fåhræus–Lindqvist effects is provided in [3–5], with a review of the mechanisms in [5] and the progress of Fåhræus’ conceptions in cardiovascular physiology [4]; in particular the Fåhræus–Lindqvist effect was associated by Fåhræus and Lindqvist of the accumulation of red blood cells (RBCs) [5] (shown schematically in Fig. 1), leading to a decrease in the apparent viscosity. Most of the resistance to blood flow occurs in the microvascular part, where the Fåhræus–Lindqvist effect reduces microvascular resistance [5, 6]. With very small tube diameters, excluded in the present analysis (less than 4–6 μm), the apparent viscosity increases drastically when the tube diameter decreases, as RBCs must deform for flow to occur [3]. The present work extends previous investigations, based on Haynes’ marginal theory [7], i.e., blood flow in small diameter vessels is considered and a two-layer model is considered: in the core layer, RBCs aggregate and in the outer one the plasma is free from any RBCs (Fig. 2), consistent with the RBC axial accumulation mechanism given by Fåhræus–Lindqvist for the reduction of apparent viscosity [5].
Fig. 1.

Schematic figure of the Fåhræus effect using the notations for the hematocrit level changes in [3] from HF in the arterial end to HD in the venous end and HT in the intermediate vessel
Fig. 2.

Schematic figure of Haynes’ model [4] showing an annular region without RBCs (plasma) and a core layer assumed to have a uniform concentration of RBCs
A review of microvascular network models can be found in [8, 9]. The Fåhræus and Fåhræus–Lindqvist effects, along with phase-separation effects leading to disproportionate distributions of hematocrit in daughter branches (in bifurcations), are considered in [10] using empirical correlations. The RBC transport model in Pries et al. [10] is revisited in [9] using a continuous (rather than discrete) RBC distribution for an efficient solution algorithm for pressure, flow, and hematocrit distribution in large capillary networks. The migration of RBCs in microvessels is considered in two and three dimensions in [11] and [12], respectively; a large number of RBCs is considered as liquid capsules, allowing for the deformation of RBCs. Mansour et al. [13] used the Quemada viscosity model [14], along with the Phillips model [15] to account for shear-induced diffusion and hydrodynamic interactions while accounting for the variation of the diffusion parameters with the tube hematocrit and dimensionless local radius to account for RBC deformability. Bressloff et al. [16] used the Quemada viscosity model along with diffusion in a cell migration model to study cell depletion and hematocrit distribution in a side branch (bifurcation); the analysis shows relatively few RBCs attaining the side branch from the main branch and little effect of the side branch angle.
Following the work of Fournier [3] based on Haynes’ marginal zone theory [4], the present work provides a simple solution procedure and general results for the size of the core region, the hematocrit level in the core region, and the ratio of apparent viscosity to blood flow viscosity at a hematocrit level assumed to be 40% (as an example) at two temperatures: 37 and 20 °C, for different hematocrit levels in smaller vessels. Previous work by Sharan and Popel [17] used Haynes’ marginal theory, while adopting the correlations in Pries et al. [8, 10] quantifying the Fåhræus effect (in a modified form) and those quantifying the Fåhræus–Lindqvist effect; the cell-free layer viscosity is considered different from the plasma’s viscosity due to additional viscous effects caused by roughness of the interface between the core and annular layers (determined numerically using a PDE finite element package). The normalized cell-free layer viscosity is then determined as an unknown using the correlations referred to above.
In the first part of the present investigation, no fitting parameter is used and the Fåhræus effect is obtained from experimental data [18], whereas the Fåhræus–Lindqvist effect is estimated with the results compared with Azelvandre and Oiknine’s experimental data [18] at a hematocrit level of 35% (large tube) and a temperature of 20 °C. In addition, viscous dissipation effects are considered, including the impact of the size of the core region on friction losses. The governing equations are presented first, followed by the solution procedure and results. In the second part, the model equations needed to solve microvascular network blood and erythrocyte flow problems (where repeated bifurcations occur) are presented, using the experimentally determined correlations by Pries et al. [8, 10] for the Fåhræus effect and the phase separation effect (leading to disproportionate distributions of blood flow and total hematocrit between the daughter branches in the case of bifurcation).
Governing equations
The present model is built upon Haynes’ marginal theory [7], in which two layers for flow are considered. The governing equations based on the momentum and mass balances [3] are reviewed and the solution is presented with the final results compared with those in [3]. Viscous dissipation effects are considered along with the mechanical energy balance.
Velocity profiles
The boundary conditions are: continuity of the velocity and shear rates at the interface r = r∗ between the two layers [3, 19]:
| 1 |
| 2 |
The other two conditions are finite shear stress at r = 0 and the no-slip boundary condition at the capillary wall.
| 3 |
| 4 |
The annular region is assumed to be free from any RBCs and the core region is assumed to have a uniform hematocrit level, HT. Applying the momentum balance to the core and annular zones, respectively, while using Eqs. (2) and (3), yields
| 5 |
| 6 |
in which μc and μa represent the core and annular (RBC-free) layer viscosities, respectively, and C is the pressure gradient
| 7 |
where L is the capillary length. Integration leads to
| 8 |
where vm is the maximum velocity reached at the centerline. For the annular region, the velocity profile is given by
| 9 |
The use of Eq. (1) provides the following expression for vm
| 10 |
The volume flow rates are determined by applying the above-determined velocity profiles using
| 11 |
| 12 |
The total flow rate is the sum of Qa and Qc,
| 13 |
Relation between hematocrit and apparent viscosity
The conservation of mass provides the following relation:
| 14 |
Using the above equation, along with the following relation relating the average RBC volume fraction in the small capillary HT to the volume fraction in the core layer HC [3]
| 15 |
leads to
| 16 |
where σ = r∗/R.
Substituting for the flow rates gives
| 17 |
consistent with the treatment in [3].
The apparent viscosity is defined using the Hagen–Poiseuille equation
| 18 |
Using Eq. (13) leads to
| 19 |
Following Fournier [3], Eq. (20) is used to obtain blood viscosity as a function of hematocrit H [20] as
| 20 |
where α is a function of H and T in Kelvin, given by
| 21 |
with H up to 0.6.
Using Eq. (19) along with Eq. (20) leads to
| 22 |
as in [3].
Viscous dissipation
The rates of viscous dissipation per unit length are obtained from the velocity gradients, through integration in the core and annular layers:
| 23 |
| 24 |
The total viscous dissipation is given by the sum of both terms
| 25 |
Substituting for μc using Eqs. (15) and (20) gives
| 26 |
The wall shear stress is obtained from the velocity gradient, using Eq. (10)
| 27 |
Applying the momentum balance yields
| 28 |
which leads to Eq. (7).
Application of the mechanical energy balance leads to
| 29 |
where F is the friction loss per unit mass of fluid given by
| 30 |
leading to
| 31 |
Combining Eqs. (7) and (31) leads to
| 32 |
Dividing the terms in Eqs. (13) and (25) also provides Eq. (32).
Solution procedure and results
Substituting Eqs. (15) and (20) into Eq. (17) yields
| 33 |
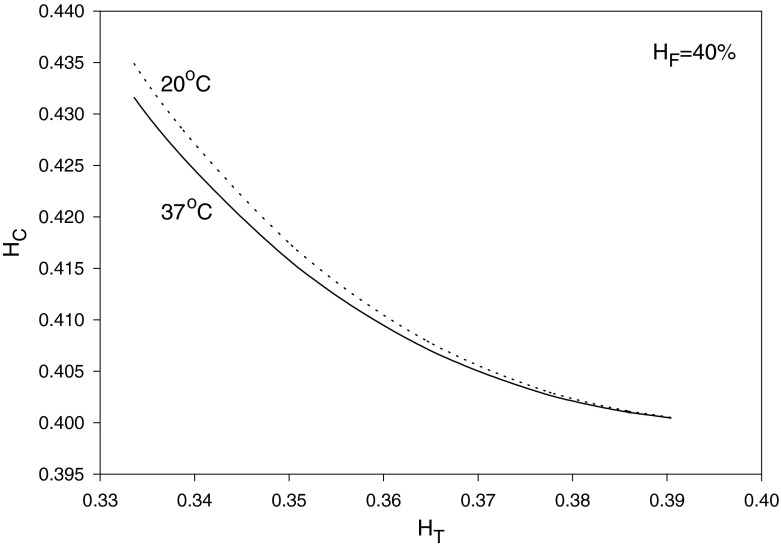
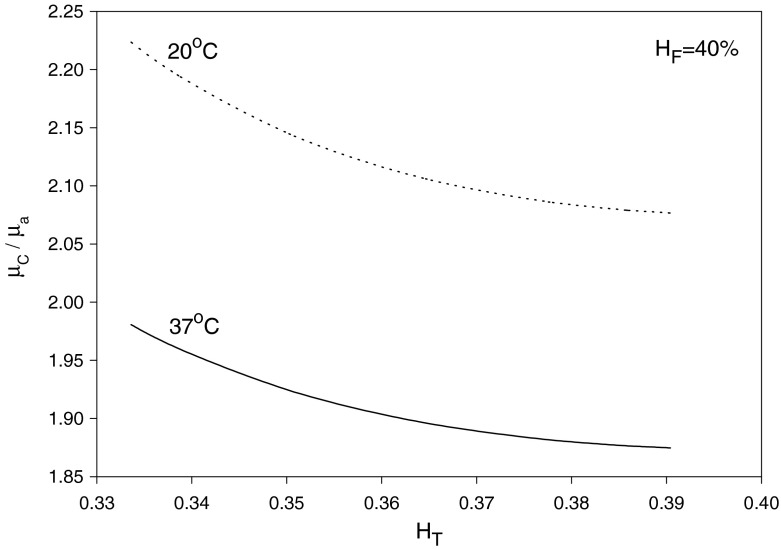
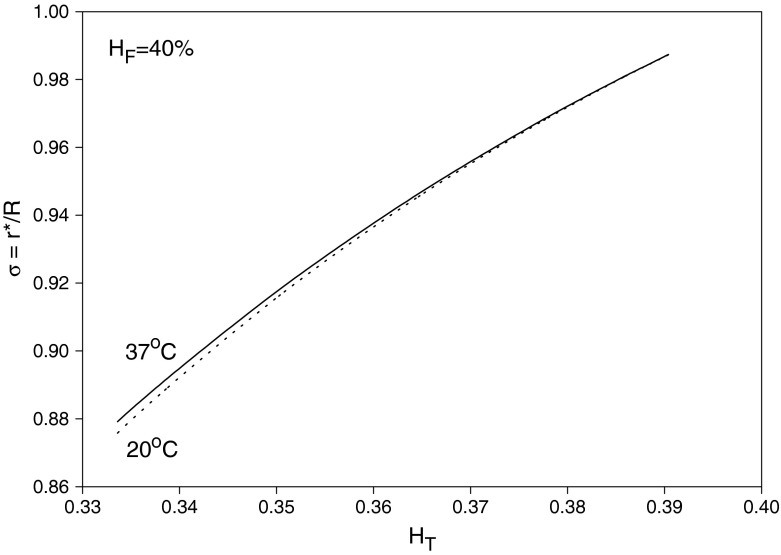
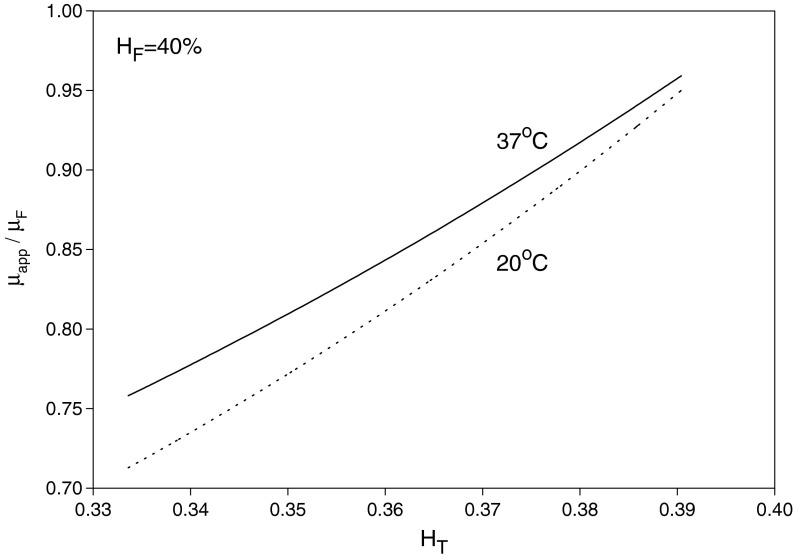
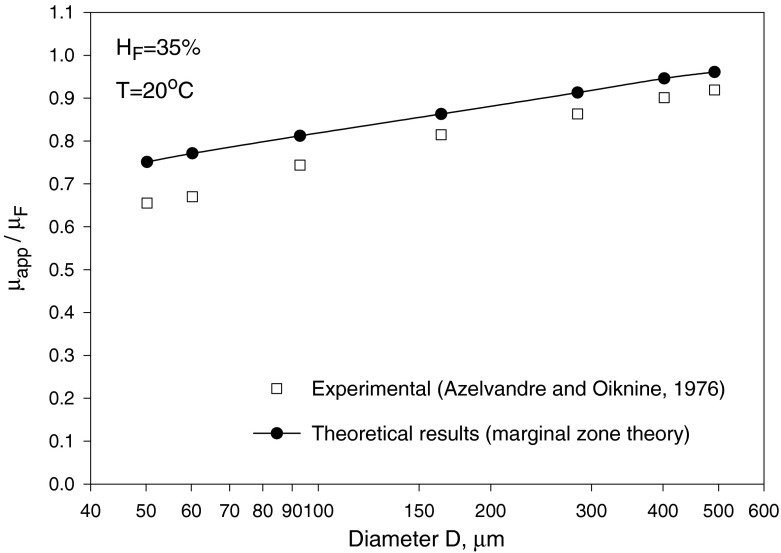
where αC is given by Eq. (21) as a function of HC and T. Given values of HT, HD = HF and T, Eq. (33) can be solved, using Eq. (21), to obtain HC and αC. Then, substituting for HC into Eqs. (20) and (21) yields μC/μa and σ = r∗/R, respectively. Finally, Eq. (22) provides μapp/μF after substituting for HC, αC and σ. The results are shown in Figs. 3, 4 and 5 for HF = 40% at temperatures 20 and 37 °C. As seen in Fig. 3, HC increases as HT decreases (i.e., as the small vessel diameter decreases: Fåhræus effect); as a result, μC/μa also increases. On the other hand, the core-layer size decreases as HT decreases (Fig. 4), which is expected for a fixed HF as HC increases. The Fåhræus–Lindqvist effect is clear in Fig. 6, with a decrease in apparent viscosity as HT decreases (smaller vessel diameter). One effect of temperature decrease is a slight increase of HC (Fig. 3), resulting in a slight decrease in the relative size of the core region σ (Fig. 5). The other effect of lower temperature is an increase in the core region viscosity (Fig. 4) and the apparent viscosity (enhanced at a smaller vessel diameter as seen in Fig. 6). Relevant experiments are summarized in [3, 21]. Ref. [18] provides data for both HT (solid curved line fit in Fig. 4 in [18]) and apparent viscosity (Fig. 5 in [18]) with μF given in Fig. 3 [18] at HF = 35% and a temperature of 20 °C. The results (obtained with HF = 35% and T = 20 °C) based on Haynes’ marginal zone theory, are found to compare favorably with the experimental data (Fig. 7).
Fig. 3.
Variation of core zone hematocrit level with HT
Fig. 4.
Variation of the ratio of the core zone viscosity to the free RBC layer viscosity with HT
Fig. 5.
Variation of the core zone size with HT
Fig. 6.
Variation of the ratio of the apparent small vessel viscosity to the upstream large vessel viscosity with HT
Fig. 7.
Comparison of Haynes’ marginal zone theory apparent viscosity results with Azelvandre and Oiknine’s experimental data at HF = 35% and T = 20 °C [18]
Bifurcation and network
General network case
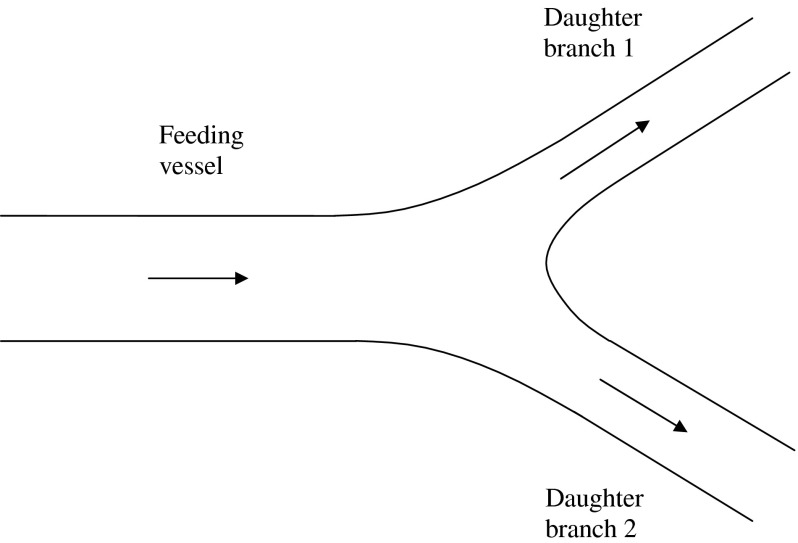
Bifurcation occurs repeatedly in arteriole networks and results in splitting of the flow at each bifurcation. A schematic of one bifurcation is shown in Fig. 8. Different diameters are found to have different values of HC, HT, and σ as seen from the results presented above.
Fig. 8.
Schematic of a bifurcation showing the feeding vessel and the daughter branches 1 and 2
The network consists of different capillaries and nodes. The models in [10, 22] rely on the Hagen–Poiseuille equation applied to each capillary and the mass balance to each node. The splitting of the flow and RBCs between the two branches is disproportionate (phase separation) [10]. Using the same notations in [10] for conductance J = Q/ΔP, we have
| 34 |
which gives
| 35 |
The conductances are obtained from the Hagen–Poiseuille equation, Eq. (18), in each capillary (including the mother branch) as
| 36 |
Extending the analysis presented earlier yields the relative apparent viscosity as a function of capillary diameter, temperature and feed hematocrit level HD. Combining Eqs. (19) and (20) while using Eq. (15) yields for each daughter branch
| 37 |
To solve for HT,i the following equation can be used
| 38 |
as an application of the correlation in Pries et al. [8] for HT, where HD is changed to HDλi/ηi, equal to the erythrocyte flow passing through capillary i, QHDλi, divided by the blood flow rate in the same capillary, Qηi. To solve for HC,i in Eq. (37), the following equation extending Eq. (33) to the bifurcation case, is required
| 39 |
Solving the system of equations obtained for each node, Eq. (35), is by trial and error, using the conductance expression, Eq. (36), and the apparent viscosity expression, Eq. (37), for each capillary. The split flow ratios (blood flow fractions), needed in Eq. (39), are obtained as
| 40 |
with
| 41 |
The split ratio for the hematocrit (erythrocyte flow fraction) in branch 1 is acquired from the experimentally determined expressions in [10] combined in a compact form as
| 42 |
where X0 is the minimum blood flow split ratio required to bring RBCs inside the branch. The RBC mass balance yields
| 43 |
where λ1 and λ2 are the hematocrit split ratios in branches 1 and 2. Finally, the core size in each branch is obtained from Eq. (15) as σi = (HT,i/HC,i)1/2 (i = 1, 2).
Solution in the case of a given pressure gradient ratio in daughter branches
Pressures at the different nodes are obtained by trial-and-error solutions for the whole network as discussed above. However it is possible to obtain a solution in a given bifurcation, once the ratio of the pressure gradient is selected as shown below.
Using Eqs. (36) and (37) gives
| 44 |
Using Eq. (44) yields the ratio
| 45 |
Making use of Eq. (41) then gives
| 46 |
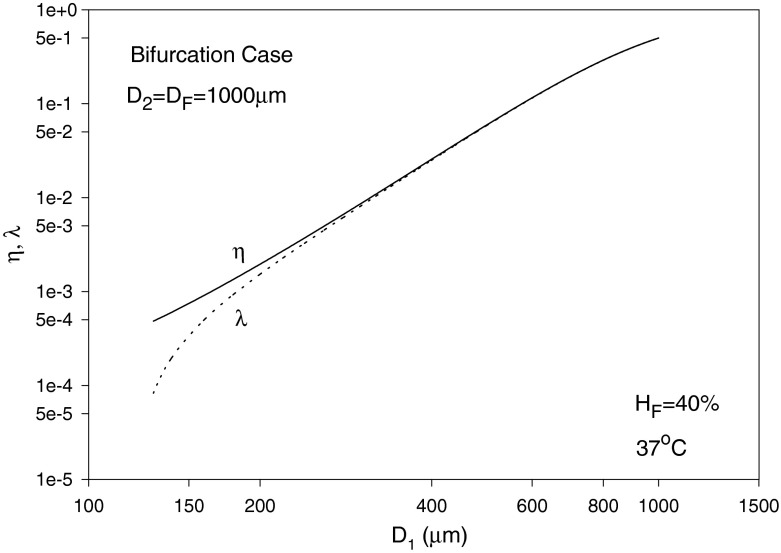
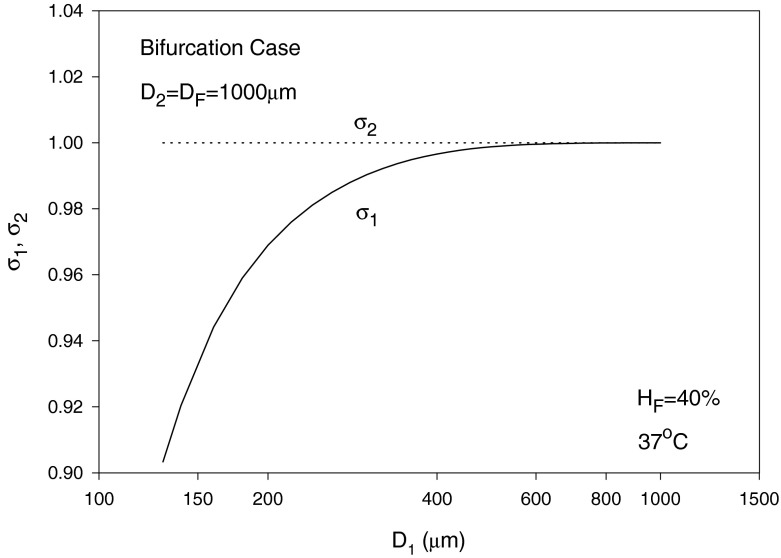
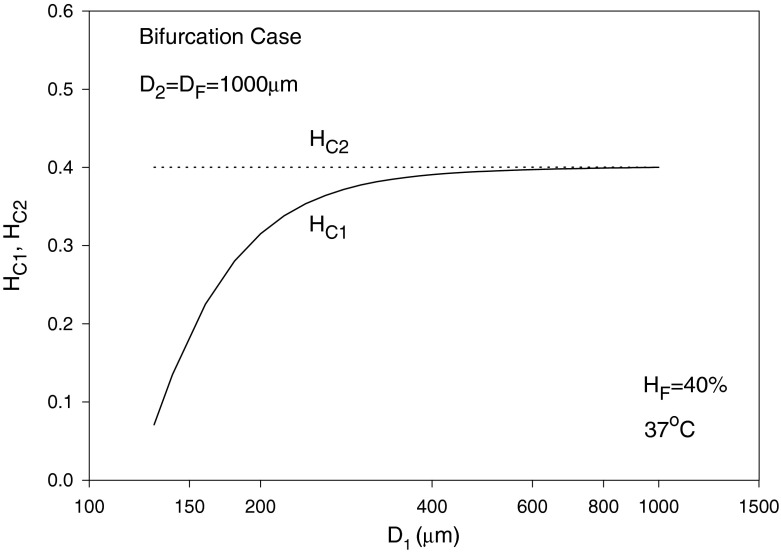
In the following, we assume the same pressure gradient, i.e., C1 = C2, as an example, which discards the effect of pressure gradient when comparing blood and erythrocyte flows in branches 1 and 2. The diameters are assumed to be D2 = D = 1,000 μm, D1 is varied from 70–1,000 μm and HD = HF = 40% with T taken as 37 °C. The solution is by trial and error. To start calculations, a guessed value of η1 = 1.5 X0 is used. The value of λ1 is then calculated using Eq. (42). Using Eq. (38) leads to HT1 and HT2. Equation (39) can then be solved using the regula falsi method to obtain HC1 and HC2. Substituting into Eq. (46) with C1 = C2 provides a new guess for η1. The procedure is repeated until convergence is reached. η2 and λ2 are obviously given by Eqs. (41) and (43), respectively, and σi (i = 1, 2) are obtained from Eq. (15) as mentioned earlier. The results for the blood flow and erythrocyte split ratios in the smaller branch (of diameter D1) are shown in Fig. 9, showing a phase separation effect at smaller values of D1. For the case considered, Eq. (42) yields a minimum blood flow split ratio (at which no RBCs pass through the branch) of X0 = 0.4/D = (0.4/1,000), occurring at D1 slightly below 130 μm as seen from Fig. 9. The relative core region size in the smaller branch σ1 is seen to increase and reaches a value of 1 at large diameter values (Fåhræus effect), whereas σ2 is obviously equal to 1 as perceived from Fig. 10. The core layer hematocrit volume fraction HC1 increases with diameter and reaches HC2 as the diameters become equal (Fig. 11).
Fig. 9.
Variation of the blood flow split ratio η1 and hematocrit split ratio λ1, with D1 (smaller branch diameter)
Fig. 10.
Variation of the relative core regions sizes σ1 and σ2 with diameter D1
Fig. 11.
Variation of the core layer hematocrit volume fractions HC1 and HC2 with D1
Conclusions
The results for the apparent viscosity in smaller vessels show a reduction in the apparent viscosity as the vessel diameter decreases (Fåhræus–Lindqvist effect) and are found to support Haynes’ marginal theory (with deviations from experimental data [18] within 4.6–15.1%) without the use of any fitting parameter in the computations. The decrease in apparent viscosity has physiological effects as it lowers microvascular resistance to blood flow and results in lower blood pressures [5]. The proposed solution procedure provides the core region size along with the core region hematocrit level and viscosity of this layer. Viscous dissipation is found. The use of the mechanical energy balance provides results that are consistent with those based on the momentum balance, leaving the average hematocrit level (HT) reduction (Fåhræus effect) undetermined. Using Haynes’ marginal zone theory, as extended in [3, 17] and in the present analysis, and the equations in Pries et al. [8, 10] for HT and erythrocyte flow ratio, a model is provided for microvascular networks with repetitive bifurcations.
References
- 1.Fåhræus R. The suspension stability of blood. Physiol. Rev. 1929;9:241–274. [Google Scholar]
- 2.Fåhræus, R., Lindqvist, T.: The viscosity of the blood in narrow capillary tubes. Am. J. Physiol. 96(562–568) (1931)
- 3.Fournier, R.L.: Basic Transport Phenomena in Biomedical Engineering. CRC Press, Boca Raton (2012)
- 4.Goldsmith HL, Cokelet GR, Gaehtgens P. Robin Fåhræus: evolution of his concepts in cardiovascular physiology. Am. J. Physiol. Heart Circ. Physiol. 1989;257:H1005–H1015. doi: 10.1152/ajpheart.1989.257.3.H1005. [DOI] [PubMed] [Google Scholar]
- 5.Toksvang LN, Berg RMG. Using a classic paper by Robin Fåhræus and Torsten Lindqvist to teach basic hemorheology. Adv. Physiol. Educ. 2013;37:129–133. doi: 10.1152/advan.00009.2013. [DOI] [PubMed] [Google Scholar]
- 6.Secomb, T.W., Pries, A.R.: Blood viscosity in microvessels: Experiment and theory. Comptes Rend. Phys. 14, 470–478 (2013) [DOI] [PMC free article] [PubMed]
- 7.Haynes RF. Physical basis of the dependence of blood viscosity on tube radius. Am. J. Physiol. 1960;198:1193–1200. doi: 10.1152/ajplegacy.1960.198.6.1193. [DOI] [PubMed] [Google Scholar]
- 8.Pries AR, Neuhaus D, Gaehtgens P. Blood viscosity in tube flow: dependence on diameter and hematocrit. Am. J. Physiol. Heart Circ. Physiol. 1992;263:H1770–H1778. doi: 10.1152/ajpheart.1992.263.6.H1770. [DOI] [PubMed] [Google Scholar]
- 9.Obrist D, Weber B, Buck A, Jenny P. Red blood cell distribution in simplified capillary networks. Phil. Trans. R. Soc. A. 2010;368:2897–2918. doi: 10.1098/rsta.2010.0045. [DOI] [PubMed] [Google Scholar]
- 10.Pries AR, Secomb TW, Gaehtgens P, Cross JF. Blood flow in microvascular networks. Experiments and simulation. Circ. Res. 1990;67:826–834. doi: 10.1161/01.RES.67.4.826. [DOI] [PubMed] [Google Scholar]
- 11.Bagchi P. Mesoscale simulation of blood flow in small vessels. Biophys. J. 2007;92:1858–1877. doi: 10.1529/biophysj.106.095042. [DOI] [PMC free article] [PubMed] [Google Scholar]
- 12.Doddi, S.K., Bagchi, P.: Three-dimensional computational modeling of multiple deformable cells flowing in microvessels. Phys. Rev. E 79, 1–14 (2009) [DOI] [PubMed]
- 13.Mansour MH, Bressloff NW, Shearman CP. Red blood cell migration in microvessels. Biorheology. 2010;47:73–93. doi: 10.3233/BIR-2010-0560. [DOI] [PubMed] [Google Scholar]
- 14.Quemada D. Rheology of concentrated disperse systems: A model for non-Newtonian shear viscosity in steady flows. Rheol. Acta. 1978;17:632–642. doi: 10.1007/BF01522036. [DOI] [Google Scholar]
- 15.Phillips RJ, Armstrong RC, Brown RA. A constitutive equation for concentrated suspensions that accounts for shear-induced particle migration. Phys. Fluids. 1992;4:30–40. doi: 10.1063/1.858498. [DOI] [Google Scholar]
- 16.Bressloff NW, Mansour MH, Shearman CP. Microvascular cell depletion model. IFMBE Proc. 2009;25/IV:2095–2098. [Google Scholar]
- 17.Sharan M, Popel AS. A two-phase model for flow of blood in narrow tubes with increased effective viscosity near the wall. Biorheology. 2001;38:415–428. [PubMed] [Google Scholar]
- 18.Azelvandre F, Oiknine C. Effet Fåhræus et effet Fåhræus-Lindqvist: Résultats expérimentaux et modèles théoriques. Biorheology. 1976;13:325–335. [PubMed] [Google Scholar]
- 19.Bird RB, Stewart WE, Lightfoot EN. Transport Phenomena. New York: John Wiley; 2007. [Google Scholar]
- 20.Charm SE, Kurland GS. Blood Flow and Microcirculation. New York: John Wiley; 1974. [Google Scholar]
- 21.Gaehtgens, P.: Flow of blood through narrow capillaries: rheological mechanisms determining capillary hematocrit and apparent viscosity. Biorheology 17, 183–189 (1980) [DOI] [PubMed]
- 22.Lipowsky HH, Zweifach BW. Network analysis of microcirculation of cat mesentery. Microvasc. Res. 1974;7:73–83. doi: 10.1016/0026-2862(74)90038-7. [DOI] [PubMed] [Google Scholar]


