

Abstract
Objective:
To test blood and CSF neurofilament light chain (NfL) levels in relation to disease progression and survival in amyotrophic lateral sclerosis (ALS).
Methods:
Using an electrochemiluminescence immunoassay, NfL levels were measured in samples from 2 cohorts of patients with sporadic ALS and healthy controls, recruited in London (ALS/control, plasma: n = 103/42) and Oxford (ALS/control, serum: n = 64/36; paired CSF: n = 38/20). NfL levels in patients were measured at regular intervals for up to 3 years. Change in ALS Functional Rating Scale–Revised score was used to assess disease progression. Survival was evaluated using Cox regression and Kaplan–Meier analysis.
Results:
CSF, serum, and plasma NfL discriminated patients with ALS from healthy controls with high sensitivity (97%, 89%, 90%, respectively) and specificity (95%, 75%, 71%, respectively). CSF NfL was highly correlated with serum levels (r = 0.78, p < 0.0001). Blood NfL levels were approximately 4 times as high in patients with ALS compared with controls in both cohorts, and maintained a relatively constant expression during follow-up. Blood NfL levels at recruitment were strong, independent predictors of survival. The highest tertile of blood NfL at baseline had a mortality hazard ratio of 3.91 (95% confidence interval 1.98–7.94, p < 0.001).
Conclusion:
Blood-derived NfL level is an easily accessible biomarker with prognostic value in ALS. The individually relatively stable levels longitudinally offer potential for NfL as a pharmacodynamic biomarker in future therapeutic trials.
Classification of evidence:
This report provides Class III evidence that the NfL electrochemiluminescence immunoassay accurately distinguishes patients with sporadic ALS from healthy controls.
Various factors militate against the development of reliable biomarkers in amyotrophic lateral sclerosis (ALS), including clinical heterogeneity, variable rate of progression, and the lack of a recognizable preclinical state of this fatal neurodegenerative disorder. An easily accessible and reproducible prognostic biomarker would help patient stratification, improving assessment of individual prognosis and care-planning. It might also have potential as a pharmacodynamic measure of therapeutic response.
The longitudinal assessment of a putative biomarker would allow a more reliable interpretation of the biomarker's behavior when monitoring treatment response. Blood-based biomarkers are preferable because they require minimally invasive collection compared to CSF sampling. Neurofilaments (Nfs), the main byproducts of neuroaxonal breakdown, are potential “universal” biomarkers of neurodegeneration.1 Nf levels in CSF from patients with ALS increase significantly compared to other neurodegenerative disorders2–4 or to ALS-mimics,5 and show a robust interlaboratory reproducibility compared to other biomarkers.6 Nf bioavailability and measurement depend on matrix-related biological phenomena such as protein aggregation, as recently reported.7,8
In this study, we examined the prognostic value in ALS of neurofilament light chain (NfL), one of the main constituents of neurons and axons, building on previous small cross-sectional studies9–11 to evaluate the temporal profile of NfL expression in plasma, serum, and CSF from patients with ALS.
METHODS
Standard protocol approvals, registrations, and patient consents.
Approvals were obtained from the East London and the City Research Ethics Committee 1 (09/H0703/27) and South Central Oxford Ethics Committee B (08/H0605/85). All participants provided written consent (or gave verbal permission for a carer to sign on their behalf).
Participants and sampling.
This study included 103 patients with ALS and 42 healthy controls from a London cohort and 64 patients with ALS and 36 healthy controls from an Oxford cohort. Patients with ALS were diagnosed according to standard criteria,12 having been examined by experienced ALS neurologists (London cohort: A.M., K.S., R.O., R.H., M.F.; Oxford cohort: M.R.T., K.T.). Those with a family history of ALS or frontotemporal dementia, or known to carry a genetic mutation linked to ALS or frontotemporal dementia, were excluded to minimize any potential biases. Healthy controls were typically spouses and friends of patients. Exclusion criteria included neurologic comorbidities likely to affect Nf bioavailability.13–15
Baseline NfL levels were measured in plasma, serum, and CSF samples. Serial plasma samples and clinical information were obtained, on average, every 2 to 4 months from 67 of the 103 patients with ALS recruited in London. Serum and CSF samples (where possible) were collected every 6 months from 43 and 24 of the 64 patients with ALS in Oxford. No selection criteria were applied to individuals with ALS sampled longitudinally, other than their willingness to donate further samples. Symptom onset was defined as first patient-reported weakness. Progression rate was calculated at baseline (PRB) or last visit (PRL) as 48 minus the ALS Functional Rating Scale–Revised score, divided by the disease duration from onset of symptoms. Progression rate less than 0.5, between 0.5 and 1.0, and more than 1.0 (point/month) was defined as slow (ALS-slow), intermediate (ALS-intermediate), and fast progressing ALS (ALS-fast), respectively. Use of riluzole (or not) at the time of sampling was recorded.
Sample analysis.
Plasma, serum, and CSF samples were processed and aliquoted within 1 hour from collection and frozen at −80°C, following standard consensus procedures.16 An electrochemiluminescence immunoassay was used to quantify NfL as previously described9; the investigators were blinded to clinical data. ALS and control samples were evenly distributed on each plate and measured in duplicate at the same dilution. Each plate contained calibrators (0–10,000 pg/mL) and quality controls. The interassay coefficients of variance were mostly below 10% and the mean intraassay coefficients of variance were below 10%. Linearity of the NfL assay was established (0–50,000 pg/mL) as previously reported.9
Statistical analysis.
Continuous variables were summarized in median (interquartile range); hence, nonparametric analysis for group comparisons and correlation analysis. Receiver operating characteristic curve analysis was used to assess assay sensitivity/specificity. We used log rank analysis to compare survival (fixed date was used to censor data for survival analysis) and multilevel random intercept models with a linear slope to examine NfL longitudinal trajectories (MLwiN version 2.30, from Stata version 13.1; runmlwin command)17 for the first 15 months of the follow-up period in 3 ALS progression subgroups: slow, intermediate, and fast progressors. A natural log transformation was used to normalize the measurements. Each ALS progression group was included as a categorical fixed effect; we also included an interaction between the ALS progression categories and time to assess whether the rate of change in NfL differed by ALS progression rate. NfL change was jointly modeled with the time to death within the 15-month follow-up period to account for any informative dropout.18 Cox regression analysis of survival by NfL at baseline and other covariates was tested in the London and Oxford cohorts separately and then combined (adjusting for study center). The matched serum and plasma NfL levels from healthy controls in a previous study showed high correlation (n = 25, Spearman ρ = 0.93, p < 0.0001) and strong agreement using Bland-Altman method comparison (bias: 3.92; serum-plasma; 95% confidence interval [CI]: −2.41, 10.25; 95% limits of agreement: −26.15, 33.99; Kuhle et al., unpublished data). We conducted analyses of the 2 cohorts combined, using the corresponding NfL data (serum or plasma) from each cohort. However, in recognition that NfL data from the 2 cohorts were different (albeit highly correlated) measures, we used cohort-specific tertile cutoff levels, and we adjusted Cox regression and Kaplan–Meier survival analyses by center. A p value of less than 0.05 was considered statistically significant.
RESULTS
Demographic and clinical characteristics of the London and Oxford cohorts are summarized in table e-1 on the Neurology® Web site at Neurology.org. Table 1 reports the baseline blood and CSF NfL levels along with the demographic and clinic characteristics of the cohorts.
Table 1.
Summary of blood NfL levels (London, Oxford, and combined cohorts) and of CSF NfL levels (Oxford) used for cross-sectional analysis


Cross-sectional analyses.
NfL levels in CSF (Oxford cohort), serum (Oxford cohort), and plasma (London cohort).
NfL levels were higher in patients with ALS than in controls in all biofluids measured (p < 0.0001; figure 1, A–C, left). Receiver operating characteristic analysis showed an area under the curve for CSF of 0.9987, for serum 0.8626, and 0.8687 for plasma (p < 0.0001; figure 1, A–C, right). Cutoff levels provided clear separation of patients with ALS from controls in all biofluids tested (figure 1, A–C, right).
Figure 1. Summary of the cross-sectional analyses of NfL levels in the Oxford and London cohorts.

NfL levels (median [interquartile range]) in patients with amyotrophic lateral sclerosis and controls in the cross-sectional analysis using (A) CSF, (B) serum, and (C) plasma (Mann–Whitney U test). Results of receiver operating characteristic analysis are shown in the right panel. (D) Matched CSF and serum NfL levels are strongly correlated in controls and in patients with ALS. (E) Blood NfL levels are strongly correlated with progression rate at baseline in both London and Oxford cohorts. AUC = area under the curve; NfL = neurofilament light chain.
Correlation between CSF and serum NfL levels.
NfL levels in matched CSF and serum samples were highly correlated (ALS: r = 0.78, p < 0.0001; controls: r = 0.57, p = 0.008; figure 1D). CSF NfL values were 73.8-fold (interquartile range: 51.9–91.5) and 34.6-fold (17.0–42.0) higher than serum levels in ALS and controls, respectively (p < 0.0001).
Blood NfL levels vs disease progression and duration in ALS.
In both London and Oxford cohorts, blood NfL levels in ALS-fast were significantly higher than in ALS-slow (London: p = 0.0002; Oxford: p = 0.0007), but not in ALS-intermediate (p = 0.0616 and 0.4809, respectively) (table 1). The higher expression of NfL in patients with ALS-fast was confirmed by the strong correlation between blood NfL levels at baseline and PRB in London (Spearman ρ = 0.47, p < 0.0001) and Oxford (r = 0.51, p < 0.0001) cohorts (figure 1E) as well as with PRL in London (r = 0.48, p < 0.0001) and Oxford (r = 0.53, p < 0.0001). PRB was strongly correlated with PRL in both cohorts (London/Oxford: r = 0.93/0.95, p < 0.0001 for both). There was a negative correlation between blood NfL levels and disease duration to baseline (London/Oxford: r = −0.36/−0.50; p = 0.0002/p < 0.0001), while duration to baseline was also negatively correlated with disease progression (London/Oxford: for PRB: r = −0.62/−0.86; for PRL: r = −0.67/−0.87; p < 0.0001 for both).
Effect of sex in blood NfL levels.
The male to female ratio in London, Oxford, and in the combined cohorts was approximately 2:1 (table e-1). In the London cohort and in the combined cohorts, plasma NfL levels were significantly higher in female than in male participants (table 1); London female patients with ALS were older and in a more advanced stage of the disease, while Oxford female and male patients with ALS had similar age and disease severity (table e-2A).
Longitudinal analyses.
The average trajectories of natural log NfL levels from the multilevel model analysis over the first 15 months of the follow-up period in patients with ALS subdivided according to PRL are shown in figure 2 (solid lines), along with the trajectories of the observed log NfL levels for each individual patient with ALS (dashed lines, figure 2). Because PRB and PRL are highly correlated, PRL was chosen for stratification of patients with ALS as more representative of disease progression.
Figure 2. Summary of the longitudinal analyses of NfL levels in the London and Oxford cohorts.

Observed trajectories of log NfL levels in the 15-month follow-up period for individual patients with ALS (dashed lines) and the predicted average trajectories (solid lines) are shown for ALS-fast (red), ALS-intermediate (green), and ALS-slow (blue) patients in the London cohort (plasma, panel A) and Oxford cohort (serum, panel B; CSF, panel C). ALS-fast: progression rate at last visit (PRL) >1.0; ALS-intermediate: PRL 0.5–1.0; ALS-slow: PRL <0.5. ALS = amyotrophic lateral sclerosis; NfL = neurofilament light chain.
A summary of the statistical analysis is shown in table e-3. Baseline natural log plasma, serum, and CSF NfL levels were higher in ALS-fast than in ALS-slow (table e-3, exposure group A) in both London and Oxford cohorts. There was little or no change in plasma NfL levels over time in any of the ALS progression groups in London, while in Oxford, there was a small temporal increase of serum NfL in the ALS-fast group (n = 10; increase per month 4.6% [95% CI: 1.6%, 7.7%]). In Oxford, only 22 of 38 patients went on to have follow-up lumbar punctures, and the follow-up period for the ALS-fast group was shorter. Nonetheless, we observed a small increase in CSF NfL in both slow progressors (n = 9; increase per month 1.3% [95% CI: 0.4%, 2.1%]) and fast progressors (n = 7; increase per month 3.3% [95% CI: 0.8%, 5.9%]), but no significant change in CSF NfL levels in the Oxford intermediate group (n = 8, table e-3).
Baseline NfL levels in our longitudinal cohorts were higher in the ALS-fast subgroup, in line with findings in the cross-sectional study. The NfL blood levels in these patients remained stable over the 15-month follow-up period. Adjustment of the multilevel study of NfL trajectories by time from onset of symptoms to baseline produced only minimal changes, with no impact on the significance of the test (table e-3).
We also used cohort-specific median cutoff for PRL to stratify patients with ALS. No change in blood NfL levels over time were found in below-median and above-median groups (table e-3, exposure groups B), while the baseline NfL levels were higher in the ALS above-median group in the London/plasma (p = 0.01) and the Oxford/serum (p = 0.004) cohorts.
Survival analyses.
Cox regression.
Cox regression analysis of survival (table 2) was examined using baseline blood and CSF NfL levels. In the London cohort, high levels of blood NfL, PRB, and age at symptom onset were associated with poor survival. In the Oxford cohort (serum), only baseline NfL levels, but not PRB, were associated with poor survival. When the number was increased by combining the London and Oxford cohorts, baseline NfL levels, sex, ALS Functional Rating Scale–Revised score at baseline, and age at symptom onset were associated with poor survival. Despite the much smaller case number, CSF NfL levels were also found to be a strong, independent prognostic biomarker for survival.
Table 2.
Summary of Cox regression analysis for mortality in London, Oxford, and in the combined cohorts of patients with ALS
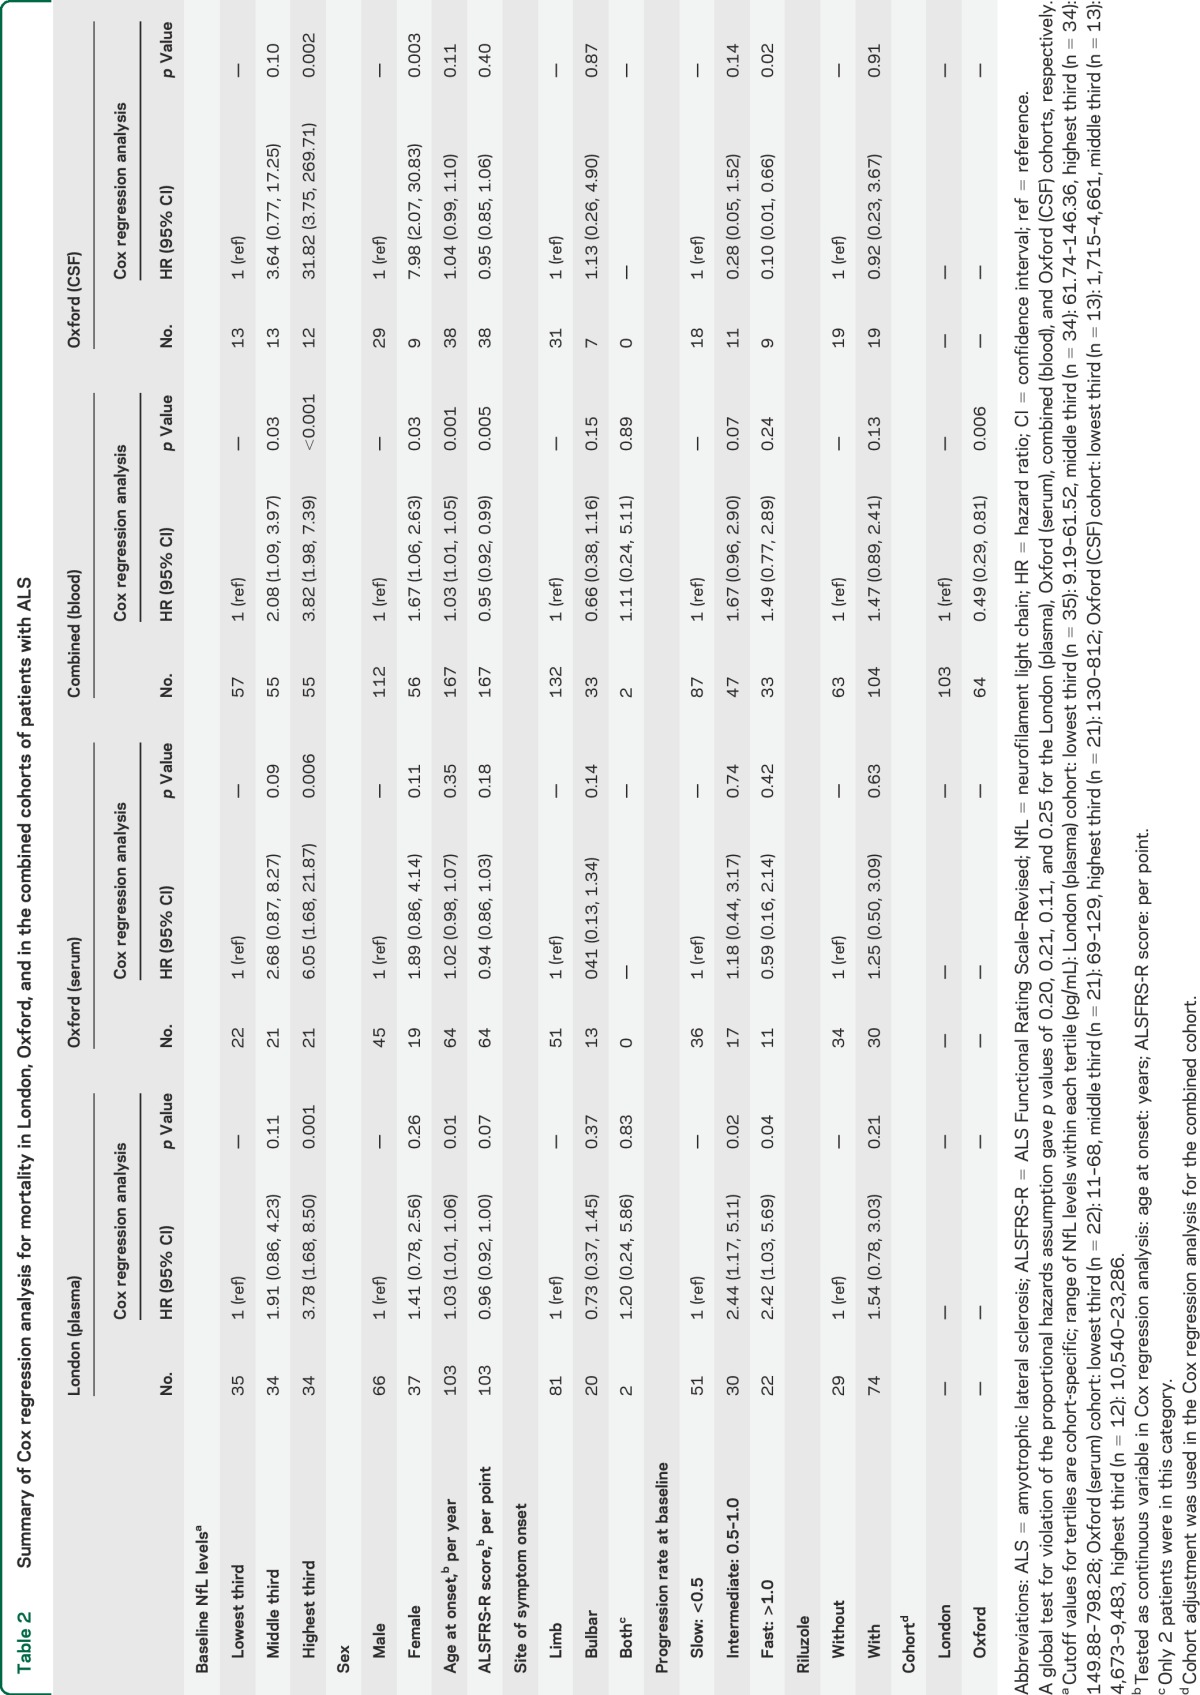
Cox regression analysis was also performed using the time of ALS onset as the start point to evaluate survival, while keeping the baseline (i.e., the first time patients were sampled) as each patient's entry time into the study (i.e., the time from onset to baseline was not “counted” since patients had to survive from onset to baseline to be included in the study). Findings using this approach were not dissimilar from those in which survival was calculated from baseline (table 2).
Kaplan–Meier.
Kaplan–Meier survival curves showed a clear separation of cumulative survivals between subgroups of patients with ALS with different baseline NfL levels (cohort-specific tertile cutoff levels) in the London and in the Oxford cohorts separately and combined (figure 3, A.a–A.c).
Figure 3. Summary of survival analyses in patients with ALS from London and Oxford cohorts separately and combined.

(A) Distinct curves representing cumulative survivals in patients with ALS with different baseline plasma NfL and serum NfL levels in the London cohort (A.a), Oxford cohort (A.b), and combined cohort (A.c). All 3 cohorts were divided by cohort-specific tertile cutoff values. (B) Kaplan–Meier curve of patients with ALS treated with riluzole or untreated in the London cohort (B.a), Oxford cohort (B.b), and combined cohort (B.c).
Riluzole and blood NfL levels.
Treatment with riluzole was associated with increased risk of mortality in the combined cohorts (hazard ratio: 1.47) (table 2). Figure 3 shows the Kaplan–Meier curves for London (figure 3B.a) and Oxford (figure 3B.b) cohorts separately and combined (figure 3B.c). There was no significant difference in baseline blood NfL levels (table 1) and clinical features (table e-2B) in patients with ALS treated with riluzole in the London and Oxford cohorts, separately or combined. In addition, there was no difference in blood NfL levels in patients with ALS stratified according to PRB between riluzole-treated and untreated patients with ALS in London and Oxford, separately and combined (data not shown).
DISCUSSION
Our data support blood NfL as a biomarker with prognostic value in ALS. In 2 independent cohorts, there was a striking similarity in assay sensitivity, specificity, and cutoff levels to distinguish patients with ALS from healthy controls, while the 2 cohorts were also in agreement regarding the correlation between disease progression rate and baseline NfL levels in patients with ALS. Both cohorts showed a steady blood NfL expression over time, and levels at recruitment predicted survival independently from other clinical covariates. The improved assay performance in blood for the analysis of clinically well-characterized cross-sectional and longitudinal cohorts of patients with ALS supports NfL as a reproducible, easily accessible surrogate marker of axonal loss. In our study, NfL bioavailability in the natural history of the disease has been truly characterized and not predicted based on a variable baseline measurement. NfL levels in CSF were the best at discriminating patients with ALS from controls and for patient stratification. This is not surprising, considering that CSF is the natural biorepository of products of neuroaxonal disintegration because of its proximity to the CNS. When the total number of ALS cases from our independent cohorts was considered, blood NfL levels also discriminated very well between ALS-fast, ALS-intermediate, and ALS-slow categories. Our findings suggest that blood NfL is now a leading candidate biomarker for improved participant stratification in future ALS therapeutic trials, with the additional potential for assessing response to therapy.
Potential biases in our investigation partly reflect the study of a rapidly disabling and life-shortening condition. The follow-up sampling was understandably more limited for the ALS-fast group, in which it was more difficult to perform repeated measurements and cohorts inevitably enriched for slower-progressing, arguably atypical patients. By using a multilevel model, the analysis included all individuals' measurements under a “missing at random” assumption.19 We limited the effects of the shorter follow-up time for fast-progressing patients by restricting analysis to the first 15 months of follow-up, although some of the cases were monitored longitudinally for up to 3 years. Also, NfL change was jointly modeled with the time to death within this 15-month period to account for any informative dropout.18,20,21 Multilevel and Cox regression analyses showed reproducible results when analyses were performed using a variable such as disease duration from either baseline or from symptom onset. To better characterize the diagnostic potency of plasma NfL in ALS, future studies should include other neurodegenerative disorders and ALS mimics as reference, while NfL measurements should be ideally undertaken closer to the time of reported disease onset, when ALS is suspected or at diagnosis.
NfL levels changed only minimally throughout most of the disease course in ALS. NfL release from affected tissues may be a prolonged downstream effect of ALS pathology but we cannot fully comment on earlier stages of the disease in light of the diagnostic latency in our cases. It is possible that rising levels of autoantibodies against NfL may have a clearing effect while aggregation may reduce NfL detection, leveling down the linear increase of NfL.22,23 Plasma levels of axonal injury biomarkers such as total tau and S100B were reported to be at their peak immediately after a concussive injury and to slowly return to preinjury levels thereafter.24 In the more prolonged process of neurodegeneration seen in patients with ALS, the progressive release and accumulation of Nfs may be counterbalanced by the clearing mechanisms reported above, resulting in a flat NfL concentration profile.
Blood NfL measurement appears to have advantage over neurofilament heavy chain (NfH).8 The “hook effect,” a potential inconsistent result due to analyte aggregation found in measuring plasma NfH,7,8 was not observed in the NfL assay.9 Furthermore, unlike the linear increase observed in animal models,25 longitudinal NfH plasma expression in patients with rapidly progressing ALS showed a steady decline as the disease advanced.8 In a clinical trial setting, a “natural” reduction of the bioavailability of a biomarker with the disease progression may pose problems with the overall interpretation of treatment response. Unlike NfH,8 blood NfL levels in ALS were significantly higher than in controls, and maintained distinct temporal profiles with a steady trajectory.
A change in a biomarker's expression might be considered as supporting evidence of disease modification in ALS as shown in arimoclomol-treated SOD1G93A mice of ALS,25 allowing for the reduction of sample size and costs in clinical trials.26 The analysis of how riluzole treatment affected baseline NfL levels in our cohorts was understandably inconclusive, suggesting only an indication bias for the London cohort. Nonetheless, using the same NfL assay employed in this study, we have recently shown a modest reduction of serum NfL concentrations at different time points following spinal cord injury in a subgroup of patients treated with minocycline.27
Both blood and CSF NfL levels were robust independent prognostic markers. Serial lumbar punctures for longitudinal NfL monitoring are far less practical than blood sampling. The observed strong correlation between CSF and blood NfL levels suggests that blood NfL is a surrogate marker for CSF NfL levels. The higher blood-CSF correlation of NfL levels we observed in patients with ALS compared with healthy controls was puzzling. A more rapid liberation of NfL protein from affected nervous tissue and a relatively higher NfL concentration in CSF from patients with ALS compared with healthy controls may determine a more efficient redistribution of NfL protein between CSF and blood through the blood-brain barrier. CSF and blood matrices may act differently on NfL homeostasis and clearance depending on its concentration.
Our data suggest that the measurement of blood NfL for disease activity monitoring, in an earlier symptomatic phase or at diagnosis, may provide further clues on the diagnostic potency of this biomarker, particularly if other neurologic disorders or ALS mimic syndromes are included as reference. In combination with biomarkers emerging from neuroimaging,28 blood NfL may improve diagnostic potency and prognostic evaluation in ALS, similar to blood markers defining the transition between mild cognitive impairment and Alzheimer disease29,30 used in combination with Pittsburgh compound B–PET.31 An improved understanding of how NfL release changes in response to pathology, in particular presymptomatically,32 or to factors that mitigate the disease pathology, will further strengthen the case for NfL in the diagnostic process as well as therapeutic trials in ALS.
Supplementary Material
ACKNOWLEDGMENT
The authors acknowledge the selfless effort made by all participants in the nontherapeutic clinical research (including the carers of the patients), for which the authors are grateful.
GLOSSARY
- ALS
amyotrophic lateral sclerosis
- CI
confidence interval
- Nf
neurofilament
- NfH
neurofilament heavy chain
- NfL
neurofilament light chain
- PRB
progression rate at baseline
- PRL
progression rate at last visit
Footnotes
Supplemental data at Neurology.org
AUTHOR CONTRIBUTIONS
C.-H.L. undertook the laboratory work, data analysis and interpretation, performed the statistical analysis, and wrote the first draft of the paper. C.M.-W. contributed to statistical analysis and data interpretation. E.G. undertook the laboratory work, data analysis, and review and amendment of the manuscript. N.P. advised on the statistical analysis and participated in interpretation of data, and review and amendment of the manuscript. N.N. contributed to assay materials and revised the manuscript. K.T., R.O., M.F., K.S., R.H., and P.F. contributed to patient enrollment and data collection, and revised the manuscript for content. G.G. participated in conceptualizing the study and revised the manuscript for content. L.G. and A.P. contributed to the conceptualization and design of the study, data interpretation, and review and amendment of the manuscript. J.K. contributed to the conceptualization and design of the study, assay analysis, interpretation of data, and review and amendment of the manuscript. A.M. and M.R.T. contributed through the conceptualization and design of the study, patient enrollment, data collection, interpretation of the data, and review and amendment of the manuscript. All authors reviewed the drafts and approved the final version of the manuscript.
STUDY FUNDING
The projects were funded by the Motor Neurone Disease Association (Malaspina/Apr13/6097), Barts, and The London Charities (468/1714). L.G. is the Graham Watts Senior Research Fellow, funded by the Brain Research Trust and the European Community's Seventh Framework Programme (FP7/2007–2013). C.M.-W. is funded by a UK Medical Research Council research fellowship (MR/J011932/1). The Oxford MND Centre (M.R.T., K.T.) receives funding from the Motor Neurone Disease Association UK. M.R.T. is funded by the Medical Research Council and Motor Neurone Disease Association Lady Edith Wolfson Fellowship (G0701923 and MR/K01014X/1), and E.G. through the PROMISES project award to M.R.T. by the Thierry Latran Foundation. J.K. is funded by an ECTRIMS Research Fellowship Programme and by the Research Funds of the University of Basel, Switzerland. R.O. receives funding from the Motor Neurone Disease Association UK.
DISCLOSURE
C. Lu reports no disclosures relevant to the manuscript. C. Macdonald-Wallis, E. Gray, and N. Pearce report no disclosures relevant to the manuscript. A. Petzold has a patent P91964EP00, issued to VU Medical Centre, the Netherlands. N. Norgren is employed by UmanDiagnostics AB, Sweden. G. Giovannoni, P. Fratta, K. Sidle, M. Fish, R. Orrell, R. Howard, K. Talbot, L. Greensmith, J. Kuhle, M. Turner, and A. Malaspina report no disclosures relevant to the manuscript. Go to Neurology.org for full disclosures.
REFERENCES
- 1.Petzold A. Neurofilament phosphoforms: surrogate markers for axonal injury, degeneration and loss. J Neurol Sci 2005;233:183–198. [DOI] [PubMed] [Google Scholar]
- 2.Brettschneider J, Petzold A, Sussmuth SD, Ludolph AC, Tumani H. Axonal damage markers in cerebrospinal fluid are increased in ALS. Neurology 2006;66:852–856. [DOI] [PubMed] [Google Scholar]
- 3.Norgren N, Rosengren L, Stigbrand T. Elevated neurofilament levels in neurological diseases. Brain Res 2003;987:25–31. [DOI] [PubMed] [Google Scholar]
- 4.Rosengren LE, Karlsson JE, Karlsson JO, Persson LI, Wikkelso C. Patients with amyotrophic lateral sclerosis and other neurodegenerative diseases have increased levels of neurofilament protein in CSF. J Neurochem 1996;67:2013–2018. [DOI] [PubMed] [Google Scholar]
- 5.Reijn TS, Abdo WF, Schelhaas HJ, Verbeek MM. CSF neurofilament protein analysis in the differential diagnosis of ALS. J Neurol 2009;256:615–619. [DOI] [PubMed] [Google Scholar]
- 6.Lehnert S, Costa J, de Carvalho M, et al. Multicentre quality control evaluation of different biomarker candidates for amyotrophic lateral sclerosis. Amyotroph Lateral Scler Frontotemporal Degener 2014;15:344–350. [DOI] [PubMed] [Google Scholar]
- 7.Lu CH, Kalmar B, Malaspina A, Greensmith L, Petzold A. A method to solubilise protein aggregates for immunoassay quantification which overcomes the neurofilament “hook” effect. J Neurosci Methods 2011;195:143–150. [DOI] [PubMed] [Google Scholar]
- 8.Lu CH, Petzold A, Topping J, et al. Plasma neurofilament heavy chain levels and disease progression in amyotrophic lateral sclerosis: insights from a longitudinal study. J Neurol Neurosurg Psychiatry Epub 2014 Jul 9. [DOI] [PMC free article] [PubMed]
- 9.Gaiottino J, Norgren N, Dobson R, et al. Increased neurofilament light chain blood levels in neurodegenerative neurological diseases. PLoS One 2013;8:e75091. [DOI] [PMC free article] [PubMed] [Google Scholar]
- 10.Tortelli R, Copetti M, Ruggieri M, et al. Cerebrospinal fluid neurofilament light chain levels: marker of progression to generalized amyotrophic lateral sclerosis. Eur J Neurol 2015;22:215–218. [DOI] [PubMed] [Google Scholar]
- 11.Tortelli R, Ruggieri M, Cortese R, et al. Elevated cerebrospinal fluid neurofilament light levels in patients with amyotrophic lateral sclerosis: a possible marker of disease severity and progression. Eur J Neurol 2012;19:1561–1567. [DOI] [PubMed] [Google Scholar]
- 12.Brooks BR, Miller RG, Swash M, Munsat TL. El Escorial revisited: revised criteria for the diagnosis of amyotrophic lateral sclerosis. Amyotroph Lateral Scler Other Motor Neuron Disord 2000;1:293–299. [DOI] [PubMed] [Google Scholar]
- 13.Petzold A, Keir G, Kay A, Kerr M, Thompson EJ. Axonal damage and outcome in subarachnoid haemorrhage. J Neurol Neurosurg Psychiatry 2006;77:753–759. [DOI] [PMC free article] [PubMed] [Google Scholar]
- 14.Petzold A, Mondria T, Kuhle J, et al. Evidence for acute neurotoxicity after chemotherapy. Ann Neurol 2010;68:806–815. [DOI] [PubMed] [Google Scholar]
- 15.Petzold A, Tisdall MM, Girbes AR, et al. In vivo monitoring of neuronal loss in traumatic brain injury: a microdialysis study. Brain 2011;134:464–483. [DOI] [PMC free article] [PubMed] [Google Scholar]
- 16.Teunissen CE, Petzold A, Bennett JL, et al. A consensus protocol for the standardization of cerebrospinal fluid collection and biobanking. Neurology 2009;73:1914–1922. [DOI] [PMC free article] [PubMed] [Google Scholar]
- 17.Leckie G, Charlton C. Runmlwin: a program to run the MLwiN multilevel modeling software from within Stata. J Stat Softw 2013;52:1–40.23761062 [Google Scholar]
- 18.Touloumi G, Pocock SJ, Babiker AG, Darbyshire JH. Estimation and comparison of rates of change in longitudinal studies with informative drop-outs. Stat Med 1999;18:1215–1233. [DOI] [PubMed] [Google Scholar]
- 19.Cnaan A, Laird NM, Slasor P. Using the general linear mixed model to analyse unbalanced repeated measures and longitudinal data. Stat Med 1997;16:2349–2380. [DOI] [PubMed] [Google Scholar]
- 20.Berry JD, Miller R, Moore DH, et al. The Combined Assessment of Function and Survival (CAFS): a new endpoint for ALS clinical trials. Amyotroph Lateral Scler Frontotemporal Degener 2013;14:162–168. [DOI] [PubMed] [Google Scholar]
- 21.Rudnicki SA, Berry JD, Ingersoll E, et al. Dexpramipexole effects on functional decline and survival in subjects with amyotrophic lateral sclerosis in a phase II study: subgroup analysis of demographic and clinical characteristics. Amyotroph Lateral Scler Frontotemporal Degener 2013;14:44–51. [DOI] [PubMed] [Google Scholar]
- 22.Fialova L, Svarcova J, Bartos A, et al. Cerebrospinal fluid and serum antibodies against neurofilaments in patients with amyotrophic lateral sclerosis. Eur J Neurol 2010;17:562–566. [DOI] [PubMed] [Google Scholar]
- 23.Puentes F, Topping J, Kuhle J, et al. Immune reactivity to neurofilament proteins in the clinical staging of amyotrophic lateral sclerosis. J Neurol Neurosurg Psychiatry 2014;85:274–278. [DOI] [PubMed] [Google Scholar]
- 24.Shahim P, Tegner Y, Wilson DH, et al. Blood biomarkers for brain injury in concussed professional ice hockey players. JAMA Neurol 2014;71:684–692. [DOI] [PubMed] [Google Scholar]
- 25.Lu CH, Petzold A, Kalmar B, Dick J, Malaspina A, Greensmith L. Plasma neurofilament heavy chain levels correlate to markers of late stage disease progression and treatment response in SOD1 G93A mice that model ALS. PLoS One 2012;7:e40998. [DOI] [PMC free article] [PubMed] [Google Scholar]
- 26.Ganesalingam J, Bowser R. The application of biomarkers in clinical trials for motor neuron disease. Biomark Med 2010;4:281–297. [DOI] [PMC free article] [PubMed] [Google Scholar]
- 27.Kuhle J, Gaiottino J, Leppert D, et al. Serum neurofilament light chain is a biomarker of human spinal cord injury severity and outcome. J Neurol Neurosurg Psychiatry 2015;86:273–279. [DOI] [PubMed] [Google Scholar]
- 28.Turner MR, Agosta F, Bede P, Govind V, Lule D, Verstraete E. Neuroimaging in amyotrophic lateral sclerosis. Biomark Med 2012;6:319–337. [DOI] [PubMed] [Google Scholar]
- 29.Hye A, Riddoch-Contreras J, Baird AL, et al. Plasma proteins predict conversion to dementia from prodromal disease. Alzheimers Dement 2014;10:799–807.e2. [DOI] [PMC free article] [PubMed] [Google Scholar]
- 30.Mousavi M, Jonsson P, Antti H, et al. Serum metabolomic biomarkers of dementia. Dement Geriatr Cogn Dis Extra 2014;4:252–262. [DOI] [PMC free article] [PubMed] [Google Scholar]
- 31.Forsberg A, Almkvist O, Engler H, Wall A, Langstrom B, Nordberg A. High PIB retention in Alzheimer's disease is an early event with complex relationship with CSF biomarkers and functional parameters. Curr Alzheimer Res 2010;7:56–66. [DOI] [PubMed] [Google Scholar]
- 32.Benatar M, Wuu J, Ravits J. Opportunity and innovation in studying pre-symptomatic amyotrophic lateral sclerosis. Muscle Nerve 2013;47:629–631. [DOI] [PubMed] [Google Scholar]
Associated Data
This section collects any data citations, data availability statements, or supplementary materials included in this article.