BSS1 forms a complex with a master regulator of brassinosteroid signaling, thereby restricting the regulator to the cytosol and negatively regulating brassinosteroid signaling.
Abstract
Brassinosteroids (BRs) play important roles in plant development and the response to environmental cues. BIL1/BZR1 is a master transcription factor in BR signaling, but the mechanisms that lead to the finely tuned targeting of BIL1/BZR1 by BRs are unknown. Here, we identified BRZ-SENSITIVE-SHORT HYPOCOTYL1 (BSS1) as a negative regulator of BR signaling in a chemical-biological analysis involving brassinazole (Brz), a specific BR biosynthesis inhibitor. The bss1-1D mutant, which overexpresses BSS1, exhibited a Brz-hypersensitive phenotype in hypocotyl elongation. BSS1 encodes a BTB-POZ domain protein with ankyrin repeats, known as BLADE ON PETIOLE1 (BOP1), which is an important regulator of leaf morphogenesis. The bss1-1D mutant exhibited an increased accumulation of phosphorylated BIL1/BZR1 and a negative regulation of BR-responsive genes. The number of fluorescent BSS1/BOP1-GFP puncta increased in response to Brz treatment, and the puncta were diffused by BR treatment in the root and hypocotyl. We show that BSS1/BOP1 directly interacts with BIL1/BZR1 or BES1. The large protein complex formed between BSS1/BOP1 and BIL1/BZR1 was only detected in the cytosol. The nuclear BIL1/BZR1 increased in the BSS1/BOP1-deficient background and decreased in the BSS1/BOP1-overexpressing background. Our study suggests that the BSS1/BOP1 protein complex inhibits the transport of BIL1/BZR1 to the nucleus from the cytosol and negatively regulates BR signaling.
INTRODUCTION
The plant steroid hormones known as brassinosteroids (BRs) play important roles in plant development processes such as cell elongation, cell division, xylem development, and photomorphogenesis. BRs are recognized by the BR receptor BRI1, a Ser/Thr kinase with a leucine-rich repeat domain that resides on the plasma and endosomal membranes (Kinoshita et al., 2005; Hothorn et al., 2011).
Brassinazole (Brz) is a specific BR biosynthesis inhibitor that directly binds to the cytochrome P450 steroid C-22 hydroxylase encoded by the DWARF4 (DWF4) gene (Asami et al., 2000, 2001). Our chemical genetic screen using Brz led to the identification of Brz-insensitive-long hypocotyl1-1D (bil1-1D), which has the same mutation as brassinazole-resistance1-1D (bzr1-1D) (Wang et al., 2002; Asami et al., 2003). BIL1/BZR1 has a homologous gene called BES1. BIL1/BZR1 and BES1 are basic/helix-loop-helix transcription factors. BR regulates the expression of an estimated 5000 genes, approximately half of which are induced and half of which are repressed (Gudesblat and Russinova, 2011; Wang et al., 2012). Chromatin immunoprecipitation-microarray analysis revealed that BIL1/BZR1 specifically binds to the BR-responsive promoter regions of 3410 target genes and that BES1 binds to 1609 target genes (He et al., 2005; Yin et al., 2005, Sun et al., 2010). These results suggested that BIL1/BZR1 and BES1 might be master transcription factors in BR signaling.
In BIL1/BZR1 and BES1, two unique properties were identified. One property is protein stability regulation based on the phosphorylation state. BR treatment induces the dephosphorylation of BIL1/BZR1 and BES1, which decreases the protein molecular mass by ∼10 kD, stabilizing the proteins (Wang et al., 2002; Yin et al., 2005). The phosphorylation of BIL1/BZR1 and BES1 by BIN2 kinase, which is a negative kinase that suppresses BR-related signaling, reduces their protein levels (He et al., 2002; Yin et al., 2005). The other property of BIL1/BZR1 is protein dynamics in cellular localization. BR treatment stimulates the import of BIL1/BZR1 into the nucleus from the cytosol and increases the protein level in the nucleus (Wang et al., 2002). The phosphorylation of BIL1/BZR1 and BES1 is also facilitated by the plant 14-3-3 protein family (Gampala et al., 2007). Because neither a 14-3-3 knockout mutant nor an RNA interference transformant exhibits a BR-related phenotype or response, the regulatory mechanisms of BIL1/BZR1 and BES1 in the cytosol and nuclei remain unknown.
We identified BRZ-SENSITIVE-SHORT HYPOCOTYL1 (BSS1) as a negative regulator of BR signaling via chemical-biological analysis. BSS1 forms a protein complex that is facilitated by Brz and dissolved by BR treatment. The possible role of the BSS1 protein complex for the import of BIL1/BZR from cytosol to nucleus is analyzed and discussed.
RESULTS
The bss1-1D Mutant Is Hypersensitive to BR-Deficient Conditions
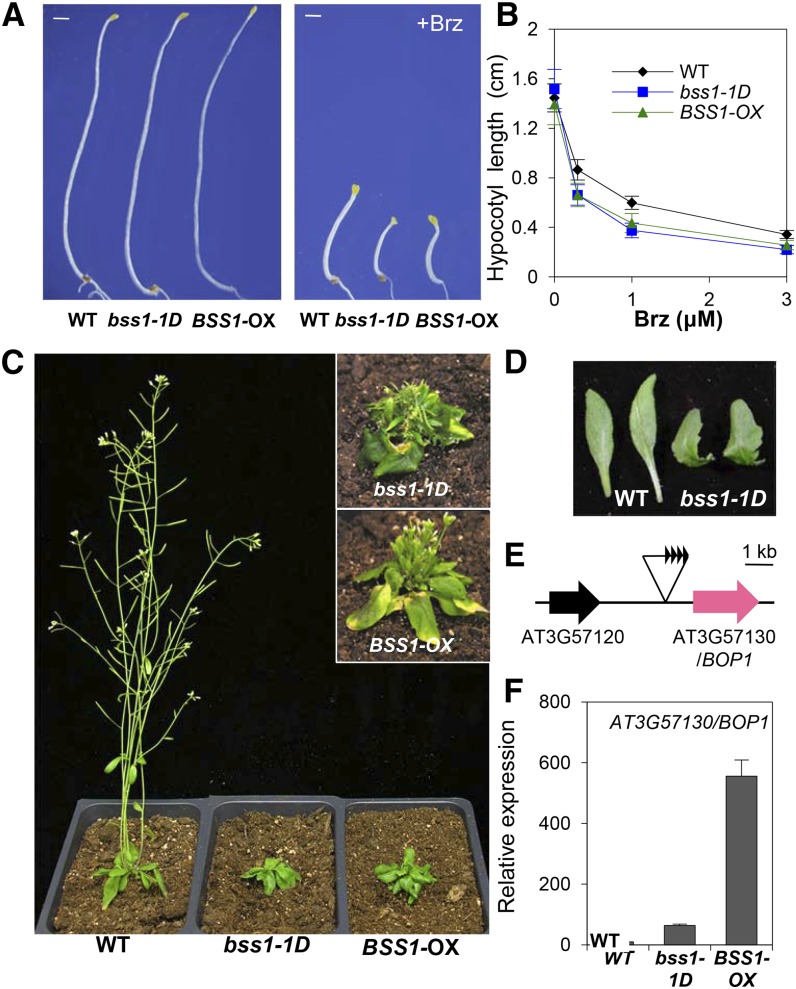
To search for novel factors involved in BR signaling, we screened ∼10,000 Arabidopsis thaliana activation-tagged lines (Nakazawa et al., 2003) using Brz. We isolated a Brz-hypersensitive mutant, Brz-sensitive-short hypocotyl1-1D (bss1-1D). The bss1-1D mutant had a shorter hypocotyl than the wild-type plant when grown in the dark on medium with Brz, although bss1-1D showed a normally elongated hypocotyl in the absence of Brz (Figures 1A and 1B; Supplemental Figures 1D and 1E). Light-grown bss1-1D mutants presented phenotypes similar to those of the BR biosynthesis- and signaling-defective mutants det2, bri1, and bin2 (Figures 1C and 1D; Supplemental Figures 1A to 1C). These phenotypes of bss1-1D suggest that BR signal transduction is suppressed in bss1-1D mutants.
Figure 1.
The bss1-1D Mutant Showed a Brz-Hypersensitive Phenotype.
(A) Dark-grown phenotypes of wild-type, bss1-1D, and BSS1/BOP1-OX plants on medium containing DMSO or 3 μM Brz for 7 d. Bars = 1 mm.
(B) Hypocotyl lengths of the wild type, bss1-1D, and BSS1/BOP1-OX on medium containing different concentrations of Brz in the dark for 7 d. The results are presented as means ± sd (n > 30).
(C) Phenotypes of bss1-1D and BSS1/BOP1-OX plants in soil under long-day conditions for 30 d. The insets at right show the phenotypes after 40 d.
(D) Leaf morphology of wild-type and bss1-1D plants.
(E) Diagram of the genomic region flanking the T-DNA insertion site in bss1-1D.
(F) qRT-PCR analysis of the expression levels of BSS1/BOP1 (At3g57130) in light-grown wild-type, bss1-1D, and BSS1-OX lines shown in (C). The results are presented as means ± sd from four independent experiments. For all qRT-PCR analyses, ACT2 was used as the internal control.
To identify the bss1-1D mutation, we analyzed the cosegregation of the Brz-sensitive-short hypocotyl phenotype and found a T-DNA insertion site at the end of chromosome III. The expression of the At3g57130 gene, which is located ∼1 kb upstream of the T-DNA insertion, was significantly increased in the bss1-1D mutant compared with that of the wild type, as determined by quantitative real time-PCR (qRT-PCR) (Figures 1E and 1F). To confirm that the overexpression of this gene caused the bss1-1D phenotype, we generated plants overexpressing At3g57130 (Figure 1F). The BSS1-overexpressing plant (BSS1-OX) exhibited short hypocotyls when grown in the dark on medium containing Brz and a dwarf phenotype when grown in the light, similar to bss1-1D (Figures 1A to 1D). Therefore, we identified At3g57130 as BSS1.
BSS1 encodes a BTB-POZ domain protein with ankyrin repeats known as BLADE ON PETIOLE1 (BOP1), which plays an important role in regulating leaf morphogenesis, leaf patterning, and floral abscission (Ha et al., 2003, 2007; Hepworth et al., 2005; Norberg et al., 2005; McKim et al., 2008; Jun et al., 2010; Xu et al., 2010). BOP1 belongs to a family of proteins that includes the plant defense response regulator NPR1 (Cao et al., 1997; Zhang et al., 1999; Després et al., 2003) (Supplemental Figures 2A and 2B and Supplemental Data Set 1). Although the functions of BOP1 in leaf phenotype and boundary zone regulation have been analyzed, its functions in hypocotyl elongation and plant hormone signaling have not been clarified.
BSS1/BOP1 Is a Negative Regulator of BR Signaling
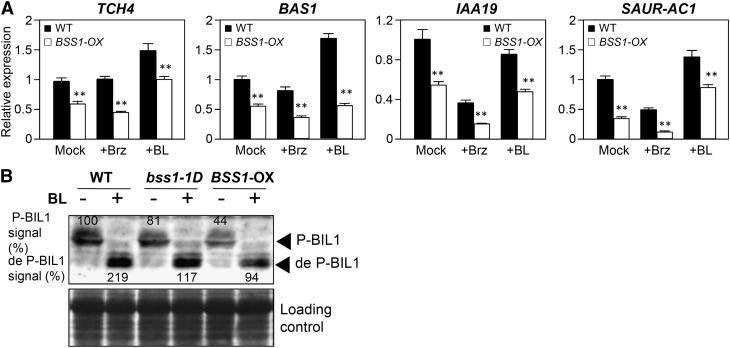
To determine whether the BR-deficient phenotype was due to the inhibition of BR signaling, we analyzed the expression of BR-responsive genes by qRT-PCR. The expression of TCH4, BAS1, IAA19, and SAUR-AC1 was increased by the active BR brassinolide (BL) and suppressed by Brz in wild-type plants. In BSS1/BOP1-OX, the expression of TCH4, BAS1, IAA19, and SAUR-AC1 was comparatively reduced under control conditions compared with that of the wild-type plant. The suppression ratio of gene expression in BSS1/BOP1-OX was enhanced in the presence of Brz (Figure 2A). We analyzed the phosphorylation status of a downstream biochemical marker, BIL1/BZR1, which is highly phosphorylated under low-BR conditions and dephosphorylated by BR treatment (He et al., 2002, 2005; Wang et al., 2002). The amounts of phosphorylated and dephosphorylated BIL1/BZR1 decreased in bss1-1D and BSS1/BOP1-OX plants, respectively, compared with the levels in wild-type plants (Figure 2B). These results indicate that BR signaling in bss1-1D and BSS1/BOP1-OX is suppressed upstream of BIL1/BZR1.
Figure 2.
BSS1/BOP1 Negatively Regulates BR Signaling.
(A) Brz and BL responsiveness of BR-regulated genes in BSS1/BOP1-OX. The expression levels of TCH4, BAS1, IAA19, and SAUR-AC1 were analyzed by qRT-PCR in 7-d-old dark-germinated seedlings and treated with medium containing DMSO (Mock), 3 μM Brz (+Brz), or 100 nM BL (+BL) for 3 h. The data represent means ± sd of four independent replications. **P < 0.01, Student’s t test.
(B) Immunoblot analysis of BIL1/BZR1 phosphorylation. Ten-day-old seedlings grown on medium with Brz were treated with 100 nM BL or mock solution for 3 h. Total proteins were extracted and analyzed by immunoblotting with an anti-BIL1/BZR1 antibody. P-BIL1 is phosphorylated BIL1/BZR1 and de P-BIL1 is dephosphorylated BIL1/BZR1. The top panel shows an immunoblot of BIL1/BZR1 protein extracted from wild-type and BSS1/BOP1-OX plants. The signal intensities of phosphorylated BIL1/BZR1 and dephosphorylated BIL1/BZR1 are shown by the top and bottom arrowheads, and each band signal is counted as a percentage relative to the level of phosphorylated BIL1/BZR1 in wild-type seedlings. The bottom panel shows a Ponceau S-stained gel.
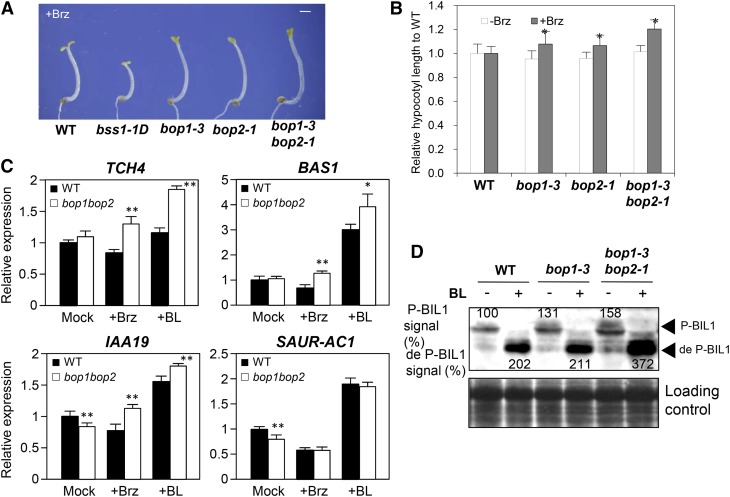
Single and double T-DNA insertion mutants in the promoter region, bop1-3, bop2-1, and bop1-3 bop2-1 (Hepworth et al., 2005), exhibited modestly but significantly (P < 0.05) longer hypocotyls than those of the wild type when grown in the dark on medium with Brz (Figures 3A and 3B). In the bop1-3 bop2-1 mutant, the expression of TCH4, BAS1, and IAA19 was comparatively enhanced in the presence of BL compared with that of the wild-type plant (Figure 3C). Immunoblot analysis indicated that the amounts of phosphorylated and dephosphorylated BIL1/BZR1 increased in bop1-3 and bop1-3 bop2-1 plants, respectively, compared with wild-type plants (Figure 3D). These results suggest that the loss of BSS1/BOP1 activates BR signaling. As shown in Figures 2B and 3D, the BSS1/BOP1 protein might have a negative role in maintaining the stability of BIL1/BZR1.
Figure 3.
BSS1/BOP1-Deficient Mutants Showed Brz Resistance and Positive Regulation for BR Signaling.
(A) Dark-grown phenotypes of wild-type, bss1-1D, and BSS1/BOP1-deficient mutant plants on medium containing DMSO or 3 μM Brz for 7 d. Bar = 1 mm.
(B) Relative hypocotyl lengths of bop1-3, bop2-1, and bop1-3 bop2-1 compared with the wild type on medium containing DMSO or 3 μM Brz after growth in the dark for 7 d. The results are presented as means ± sd (n = 34). *P < 0.05, Student’s t test.
(C) Brz and BL responsiveness of BR-regulated genes in bop1-3 bop2-1. The expression levels of TCH4, BAS1, IAA19, and SAUR-AC1 were analyzed by qRT-PCR in 9-d-old light-germinated seedlings and treated with medium containing DMSO, 3 μM Brz, or 100 nM BL for 3 h. The data represent means ± sd of four independent replications. **P < 0.01, *P < 0.05, Student’s t test.
(D) Immunoblot analysis of BIL1/BZR1 phosphorylation status of the wild type, bop1-3, and bop1-3 bop2-1. The experiment was performed as described in Figure 2B. The signal intensities of phosphorylated BIL1/BZR1 and dephosphorylated BIL1/BZR1 are shown above and below each band (arrowheads) and are presented as percentages relative to the level of phosphorylated BIL1/BZR1 in wild-type seedlings. The bottom panel shows a Ponceau S-stained gel.
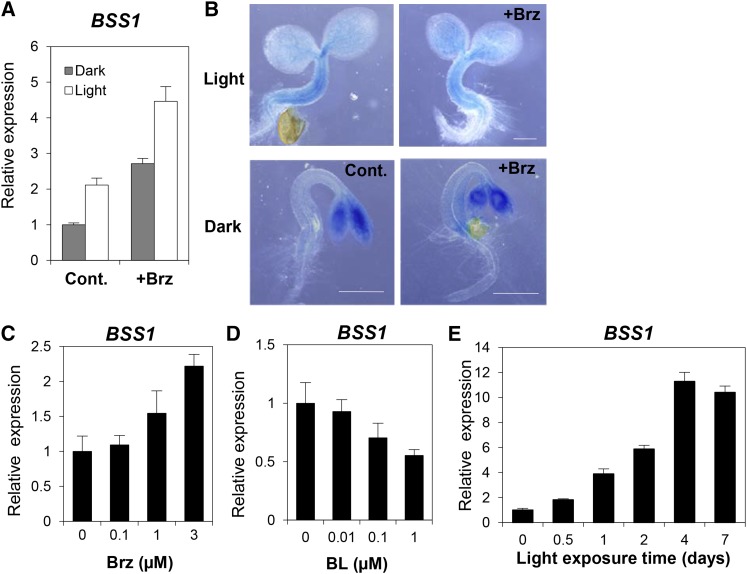
Previous studies reported that BOP1 is expressed in lateral organ boundaries that are formed during embryonic, vegetative, and reproductive development (Ha et al., 2004; Hepworth et al., 2005; Norberg et al., 2005; McKim et al., 2008; Xu et al., 2010; Khan et al., 2012). To explore the additional functions of BSS1/BOP1, we examined the BR-regulated expression of BSS1/BOP1 in more detail. A qRT-PCR analysis indicated that BSS1/BOP1 expression increased in response to the dose-dependent addition of Brz during early germination (Figures 4A and 4C). By contrast, BSS1/BOP1 expression decreased in response to BL (Figure 4D). The analysis of transgenic plants with the BSS1/BOP1 promoter region that was fused to the β-glucuronidase gene (BSS1/BOP1 pro:GUS) exhibited strong expression in the hypocotyls of light-grown seedlings but not in those of dark-grown seedlings. Brz caused BSS1/BOP1 expression in the hypocotyls in the dark and in the cotyledons under light and dark conditions (Figure 4B). BSS1/BOP1 expression was induced by the deficiency of BR with Brz treatment and was suppressed by light and in seedlings (Figure 4E). These results suggest that BSS1/BOP1 regulates the optimum length of hypocotyl elongation via the negative regulation of BR signaling during early germination. BSS1/BOP1 plays important roles not only in leaf morphogenesis but also in hypocotyl growth through BR signaling.
Figure 4.
BSS1/BOP1 mRNA Expression Is Induced by Brz and Light.
(A) qRT-PCR analysis of the expression levels of BSS1/BOP1 in wild-type seedlings grown on medium without (Cont.) or with 3 μM Brz (+Brz) in the dark or light for 7 d. The data represent means ± sd from four independent replications.
(B) GUS reporter gene expression in transgenic plants expressing BSS1/BOP1 pro:GUS. The samples were grown in the same conditions as in (A) for 3 d. Bars = 5 mm.
(C) to (E) The BSS1/BOP1 expression level was calculated by qRT-PCR. Wild-type seedlings grown on medium with different concentrations of Brz (C) and BL (D) in the light for 7 d were used. Dark-grown seedlings exposed to light for 0 to 7 d were used in (E). The data represent means ± sd of four independent replications.
BSS1/BOP1 Forms Punctate Protein Complexes under BR-Deficient Conditions That Diffuse with BR Treatment
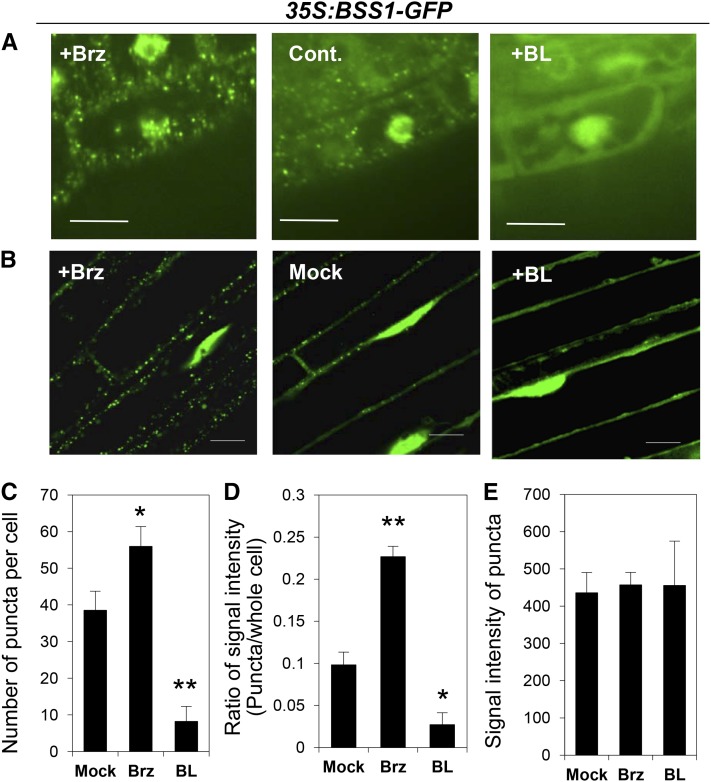
To obtain further insight into the role of BSS1/BOP1, we investigated the subcellular localization of BSS1/BOP1. In the cauliflower mosaic virus (CaMV) 35S:BSS1-GFP transformant, which had a shorter hypocotyl under Brz conditions and a shorter inflorescence compared with that of the wild-type plant, BSS1/BOP1-GFP localized to both the nucleus and cytoplasm, as described in previous reports on BOP1-GFP (Hepworth et al., 2005; Jun et al., 2010). We also found many punctate BSS1/BOP1-GFP signals with diffuse signal mainly in the cytosol (Figure 5A). Interestingly, in seedlings grown on medium containing Brz, the punctate BSS1/BOP1-GFP increased in number and the diffused BSS1/BOP1-GFP signal in the cytosol was reduced compared with that under the control conditions. By contrast, on medium with BL, the punctate BSS1/BOP1-GFP decreased in number and diffused in the cytosol. Such responsiveness of punctate BSS1/BOP1-GFP to BR and Brz began 15 min after treatment (Supplemental Figure 3A) and was observed in both roots (Figure 5A) and hypocotyl (Figure 5B). The signal intensity of BSS1/BOP1-GFP was measured in the cytosol and nucleus by tracing the nucleus and the cytosol (Supplemental Figures 3B and 3C). Treatment with Brz increased the number of intense puncta and decreased the cytosolic fluorescence signal compared with those of the mock treatment. Treatment with BL decreased the number of intense puncta (Figure 5C; Supplemental Figure 3C). An increased number of puncta caused an increase in the total fluorescence intensity of the puncta per cell (Figure 5D), but the single fluorescence intensity of each punctum was not different between the Brz and BL treatment conditions (Figure 5E; Supplemental Figure 3C). These results suggest that the formation of punctate BSS1/BOP1 is caused by Brz and that its dissociation is caused by BR.
Figure 5.
Brz Especially Increased BSS1/BOP1-GFP Punctate Structures in the Cytoplasm.
(A) BSS1/BOP1-GFP in root cells of 10-d-old seedlings grown on medium with 3 μM Brz (left) or 100 nM BL (right). Cont., mock-treated control. Bars = 10 μm.
(B) BSS1/BOP1-GFP in hypocotyl cells of 4-d-old seedlings grown in the dark were treated with 3 μM Brz (+Brz), the same amount of DMSO as mock treatment (Mock), or 100 μM BL (+BL) for 1 h. Bars = 20 μm.
(C) to (E) Analysis of BSS1/BOP1-GFP puncta signal intensities upon treatment with Brz and BL (images shown in Supplemental Figure 3B). Seven-day-old BSS1/BIL1-GFP transgenic seedlings were treated for 3 h with 3 μM Brz (Brz), an equal volume of DMSO (Mock), or 100 μM BL (BL). The graphs show the number of puncta per cell (C), the ratio of puncta signal intensity compared with the whole-cell intensity (D) (n = 9), and the signal intensity of puncta (E) (n = 73). The results are represented as means ± se. The signal intensity was measured using ImageJ software (http://rsb.info.nih.gov/ij/). *P < 0.05, **P < 0.01, Student’s t test.
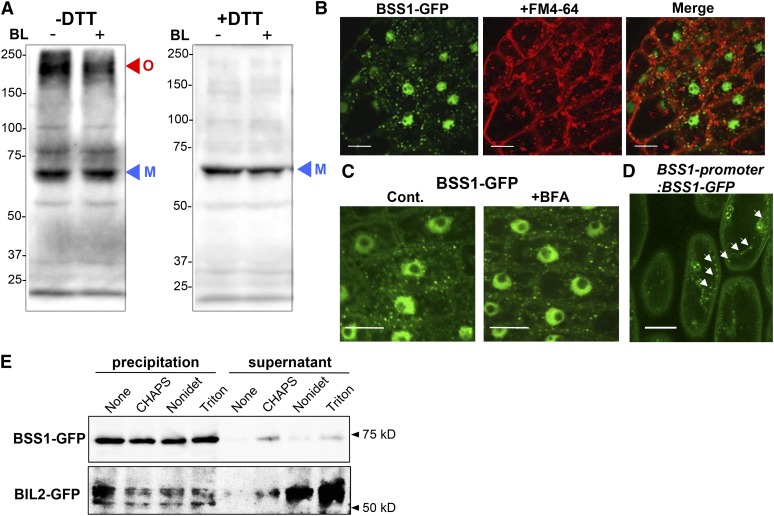
FM4-64 stains cellular membranes and endocytic structures, which are observed as punctate structures (Vida and Emr, 1995; Ueda et al., 2004). Brefeldin A (BFA) inhibits early endosomes and the Golgi apparatus, which appear as punctate cytosolic organelles (Nebenführ et al., 2002). To determine whether the punctate BSS1/BOP1-GFP fluorescence signals were from these cellular organelles or a protein complex, we analyzed the BSS1/BOP1-GFP signal after treatment with FM4-64 (Figure 6B) and BFA (Figure 6C). The punctate BSS1/BOP1 did not merge with FM4-64, and their formation was not inhibited by BFA. These results suggest that the puncta were neither endosomes nor the Golgi apparatus. Furthermore, punctate BSS1/BOP1 could be observed in both the CaMV 35S promoter:BSS1/BOP1-GFP transformant and the BSS1/BOP1 promoter:BSS1/BOP1-GFP transformant (Figure 6D). These analyses showed that BSS1/BOP1 naturally formed puncta.
Figure 6.
Punctate Structures of BSS1/BOP1 Are a Protein Complex in the Cytoplasm.
(A) Nonreduced (−DTT) and reduced (+DTT) protein from the plant leaf was analyzed by immunoblotting using an anti-GFP antibody in transgenic plants grown on medium with Brz for 10 d. Oligomeric (O; red arrowhead) and monomeric (M; blue arrowhead) BSS1/BOP1-GFP are shown. BL induced a reduction in the amount of oligomeric and total BSS1.
(B) Root cells of BSS1/BOP1-GFP transgenic plants stained with 4 μM FM4-64 for 30 min. Bars = 10 μm.
(C) Root cells of BSS1/BOP1-GFP transgenic plants treated with 50 μM BFA for 1 h. Bars = 10 μm.
(D) Hypocotyl cells of BSS1/BOP1-promoter:BSS1/BOP1-GFP transgenic plants grown for 4 d on medium with 3 μM Brz. White arrows show BBS1/BOP1-GFP puncta. Bar = 10 μm
(E) Effects of ultracentrifugation and detergent treatment on BSS1 oligomers. Total lysates were prepared from the transgenic plants and ultracentrifuged to separate the insoluble (precipitation) and soluble (supernatant) fractions. The insoluble fractions were then treated with the indicated detergents and subjected to further ultracentrifugation. The resulting supernatants and pellets were analyzed by immunoblotting. As a control, the indicated detergent-treated BIL2-GFP (protein localized to the mitochondria) samples were centrifuged as above.
Peroxisomes, mitochondria, endoplasmic reticulum bodies, and certain types of late endosomes are observed as punctate structures in the cytosol that are not sensitive to BFA, and most of these structures are not labeled by FM4-62. Therefore, further biochemical analyses of the punctate structures observed with BSS1-GFP were deemed necessary. To determine whether punctate BSS1/BOP1 is formed by a protein oligomer, we performed a nonreducing immunoblot analysis. Under nonreducing conditions (without DTT), two bands representing the monomeric BSS1/BOP1-GFP fusion protein (molecular weight 78,000) and a much higher molecular weight protein were detected (Figure 6A, red arrowhead). The higher molecular weight protein signal was lost under reducing conditions with DTT, whereas that of the monomeric BSS1/BOP1 remained (Figure 6A, blue arrowhead). Although BOP1 forms a homodimer (Jun et al., 2010), the high molecular weight signal that we detected was an oligomer of BSS1/BOP1. After BL treatment, the amount of the oligomeric form of BSS1/BOP1-GFP decreased significantly. These results were similar to those observed with oligomers of NPR1, which is a homolog of BSS1 (Supplemental Figure 2). NPR1 appears as a high molecular weight species under nonreducing conditions (i.e., without DTT) and as a low molecular weight species under reducing conditions. Based on these analyses, NPR1 was shown to form an oligomeric protein complex (Mou et al., 2003).
Further biochemical analyses were performed to enable a more detailed characterization of punctate BSS1 structures. Given that large protein complexes and cellular organelles can be precipitated by ultracentrifugation (Yanagawa et al., 1999; Hagiwara et al., 2003; Nishikiori et al., 2006), we performed ultracentrifugation experiments using protein extracts from BSS1-GFP transformants and mitochondrial protein BIL2-GFP transformants (Bekh-Ochir et al., 2013), which both present punctate GFP fluorescence signals in the cytosol. Pellets from the first ultracentrifugation were treated with the detergent CHAPS, Nonidet P-40, or Triton X-100. These detergent treatments solubilize organelle membranes but not protein complexes (Kinoshita et al., 2005; Nishikiori et al., 2006). After a second ultracentrifugation with the detergent-treated fractions, the BIL2-GFP signals were stronger in the pellet and weaker in the supernatant compared with buffer-treated (no-detergent) control fractions. Nevertheless, the BSS1-GFP signals were similarly strong in the pellets after treatment both with and without detergent. The BSS1-GFP signals were very weak in all of the supernatant fractions and were not increased by detergent treatment (Figure 6E; Supplemental Figure 4). These results suggested that the punctate fluorescence signals observed in BSS1-GFP transformants were indicative of protein complexes and were not the result of monomeric proteins being packaged inside organelle membranes, as detected in the BIL2-GFP transformants. The BSS1/BOP1 puncta are linked by disulfide bonds between each BSS1/BOP1 unit, and this complex is dissolved by BL and assembled by Brz.
The BSS1/BOP1 Protein Complex Inhibits the Transport of BIL1/BZR1 to the Nucleus from the Cytosol
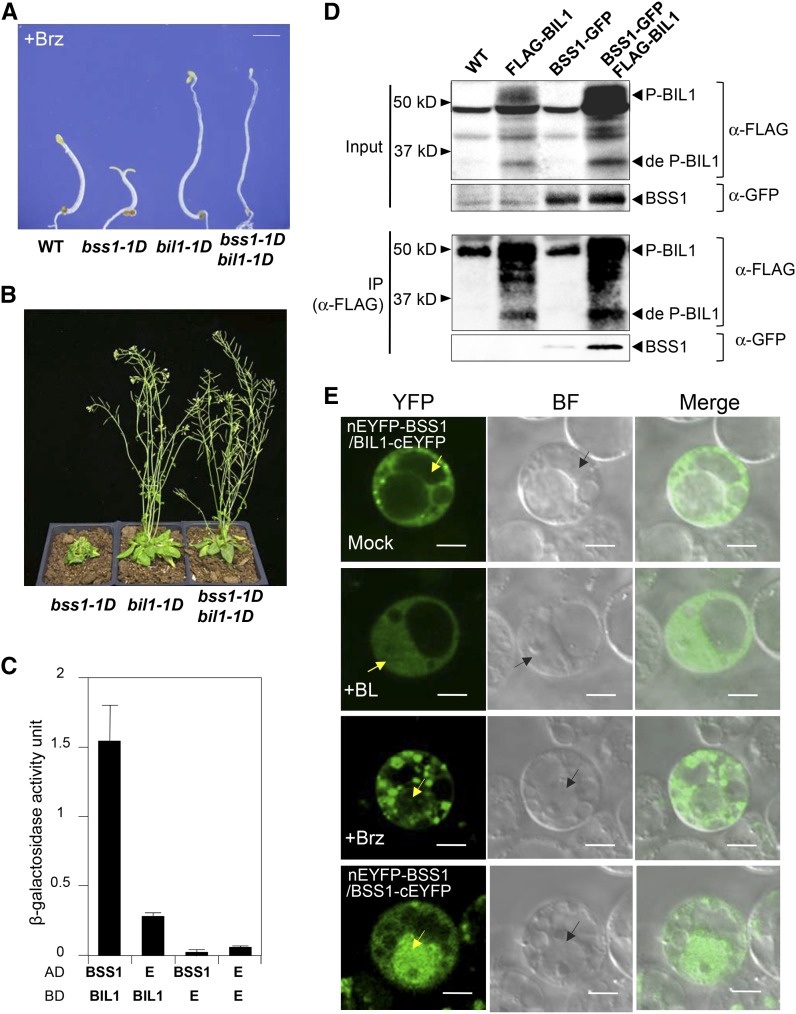
To investigate the possible function of the punctate BSS1/BOP1 in BR signaling, we first analyzed the genetic interaction between bil1-1D and bss1-1D. bss1-1D and bil1-1D double mutants presented similar phenotypes to that of bil1-1D (Figures 7A and 7B). These results indicated that bil1-1D is epistatic to bss1-1D and that BIL1/BZR1 acts downstream of BSS1/BOP1.
Figure 7.
BSS1/BOP1 Interacts with BIL1/BZR1 and Inhibits BIL1/BZR1 Transport to the Nucleus from the Cytosol.
(A) Phenotypes of the wild type, bss1-1D, bil1-1D, and the bss1-1D bil1-1D double mutant grown on medium containing 3 μM Brz in the dark for 7 d. Bar = 1 mm.
(B) Phenotypes of bss1-1D, bil1-1D, and the bss1-1D bil1-1D double mutant grown in soil in long-day conditions for 40 d.
(C) Yeast two-hybrid assay between BSS1/BOP1 and BIL1/BZR1 based on measuring β-galactosidase activity. BIL1/BZR1 was fused with the binding domain (BD) and BSS1/BOP1 was fused with the prey domain (AD). Empty vector (E) was used as a control. The results are presented as means ± sd from three independent replications.
(D) Coimmunoprecipitation (IP) of BSS1/BOP1 and BIL1/BZR1. Col-0, FLAG-BIL1, BSS1-GFP, and BSS1-GFP FLAG-BIL1 seedlings were grown on plates under light for 23 d. FLAG-BIL1 was immunoprecipitated using an anti-FLAG antibody and immunoblotted using anti-GFP and anti-FLAG antibodies
(E) BiFC analysis of the interaction between BSS1/BOP1 (nEYFP-BSS1) and BIL1/BZR1 (BIL1-cEYFP) in Arabidopsis protoplast cells. The protoplast medium contained DMSO, 100 nM BL, or 3 μM Brz, and cells were cultured for 12 h. The bottom panels show protoplasts cotransformed with nYFP-BSS1 and BSS1-cEYFP. YFP, YFP fluorescence; BF, bright field; Merge, merged image of YFP and BF. Arrows point to the nucleus. Bars = 5 μm.
To detect a direct interaction between BSS1/BOP1 and BIL1/BZR1, we performed a yeast two-hybrid assay (Figure 7C). The cDNA of BIL1/BZR1 was cloned into the pDEST32 binding domain vector (BD). The cDNA of BSS1/BOP1 was cloned into the pDEST22 prey vector (AD). In the yeast transformed by pBD-BIL1/BSS1 and pAD-BSS1/BOP1, higher β-galactosidase activity was detected compared with that of the yeast with only one vector. These results suggest that BSS1/BOP1 and BIL1/BZR1 can interact directly with each other biochemically.
The BIL1/BZR1-FLAG protein was immunoprecipitated by anti-FLAG antibodies in transgenic Arabidopsis plants expressing both BSS1/BOP1-GFP and BIL1/BZR1-FLAG, and the resulting immunoprecipitates were analyzed by immunoblot analysis with anti-FLAG and anti-GFP antibodies. The anti-FLAG antibody immunoprecipitated BIL1/BZR1-FLAG and coimmunoprecipitated BSS1/BOP1-GFP, whereas no BSS1/BOP1-GFP signal was detected using the immunoprecipitates of the transformants expressing BSS1/BOP1-GFP alone or wild-type Arabidopsis (Figure 7D). Both phosphorylated and dephosphorylated BIL1/BZR1-FLAG were detected by immunoblotting, and the ratio of dephosphorylated to phosphorylated BIL1/BZR1-FLAG in the input fraction was not altered after immunoprecipitation (Figure 7D). The results of these experiments strongly suggest that BSS1/BOP1 interacts with BIL1/BZR1 in plants.
To analyze the direct interaction between BSS1/BOP1 and BIL1/BZR1 in the plant cell and to identify the localization of the possible interaction between the two proteins, a bimolecular fluorescence complementation (BiFC) analysis was performed. Arabidopsis protoplast cells were cotransformed with nEYFP-BSS1 and/or BIL1-cEYFP constructs. The protoplast cells were treated with medium containing DMSO, 100 nM BL, or 3 μM Brz for 12 h. The yellow fluorescent protein (YFP) fluorescence signal caused by the binding of nYFP-BSS1/BOP1 and BIL1/BZR1-cYFP was only observed in the cytosol and not in the nucleus of the Arabidopsis protoplasts (Figure 7E). The punctate YFP signal increased with Brz treatment. Interestingly, these puncta caused by Brz were only detected in the cytosol and not in the nucleus (Figure 7E). These results suggest that the complex of BSS1/BOP1 remained in the cytosol, and the BSS1/BOP1 protein complex restricted BIL1/BZR1 to the cytosol. After BL treatment, the YFP signal resulting from the interaction between nYFP-BSS1/BOP1 and BIL1/BZR1-cYFP was diffuse and spread throughout the cytosol and the nucleus (Figure 7E). The diffuse BSS1/BOP1 only dimerized with BIL1/BZR1. The diffuse BSS1/BOP1 did not restrict BIL1/BZR1 to the cytosol, and BIL1/BZR1 could be imported into the nucleus under BL-treated conditions.
A YFP signal caused by the oligomerization of BSS1/BOP1 with nYFP-BSS1/BOP1 and BSS1/BOP1-cYFP was observed in the cytosol, and in some cases these signals could be detected as puncta in the nucleus (Figure 7E). These results suggest that the fluorescence signal from BSS1/BOP1-GFP in the nucleus after Brz treatment (Figure 5A) is caused by BSS1/BOP1 itself and not by the BSS1/BOP1-BIL1/BZR1 complex.
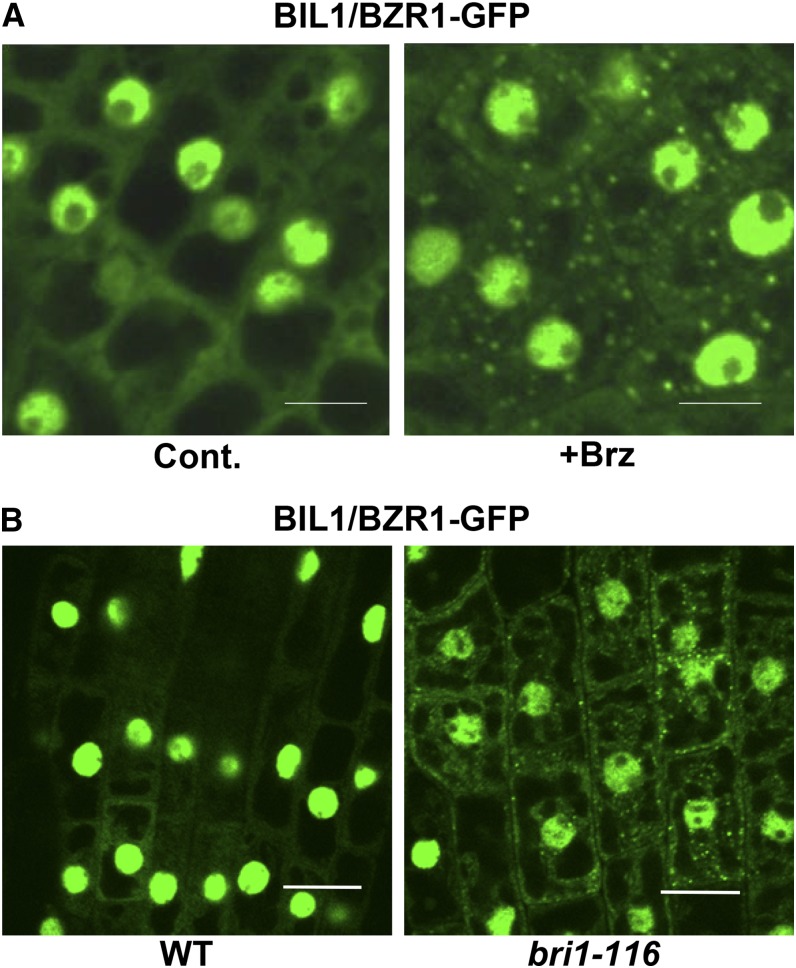
BIL1/BZR1-CFP was reported to localize to both the cytosol and nucleus in its diffuse form (Ryu et al., 2007). However, we detected many punctate BIL1/BZR1-GFP signals in the cytosol after Brz treatment (Figure 8A) and in the bri1-116 mutant background (Figure 8B). These results suggest that BSS1/BOP1 and BIL1/BZR1 naturally form puncta in the cytosol under BR-deficient conditions.
Figure 8.
BIL1/BZR1-GFP Was Observed as Puncta in the BR-Deficient State.
(A) BIL1/BZR1-GFP in root cells of 4-d-old seedlings grown on medium with 3 μM Brz (+Brz) or DMSO (Cont.). Bars = 10 μm.
(B) BIL1/BZR1-GFP in root cells of 4-d-old seedlings in the wild-type or bri1-116 background grown in the dark. Bars = 10 μm.
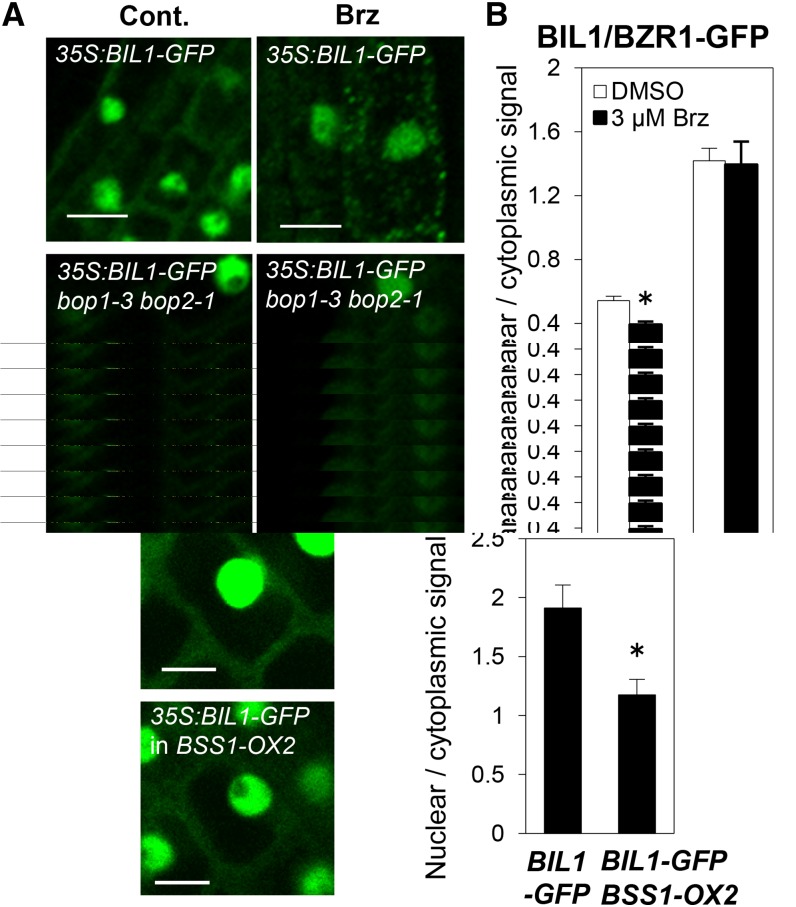
To analyze the effect of BSS1/BOP1 on the import of BIL1/BZR1 from the cytosol to the nucleus, the nuclear localization of BIL1/BZR1 under BSS1/BOP1-deficient and overexpression conditions was observed and measured. The nuclear-to-cytosolic ratio of the BIL1/BZR1-GFP signal was higher in the bop1-3 bop2-1 background than in the wild-type background. The fluorescence ratio decreased in the wild-type background upon treatment with Brz, but the enhanced nuclear BIL1/BZR1-GFP signal in the bop1-3 bop2-1 background was strongly maintained under Brz conditions. Punctate BIL1/BZR1-GFP signals were observed after Brz treatment in the wild-type background but were not detected in bop1-3 bop2-1 plants treated with Brz. These results suggested that BSS1/BOP1 deficiency promotes resistance to Brz in the regulation of BIL1/BZR1-GFP localization and puncta formation (Figures 9A and 9B). By contrast, the BIL1/BZR1-GFP signal in the nucleus was weaker in the BSS1/BOP1-overexpression transformant background than in the wild-type background (Figures 9C and 9D).
Figure 9.
BSS1/BOP1 Inhibited the Transport of BIL1/BZR1 from the Cytosol to Nuclei.
(A) Images of BIL1/BZR1-GFP in root cells of 4-d-old wild-type or bop1-3 bop2-1 seedlings grown on medium containing DMSO (Cont.) or 3 μM Brz (Brz). Bars = 10 μm.
(B) Graph showing the ratio of the nuclear-to-cytosolic signal intensity in root cells of 4-d-old seedlings. The results are presented as means ± se (n = 61). *P < 0.01, Student’s t test.
(C) Images of BIL1/BZR1-GFP in root cells of 4-d-old seedlings grown on medium in the wild-type or BSS1-OX2 background after treatment with 3 μM Brz for 3 h. Bars = 10 μm.
(D) Graph showing the ratio of the nuclear-to-cytoplasmic signal intensity. The results are presented as means ± sd (n = 27). *P < 0.01, Student’s t test.
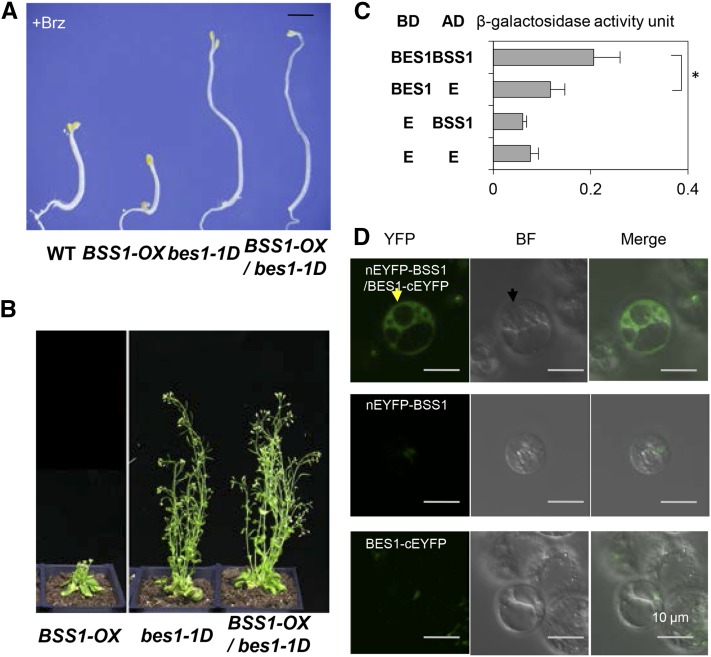
In both BSS1/BOP1-deficient and overexpression backgrounds, the BIL1/BZR1-GFP signal was detected in the nucleus and cytosol. Nevertheless, the BIL1/BZR1-GFP nucleus:cytosol signal ratio was higher in the bop1-3 bop2-1 background (Figures 9A and 9B) and lower in the BSS1/BOP1-overexpression transformant background (Figures 9C and 9D) than in the wild-type background. These results suggest that the binding of BSS1/BOP1 to BIL1/BZR1 and the punctate protein complex formation of BSS1/BOP1 inhibit the transportation of BIL1/BZR1 to the nucleus from the cytosol. Simultaneously, genetic and direct interactions were detected between BSS1/BOP1 and BES1, which is the homolog of BIL1/BZR1 (Figure 10).
Figure 10.
BSS1/BOP1 Interacts with BES1 and Inhibits BES1 Transport to the Nucleus from the Cytosol.
(A) Dark-grown phenotypes of the wild type, bss1-1D, bes1-1D, and the bss1-1D bes1-1D double mutant grown on medium containing 3 μM Brz in the dark for 7 d. Bar = 1 mm.
(B) Phenotypes of bss1-1D, bes1-1D, and the bss1-1D bil1-1D double mutant grown in the soil in long-day conditions for 40 d.
(C) Interaction between BSS1/BOP1 and BES1 using a yeast two-hybrid assay, as assessed by measuring β-galactosidase activity. cDNA encoding BES1 without the first 20 amino acids was cloned into the pDEST32 binding domain vector (BD). The cDNA of BSS1 was cloned into the pDEST22 prey vector (AD). Empty vector (E) was used as a control. The results are presented as means ± sd from three independent replicates. *P < 0.05, Student’s t test.
(D) BiFC analysis of the interaction between BSS1/BOP1 and BES1 in Arabidopsis protoplast cells. The protoplast cells were cotransformed with nEYFP-BSS1 and/or BES1-cEYFP constructs. The protoplast cells were grown in medium containing DMSO as a control experiment. YFP, YFP fluorescence; BF, bright field; Merge, merged image of YFP and BF. Arrows point to the nucleus. Bars = 5 μm.
DISCUSSION
In this study, we identified the bss1-1D mutant as having a Brz-hypersensitive phenotype in hypocotyl elongation. Brz reduces the levels of endogenous BR in plants and causes deetiolation and a dwarf phenotype that is similar to that of BR-deficient mutants. The phenotypes and the expression of BR-responsive marker genes in the bss1-1D mutant and the BSS1/BOP1-OX transformant in the presence of Brz suggest that BSS1/BOP1 is a negative regulator of BR signaling (Figures 1 to 3). Although other previously identified BR signaling-defective mutants, such as bri1 and bin2, exhibit shorter hypocotyls in the dark without Brz, bss1-1D exhibited normally elongated hypocotyls without Brz (Figures 1A and 1B; Supplemental Figures 1D and 1E) (Li et al., 2001a, 2001b). This Brz sensitivity of the bss1-1D mutant indicates that BSS1/BOP1 acts under BR-deficient conditions. Recently, bzs1-1D (bzr1-1D suppressor1-Dominant) was isolated from activation-tagging mutants, and the bzs1-1D mutation was found to be caused by the overexpression of the B-box zinc finger protein BZS1 (Sun et al., 2010; Fan et al., 2012). bzs1-1D exhibited normal hypocotyl elongation without Brz but shorter hypocotyls in the presence of Brz compared with those of the wild type, similar to the bss1-1D mutant. Nevertheless, the bzs1-1D and bzr1-1D double mutant exhibited shorter hypocotyls and smaller leaves than those of the bzr1-1D single mutant. By contrast, the bss1-1D and bil1-1D/bzr1-1D double mutant exhibited a bil1-1D/bzr1-1D phenotype in hypocotyl elongation, inflorescence, and rosette leaves (Figures 7A and 7B). These results suggest that BSS1/BOP1 is upstream of BIL1/BZR1 and BZS1 is downstream of BIL1/BZR1 and that bss1-1D is a unique phenotype in a BR signaling mutant.
By identifying the activation-tagging insertion in bss1-1D and by recapitulation analysis, the origin of the bss1-1D phenotype was revealed as being caused by At3g57130-encoded BOP1. BOP1 is a member of a family of the BTB-POZ domain proteins with ankyrin repeats that regulate leaf morphogenesis and boundary formation in leaves (Ha et al., 2003, 2007; Hepworth et al., 2005; Norberg et al., 2005; McKim et al., 2008). Recent studies have suggested that Arabidopsis BOP1 and BOP2, which are the closest homologs of BOP1, activate the transcription of ASYMMETRIC LEAVES2 (AS2) (Jun et al., 2010) and APETALA1 (AP1) (Xu et al., 2010) to promote cell differentiation at the leaf base and in floral shoots, respectively. However, these studies did not investigate the hypocotyl phenotype that is caused by BSS1/BOP1 or the relationship between BSS1/BOP1 and phytohormones that we suggest in this report (Figures 1A and 1B). We found that the expression of BSS1/BOP1 increased under BR-deficient conditions in the presence of Brz (Figure 4). The expression of BR-regulated marker genes and the phosphorylation status of the downstream biochemical marker protein BIL1/BZR1 suggest that BSS1 is a negative regulator of BR signaling (Figures 2 and 3). Our bop1-3 bop2-1 double mutant line exhibited phenotypes that included leafy petioles, loss of floral organ abscission, and asymmetric flowers subtended by a bract, as reported previously (Hepworth et al., 2005), and a longer elongation of the hypocotyl under Brz conditions compared with that of the wild-type plants (Figure 3). These results provide an indication that BSS1/BOP1 is involved in hypocotyl elongation under the control of phytohormone BR signaling.
We analyzed the punctate structure of BSS1/BOP1 in the cytosol. These punctate structures did not colocalize with the vesicle trafficking marker FM4-64, nor were they affected by BFA (Figures 6B and 6C). Via an immunoblot analysis of the BSS1/BOP1-GFP fusion protein under nonreducing conditions (without DTT), much higher molecular weight proteins were detected compared with the monomeric BSS1/BOP1-GFP fusion protein (molecular weight 78,000). The higher molecular weight protein signal was lost under reducing conditions with DTT (Figure 6A). BSS1-GFP could be precipitated by ultracentrifugation, and the BSS1-GFP pellet was not solubilized by detergents, although these detergents could nevertheless solubilize the mitochondrial membrane (Figure 6E). These microscopy and biochemical analyses suggest that the punctate structures of BSS1/BOP1-GFP were protein complexes. In Physcomitrella patens, Pp-BOP1 was observed as puncta in the cytosol (Saleh et al., 2011), and BOP2, which is homologous to BOP1, was identified in puncta after transient expression in Arabidopsis (Xu et al., 2010). However, in these two reports, the detailed mechanism underlying the formation of the BOP1 puncta had not yet been clarified. In this report, we found that the number of BSS1/BOP1 puncta increased under BR-deficient conditions in the presence of Brz, and this structure was diffused by BR treatment (Figure 5). The formation or dissociation of puncta of BSS1/BOP1 began only after 15 min of treatment with Brz or BR (Supplemental Figure 3A). Furthermore, puncta of BSS1/BOP1 were observed in both the roots and hypocotyl (Figures 5A and 5B). Because both the CaMV 35S-derived BSS1/BOP1-GFP and BSS1/BOP1 promoter-BSS1-GFP signals in the presence of Brz were observed as puncta, this protein complex was not an artifact but, rather, a naturally occurring phenomenon (Figure 6D). NPR1 is homologous to BSS1/BOP1 in that it has a BTB/POZ domain with ankyrin repeats (Supplemental Figure 2) and plays an important role in pathogen signaling. NPR1 is imported from the cytosol to the nucleus after salicylic acid treatment (Kinkema et al., 2000). NPR1 also formed a homodimer, but puncta were not observed. The BTB/POZ protein family is evolutionarily conserved from yeast to mammals, and at least 80 proteins are part of the BTB/POZ protein family in Arabidopsis (Gingerich et al., 2005). The BR-related molecular mechanism regulating the formation and dissociation of the BSS1/BOP1 complex suggested here will play an important role in the future analysis of the BTB/POZ protein family.
Prior to this study, a direct mechanism connecting the BSS1/BOP1 puncta induced by Brz and their dissociation by BR had not been identified. Altering the redox conditions by DTT resolved the BSS1/BOP1 oligomer and increased the amount of monomeric protein (Figure 6A). The plasma membrane-type ATPase AHA1 (for Arabidopsis plasma membrane H+-ATPase) is a BR receptor binding protein that regulates cell wall expansion (Caesar et al., 2011). Our recent study determined that the mitochondrial protein BIL2, which is a potential homolog of DnaJ, increased the ATP concentration in the cell and elongated hypocotyl in the presence of Brz (Bekh-Ochir et al., 2013). The regulation of the cellular ATP concentration by BR might change the cytosolic redox conditions and affect the formation of the BSS1/BOP1 complex.
The BSS1/BOP1 protein complex interacted with the master transacting factors BIL1/BZR1 and BES1 in BR signaling (Figures 7 and 10). The protein complex consisting of BSS1/BOP1 and BIL1/BZR1 could be identified by BiFC analysis, and the number of punctate signals as observed via BiFC increased after Brz treatment (Figure 7). Although BIL1/BZR1 is in a diffused monomeric state (Wang et al., 2002), we observed BIL1/BZR1 complex puncta in the cytosol with Brz treatment and in the BR receptor BRI1-deficient bri1-116 mutant background (Figure 8). These phenomena could be observed only under BR-deficient conditions. The transport of cytosolic BIL1/BZR1-GFP and BES1-GFP into the nucleus upon BL treatment is well studied, but studies of BIL1/BZR1-GFP and BES1-GFP under BR-deficient conditions are less common. We also found a previous report in which cytosolic BIL1/BZR1 and BES1/BZR2 puncta were observed after Brz treatment, although these punctate structures were not specifically mentioned (Gampala et al., 2007). Although the BIL1/BZR1 puncta have not yet been analyzed in detail, our results suggest that the BIL1/BZR1 puncta are formed under BR-deficient conditions and play important roles in the BR-signaling mechanism.
BSS1/BOP1-GFP complex formation was enhanced by Brz treatment in the cytosol and nucleus (Figure 5). The punctate fluorescence signal consisting of BSS1/BOP1 and BIL1/BZR1, as identified by BiFC analysis after Brz treatment, could only be detected in the cytosol and not in the nucleus (Figure 7E). The BIL1/BZR1-GFP signal in the nucleus was stronger in the bop1 bop2 background and weaker in the BSS1/BOP1-overexpression transformant background than in the wild-type background (Figure 9). These results indicate that the complex formation of BSS1/BOP1 increased the cytosolic retention of BIL1/BZR1 and inhibited the transport of BIL1/BZR1 from the cytosol to the nucleus.
The BSS1/BOP1-GFP protein complex was diffused by BL treatment and observed in the cytosol and nucleus (Figure 5). The dissociated fluorescence signal consisting of BSS1/BOP1 and BIL1/BZR1, as identified by BiFC after BL treatment, was observed not only in the cytosol but also in the nucleus (Figure 7E). The monomeric and diffused BSS1/BOP1 might be unable to retain BIL1/BZR1 in the cytosol, and the BIL1/BZR1 imported to the nucleus by BL treatment might be accompanied by BSS1/BOP1 (Figure 11).
Figure 11.
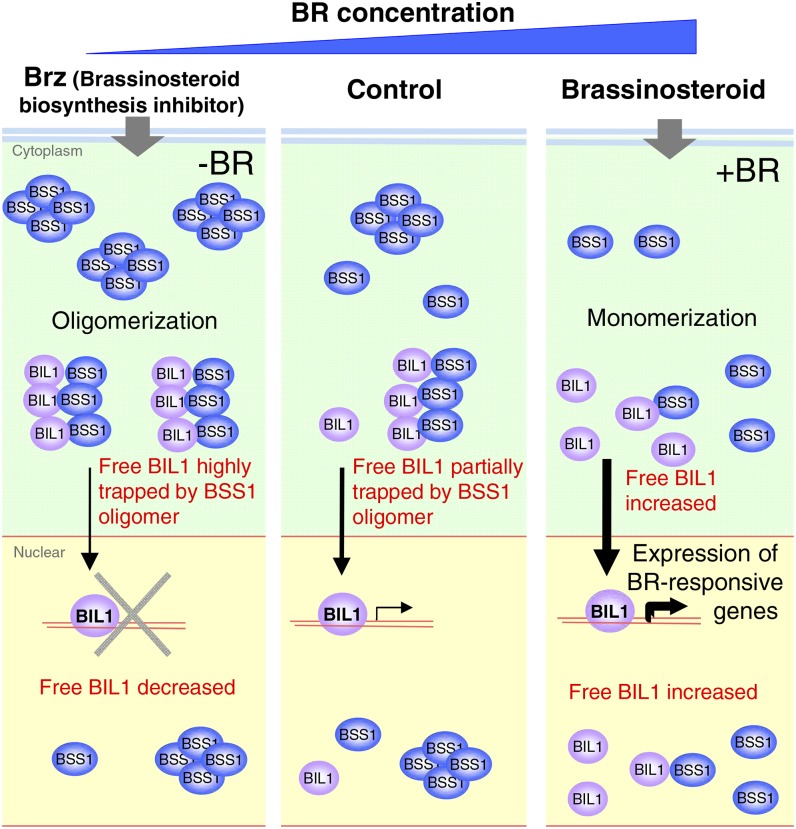
Model of BSS1/BOP1 Function in BR Signaling.
In the absence of BR activation by Brz, BSS1/BOP1 mRNA expression was induced. BSS1/BOP forms homooligomers and binds BIL1/BZR1, preventing the transport of BIL1/BZR1 to the nucleus. Upon stimulation of BR, the BSS1/BOP1 oligomer was reduced to a monomer, allowing BIL1/BZR1 to be transferred to the nucleus and to induce the expression of BR-responsive genes. BSS1/BOP1 must regulate BR signaling tightly to prevent the activation of BIL1/BZR1 and BES1 when plants should repress BR signaling, such as in the absence of BR or when seedlings are grown under light.
Recent research has revealed that the molecular mechanism regulating organ boundary formation in the shoot apical meristem (SAM) involves BR (Arnaud and Laufs, 2013; Caño-Delgado and Blázquez, 2013). BOP1 upregulates the expression of the LATERAL ORGAN BOUNDARIES (LOB) gene (Ha et al., 2007). LOB is specifically expressed in the organ boundary region between the SAM and leaf primordium, and the ectopic expression of LOB causes a dwarf leaf phenotype (Shuai et al., 2002). LOB suppresses BR activity in the boundary region by inducing the expression of the BR-inactivating enzyme BAS1 (Bell et al., 2012). The BR master transacting factor BZR1 suppresses the CUP-SHAPED COTYLEDON (CUC) family of organ boundary identification genes (Gendron et al., 2012). Mutation of the CUC gene causes a defect in the separation of the embryonic cotyledon and floral stamen (Aida et al., 1997). These reports suggest that BOP1 and BZR1 play important roles in the boundary region of the SAM by modulating BR signaling or biosynthesis, but these functions were considered to be independent. Our analysis suggested that BSS1/BOP1 bound to and negatively regulated BIL1/BZR1 and thus negatively regulated BR signaling. The molecular mechanism by which BSS1/BOP1 regulates BIL1/BZR1 might be the missing link between BSS1/BOP1 and BIL1/BZR1 in SAM development.
METHODS
Plant Materials and Growth Conditions
Arabidopsis thaliana ecotype Columbia-0 (Col-0) was used as the wild-type plant. The seeds were germinated on half-strength Murashige and Skoog (MS) medium (Duchefa) with 0.8% phytoagar (Duchefa) and 1.5% sucrose and were subsequently transferred to soil. The plants were grown at 22°C under white light (a 16-h-light/8-h-dark cycle for long-day conditions).
Screening for the bss1-1D Mutant
Approximately 10,000 RIKEN Genome Science Center Arabidopsis activation-tagging lines (Nakazawa et al., 2003) were screened on half-strength MS medium containing 3 μM Brz (Asami et al., 2000). After growth for 7 d in the dark, seedlings with shorter hypocotyls than those of the controls were identified and transferred to soil. Inverse PCR was used to amplify the flanking genomic sequences of the T-DNA of pPCVICE4HPT as described previously (Bradshaw, 2005). The total RNA was extracted from dark-grown 3-d-old seedlings of wild-type and bss1-1D plants using an RNeasy Plant Mini Kit (Qiagen). First-strand cDNA was synthesized with PrimeScript (Takara) and used in qRT-PCR. The qRT-PCR analysis was performed according to the instructions provided for the Thermal Cycler Dice (Takara) using a SYBR Premix ExTaq system (Takara). The following gene-specific primers were used for qRT-PCR analysis: for BSS1/BOP1, 5′-CATGACCTAACCTCGACTTT-3′ and 5′-CCCATCACCATTAGCTTC-3′; for the constitutively expressed control gene ACT2, 5′-CGCCATCCAAGCTGTTCTC-3′ and 5′-TCACGTCCAGCAAGGTCAAG-3′.
Generating Transgenic Plants
To recapitulate the bss1-1D phenotype and analyze the subcellular localization, BSS1/BOP1 cDNA without a stop codon was amplified from Arabidopsis Col-0 cDNA using the BSS1-Forward 5′-CACCATGAGCAATACTTCGAAGAATCACTCAAA-3′ and BSS1-Reverse 5′-GAAATGGTGGTGGTGGTGATGATACATC-3′ primers, cloned into pENTR/D-TOPO (Invitrogen), and subsequently cloned using the Gateway strategy (Invitrogen) into the binary vector pGWB5 (Nakagawa et al., 2007) (http://shimane-u.org/nakagawa/gbv.htm) containing a CaMV 35S promoter and GFP. BSS1/BOP1 cDNA was cloned between the CaMV 35S promoter and GFP. To construct the BSS1/BOP1 promoter fused with GUS and BSS1/BOP1 fused with GFP driven by its own promoter, a 1.0-kb fragment including the first exon and promoter region and a 3.0-kb fragment including the coding region and promoter region, respectively, were amplified from Arabidopsis Col-0 genomic DNA using the BSS1-GUS-Forward 5′-CACCATATGGTCGATCCCAAACCAACAGGAGAA-3′ and BSS1-GUS-Reverse 5′-AGTAAGCAACGCGAGCTGCTCGACGCCAAAGTA-3′ primers for the GUS construct and the BSS1-GFP-Forward 5′-CACCATATGGTCGATCCCAAACCAACAGGAGAA-3′ and BSS1-GFP-Reverse 5′-GAAATGGTGGTGGTGGTGATGATACATC-3′ primers for the GFP construct. The amplified products were cloned into pENTR/D-TOPO (Invitrogen) and subsequently cloned into the binary vectors pGWB3 and pGWB4 using the Gateway strategy (Invitrogen). To analyze the subcellular localization of BIL1/BZR1, cDNA without a stop codon was amplified using the BIL1-Forward 5′-CACCATGACTTCGGATGGAGCTAC-3′ and BIL1-Reverse 5′-ACCACGAGCCTTCCCATTTCC-3′ primers, cloned into pENTR/D-TOPO (Invitrogen), and subsequently cloned into the binary vector pGWB5. The resulting CaMV 35S-BSS1/BOP1-GFP, CaMV 35S-BZR1/BIL1-GFP, BSS1/BOP1 promoter:BSS1/BOP1-GFP, and BSS1/BOP1 pro:GUS fusion constructs were transformed into Col-0 via the floral dipping method (Clough and Bent, 1998). The transgenic plants were screened on half-strength MS medium containing 25 mg/L kanamycin.
qRT-PCR
Total RNA was extracted from plants using the RNeasy Plant Mini Kit (Qiagen). The first-strand cDNA was synthesized using PrimeScript (Takara) and was used in qRT-PCR. The qRT-PCR was performed according to the instructions provided for the Thermal Cycler Dice (Takara) using the SYBR Premix ExTaq system (Takara). The following primers were used: TCH4-Forward 5′-CGAGTCTTGGAACGCTGAT-3′ and TCH4-Reverse 5′-CTTCTTGTTGAAAGCCACGG-3′, BAS1-Forward 5′-GCCAAATTGACACTCGCTGTAA-3′ and BAS1-Reverse 5′-GACGGTAGGTGCATGCTGATAA-3′, IAA19-Forward 5′-GAAGGACTCGGGCTTGAGAT-3′ and IAA19-Reverse 5′-GACGCCGCTTTCACATTG-3′, and SAUR-AC1-Forward 5′-GAGATATGTGGTGCCGGTTT-3′ and SAUR-AC1-Reverse 5′-GTATTGTTAAGCCGCCCATT-3′.
GUS Staining
Seedlings of the BSS1/BOP1 pro:GUS transgenic plants were used for the histochemical detection of GUS expression. The samples were stained at 37°C overnight in GUS staining solution as described previously (Ito and Fukuda, 2002). To test the induction of GUS expression, 3-d-old transgenic seedlings were grown on medium with 3 μM Brz or DMSO as a control.
Fluorescence Microscopy
The plants that were transformed with the CaMV 35S-BSS1/BOP1-GFP construct BSS1/BOP1(-GFP)-OX and the CaMV 35S-BIL1/BZR1-GFP construct BIL1/BZR1-GFP-OX were observed via confocal laser scanning microscopy with a BX60 fluorescence microscope (Olympus) equipped with a model CSU10 confocal scanner (Yokogawa Electric) and an LSM700 microscope (Zeiss).
BFA Treatment and FM4-64 Staining
FM4-64 (Molecular Probes) dissolved in water was applied at a final concentration of 4 μM for 3 min to Arabidopsis plants. The plants were washed with water to remove excess dye and observed. BFA (Sigma-Aldrich) in a DMSO-based stock solution was applied to the cells at a final concentration of 50 μM for 1 h.
Analysis of Signal Intensities
The images were analyzed using ImageJ software (http://rsb.info.nih.gov/ij/). To measure the ratio of the nuclear and cytoplasmic signals of BIL1/BZR1-GFP for each cell, the signal intensities in the nucleus and cytoplasm were calculated from the mean of the intensity in each area. The nuclear-to-cytoplasmic signal ratio was then calculated for each cell. The average nuclear-to-cytoplasmic signal ratio and se were calculated from measurements of at least 54 cells from each line (Figure 9B). Line-scan measurements from the vacuole to the nucleus through the cytoplasm were performed, and representative plot profiles of sample measurements are presented in Figure 5C. Images taken under the same microscopy conditions (Supplemental Figure 3B) were used to count the number of puncta and to measure the ratio of intensity of puncta to whole cell as presented in Supplemental Figure 4. The images were adjusted to the same settings of brightness and contrast (maximum = 51). Visible puncta and whole cells were counted, and the signal intensity was measured.
BiFC
The BSS1/BOP1, BIL1/BZR1, and BES1 cDNAs were amplified using the BSS1-Forward and BSS1-Reverse-SC 5′-CTAGAAATGGTGGTGGTGGTGATGATAC-3′ primers for BSS1/BOP1, the BIL1-Forward and BIL1-Reverse primers for BIL1/BZR1, and the BES1-Forward 5′-CACCATGACGTCTGACGGAGCAAC-3′ and BES1-Reverse 5′-ACTATGAGCTTTACCATTTCCAAG-3′ primers for BES1. They were then cloned into pENTR/D-TOPO (Invitrogen) and subsequently cloned into the binary Gateway expression vectors nEYFP/pUGW0 and cEYFP/pUGW2 by LR recombination. The resulting vectors encoding nEYFP-BSS1 and BIL1/BZR1 or BES1-cEYFP were used for a transient expression analysis in Arabidopsis suspension-cultured cells as described previously (Ueda et al., 2004). The protoplasts were observed using an LSM700 microscope (Zeiss).
Immunoblot Analysis
Light-grown 7- and 10-d-old wild-type, bss1-1D, BSS1/BOP1-OX, bop1-3, and bop1-3 bop2-1 seedlings were ground in liquid nitrogen and extracted by boiling with equal volumes per fresh weight of 1× Laemmli buffer (50 mM Tris-HCl, pH 6.8, 100 mM DTT, 2% [w/v] SDS, 0.1% [w/v] bromophenol blue, and 10% [w/v] glycerol) for an immunoblot analysis of BIL1/BZR1 and BSS1/BOP1-GFP. The proteins were separated by SDS-PAGE (10% acrylamide gel). After electrophoresis, the proteins were electrophoretically transferred to a Hybond ECL nitrocellulose membrane (Amersham). After blocking in TBS (20 mM Tris, 0.137 M NaCl, pH 7.4, and 0.05% polyoxyethylene sorbitol monolaurate) containing 5% nonfat milk (Morinaga milk) at room temperature, the membrane was incubated overnight at 4°C in Western Blot Immuno Booster Solution 1 (Takara) with a polyclonal antibody (1:20,000) against GFP (Molecular Probes) and BIL1/BZR1. After washing in TBS containing 1% nonfat milk (Morinaga milk) at room temperature, the blots were incubated in Western Blot Immuno Booster Solution 2 (Takara) with horseradish peroxidase-conjugated secondary antibody (1:50,000; Promega) for 1 h at room temperature, and the complexes were visualized with ECL Immobilon Western HRP substrate (Millipore). The polyclonal antibody against BIL1/BZR1 was produced by immunizing rabbits with maltose binding protein-tagged BIL1/BZR1 proteins (amino acids 91 to 336). The antibody was affinity purified using a BIL1/BZR1 polypeptide. The LAS-4000 mini (Fuji Film) digital imaging system was used for detection. A nonreduction immunoblot analysis was performed essentially as described previously (Mou et al., 2003). The images were analyzed using ImageQuant TL software (version 7.0; GE Healthcare Life Sciences) to determine the relative signal intensity.
Precipitation and Detergent Treatment of the BSS1 Protein Complex
A total of 2 g of plant material was frozen in liquid nitrogen, extracted by grinding with a mortar and pestle, and suspended in 5 mL of cold extraction buffer (50 mM Tris-HCl, pH 7.5, 20% sucrose, and protease inhibitor cocktail [Sigma-Aldrich]). This lysate was centrifuged at 200g for 2 min at 4°C, and the resulting supernatant was further centrifuged at 50,000 rpm (153,000g) for 2 h at 4°C. The pellets were then suspended in 300 μL of extraction buffer containing 0.5% detergent (w/v for CHAPS, v/v for Triton X-100 and Nonidet P-40). The detergent-treated pellets were centrifuged at 50,000 rpm (153,000g) for 2 h at 4°C. Each supernatant sample was loaded onto an Amicon Ultra-0.5 Centrifugal Filter (Millipore) and concentrated to a volume of 120 μL. The recovered supernatants and pellets that were extracted from equal volumes of plant material were used for immunoblot analysis.
Yeast Two-Hybrid Analysis
cDNA encoding BIL1/BZR1 without the first 21 amino acids, BES1 without the first 20 amino acids, and full-length BSS1/BOP1 were cloned into the pDEST32 bait vector (Invitrogen). cDNA encoding full-length BSS1/BOP1 was cloned into the pDEST22 prey vector (Invitrogen). The plasmids were transformed into the yeast strain Y187 (Clontech). The resulting yeast cells were used to quantify the yeast two-hybrid analysis. The positive transformants that grew on the selection medium were further grown and resuspended in assay buffer (180 mM HEPES, 154 mM NaCl, 1 mM l-aspartate [hemi-Mg salt], 1% BSA, and 0.05% Tween 20, pH 7.3) containing 2.23 mM chlorophenol red-β-d-galactopyranoside as a substrate as described in the manufacturer’s protocol for the ProQuest Two-Hybrid System (Invitrogen). To quantify the protein-protein interaction, the β-galactosidase activity was measured at OD574 using Microplate Reader SH-9000 (Corona Electric) and the β-galactosidase activity was calculated using the following formula: 1000 × OD574/(OD600 × assay time in min × assay volume in mL).
Immunoprecipitation Analysis
Plants (5 g fresh weight) grown for 23 d on half-strength MS medium were frozen in liquid nitrogen, extracted by grinding with a mortar and pestle, and added to 14 mL of cold extraction buffer (50 mM Tris-HCl, pH 7.5, 150 mM NaCl, 5 mM EDTA, 0.1% Triton X-100, 0.2% Nonidet P-40, and protease inhibitor cocktail [Sigma-Aldrich]). This lysate was centrifuged twice at 10,000g for 5 min at 4°C. The supernatant was incubated for 1 h at 4°C with anti-FLAG M2 affinity gel (Sigma-Aldrich). The beads were collected and washed four times with ice-cold extraction buffer, and the FLAG-associated proteins were eluted with 2× SDS sample loading buffer (4% SDS, 100 mM Tris-HCl, pH 6.8, 200 mM DTT, 20% glycerol, and 0.003% [w/v] Bromophenol blue). After incubation at 100°C for 5 min, the proteins were resolved by SDS-PAGE. The immunoprecipitated proteins were detected by immunoblot analysis on Hybond ECL nitrocellulose membranes (GE Healthcare) using a monoclonal anti-FLAG M2 antibody (Sigma-Aldrich) at a 1:500 dilution and an anti-GFP antibody (Molecular Probes) at a 1:2000 dilution.
Accession Numbers
Sequence data from this article can be found in the Arabidopsis Genome Initiative or GenBank/EMBL data libraries under the following accession numbers: BSS1/BOP1 (AT3G57130), BIL1/BZR1 (AT1G75080), BES1 (AT1G19350), BRI1 (AT4G39400), DWF4 (AT3G50660), DET2 (AT2G38050), BIN2 (AT4G18710), 14-3-3 (AT1G22230), SAUR-AC1 (AT4G38850), TCH4 (AT4G57560), CPD (AT5G05690), ACT2 (AT3G18780), AS2 (AT1G65620), AP1 (AT1G69120), Pp-BOP1 (Phypa_119190), Pp-BOP2 (Phypa_121620), NPR1 (AT1G64280), BZS (AT4G39070), LOB (AT5G63090), CUC (AT3G15170), and AHA1 (AT2G18960).
Supplemental Data
Supplemental Figure 1. The Phenotype of bss1-1D Resembles the Phenotype of BR-Deficient Mutants.
Supplemental Figure 2. BSS1 Protein Encoded by the BOP1 Gene.
Supplemental Figure 3. Analysis of the BSS1/BOP1-GFP Signal for Short-Term Stimulations and Intensities as Shown in Figure 5C.
Supplemental Figure 4. Analysis of the Signal Intensities of Puncta of BSS1/BOP1-GFP after Treatment with Brz and BL as in the Images in Supplemental Figure 3.
Supplemental Figure 5. BSS1/BOP1 mRNA Expression in BSS1/BOP1-OX2.
Supplemental Data Set 1. Alignment Used to Generate the Phylogeny Presented in Supplemental Figure 2B.
Supplementary Material
Acknowledgments
We thank Kazuyo Saeki for technical assistance. We also thank Tsuyoshi Nakagawa (Shimane University) for the gift of the Gateway vectors and the Salk Institute and the ABRC for providing the Arabidopsis T-DNA insertion lines. This work was supported by the Program for the Promotion of Basic Research Activities for Innovation Bioscience (to T.N. and T.A.) and the Core Research for Evolutional Science and Technology, Japan Science and Technology Agency (to T.N. and T.A.).
AUTHOR CONTRIBUTIONS
T.N. conceived, designed, and directed the research. S.S., T.K., and A.Y. designed and performed and analyzed the experiments and the results. M. Nakazawa and M.M. supplied the mutant. T.A., H.K., M. Natsume, and H.O. directed and supervised the project. T.N., S.S., and A.Y. wrote the article. All of the authors commented on the results and the article.
Glossary
- BR
brassinosteroid
- Brz
brassinazole
- qRT-PCR
quantitative real time-PCR
- BL
brassinolide
- BFA
brefeldin A
- BiFC
bimolecular fluorescence complementation
- SAM
shoot apical meristem
- Col-0
Columbia-0
- MS
Murashige and Skoog
Footnotes
Articles can be viewed online without a subscription.
References
- Aida M., Ishida T., Fukaki H., Fujisawa H., Tasaka M. (1997). Genes involved in organ separation in Arabidopsis: An analysis of the cup-shaped cotyledon mutant. Plant Cell 9: 841–857. [DOI] [PMC free article] [PubMed] [Google Scholar]
- Arnaud N., Laufs P. (2013). Plant development: Brassinosteroids go out of bounds. Curr. Biol. 23: R152–R154. [DOI] [PubMed] [Google Scholar]
- Asami T., Min Y.K., Nagata N., Yamagishi K., Takatsuto S., Fujioka S., Murofushi N., Yamaguchi I., Yoshida S. (2000). Characterization of brassinazole, a triazole-type brassinosteroid biosynthesis inhibitor. Plant Physiol. 123: 93–100. [DOI] [PMC free article] [PubMed] [Google Scholar]
- Asami T., Mizutani M., Fujioka S., Goda H., Min Y.K., Shimada Y., Nakano T., Takatsuto S., Matsuyama T., Nagata N., Sakata K., Yoshida S. (2001). Selective interaction of triazole derivatives with DWF4, a cytochrome P450 monooxygenase of the brassinosteroid biosynthetic pathway, correlates with brassinosteroid deficiency in planta. J. Biol. Chem. 276: 25687–25691. [DOI] [PubMed] [Google Scholar]
- Asami T., Nakano T., Nakashita H., Sekimata K., Shimada Y., Yoshida S. (2003). The influence of chemical genetics on plant science: Shedding light on functions and mechanism of action of brassinosteroids using biosynthesis inhibitors. J. Plant Growth Regul. 22: 336–349. [DOI] [PubMed] [Google Scholar]
- Bekh-Ochir D., Shimada S., Yamagami A., Kanda S., Ogawa K., Nakazawa M., Matsui M., Sakuta M., Osada H., Asami T., Nakano T. (2013). A novel mitochondrial DnaJ/Hsp40 family protein BIL2 promotes plant growth and resistance against environmental stress in brassinosteroid signaling. Planta 237: 1509–1525. [DOI] [PMC free article] [PubMed] [Google Scholar]
- Bell E.M., Lin W.C., Husbands A.Y., Yu L., Jaganatha V., Jablonska B., Mangeon A., Neff M.M., Girke T., Springer P.S. (2012). Arabidopsis lateral organ boundaries negatively regulates brassinosteroid accumulation to limit growth in organ boundaries. Proc. Natl. Acad. Sci. USA 109: 21146–21151. [DOI] [PMC free article] [PubMed] [Google Scholar]
- Bradshaw H.D., Jr. (2005). Mutations in CAX1 produce phenotypes characteristic of plants tolerant to serpentine soils. New Phytol. 167: 81–88. [DOI] [PubMed] [Google Scholar]
- Caesar K., Elgass K., Chen Z., Huppenberger P., Witthöft J., Schleifenbaum F., Blatt M.R., Oecking C., Harter K. (2011). A fast brassinolide-regulated response pathway in the plasma membrane of Arabidopsis thaliana. Plant J. 66: 528–540. [DOI] [PubMed] [Google Scholar]
- Caño-Delgado A.I., Blázquez M.A. (2013). Spatial control of plant steroid signaling. Trends Plant Sci. 18: 235–236. [DOI] [PubMed] [Google Scholar]
- Cao H., Glazebrook J., Clarke J.D., Volko S., Dong X. (1997). The Arabidopsis NPR1 gene that controls systemic acquired resistance encodes a novel protein containing ankyrin repeats. Cell 88: 57–63. [DOI] [PubMed] [Google Scholar]
- Clough S.J., Bent A.F. (1998). Floral dip: A simplified method for Agrobacterium-mediated transformation of Arabidopsis thaliana. Plant J. 16: 735–743. [DOI] [PubMed] [Google Scholar]
- Després C., Chubak C., Rochon A., Clark R., Bethune T., Desveaux D., Fobert P.R. (2003). The Arabidopsis NPR1 disease resistance protein is a novel cofactor that confers redox regulation of DNA binding activity to the basic domain/leucine zipper transcription factor TGA1. Plant Cell 15: 2181–2191. [DOI] [PMC free article] [PubMed] [Google Scholar]
- Fan X.-Y., Sun Y., Cao D.-M., Bai M.-Y., Luo X.-M., Yang H.-J., Wei C.-Q., Zhu S.-W., Sun Y., Chong K., Wang Z.-Y. (2012). BZS1, a B-box protein, promotes photomorphogenesis downstream of both brassinosteroid and light signaling pathways. Mol. Plant 5: 591–600. [DOI] [PMC free article] [PubMed] [Google Scholar]
- Gampala S.S., et al. (2007). An essential role for 14-3-3 proteins in brassinosteroid signal transduction in Arabidopsis. Dev. Cell 13: 177–189. [DOI] [PMC free article] [PubMed] [Google Scholar]
- Gendron J.M., Liu J.-S., Fan M., Bai M.-Y., Wenkel S., Springer P.S., Barton M.K., Wang Z.-Y. (2012). Brassinosteroids regulate organ boundary formation in the shoot apical meristem of Arabidopsis. Proc. Natl. Acad. Sci. USA 109: 21152–21157. [DOI] [PMC free article] [PubMed] [Google Scholar]
- Gingerich D.J., Gagne J.M., Salter D.W., Hellmann H., Estelle M., Ma L., Vierstra R.D. (2005). Cullins 3a and 3b assemble with members of the broad complex/tramtrack/bric-a-brac (BTB) protein family to form essential ubiquitin-protein ligases (E3s) in Arabidopsis. J. Biol. Chem. 280: 18810–18821. [DOI] [PubMed] [Google Scholar]
- Gudesblat G.E., Russinova E. (2011). Plants grow on brassinosteroids. Curr. Opin. Plant Biol. 14: 530–537. [DOI] [PubMed] [Google Scholar]
- Ha C.M., Jun J.H., Nam H.G., Fletcher J.C. (2004). BLADE-ON-PETIOLE1 encodes a BTB/POZ domain protein required for leaf morphogenesis in Arabidopsis thaliana. Plant Cell Physiol. 45: 1361–1370. [DOI] [PubMed] [Google Scholar]
- Ha C.M., Jun J.H., Nam H.G., Fletcher J.C. (2007). BLADE-ON-PETIOLE 1 and 2 control Arabidopsis lateral organ fate through regulation of LOB domain and adaxial-abaxial polarity genes. Plant Cell 19: 1809–1825. [DOI] [PMC free article] [PubMed] [Google Scholar]
- Ha C.M., Kim G.T., Kim B.C., Jun J.H., Soh M.S., Ueno Y., Machida Y., Tsukaya H., Nam H.G. (2003). The BLADE-ON-PETIOLE 1 gene controls leaf pattern formation through the modulation of meristematic activity in Arabidopsis. Development 130: 161–172. [DOI] [PubMed] [Google Scholar]
- Hagiwara Y., Komoda K., Yamanaka T., Tamai A., Meshi T., Funada R., Tsuchiya T., Naito S., Ishikawa M. (2003). Subcellular localization of host and viral proteins associated with tobamovirus RNA replication. EMBO J. 22: 344–353. [DOI] [PMC free article] [PubMed] [Google Scholar]
- He J.X., Gendron J.M., Sun Y., Gampala S.S., Gendron N., Sun C.Q., Wang Z.Y. (2005). BZR1 is a transcriptional repressor with dual roles in brassinosteroid homeostasis and growth responses. Science 307: 1634–1638. [DOI] [PMC free article] [PubMed] [Google Scholar]
- He J.X., Gendron J.M., Yang Y., Li J., Wang Z.Y. (2002). The GSK3-like kinase BIN2 phosphorylates and destabilizes BZR1, a positive regulator of the brassinosteroid signaling pathway in Arabidopsis. Proc. Natl. Acad. Sci. USA 99: 10185–10190. [DOI] [PMC free article] [PubMed] [Google Scholar]
- Hepworth S.R., Zhang Y., McKim S., Li X., Haughn G.W. (2005). BLADE-ON-PETIOLE-dependent signaling controls leaf and floral patterning in Arabidopsis. Plant Cell 17: 1434–1448. [DOI] [PMC free article] [PubMed] [Google Scholar]
- Hothorn M., Belkhadir Y., Dreux M., Dabi T., Noel J.P., Wilson I.A., Chory J. (2011). Structural basis of steroid hormone perception by the receptor kinase BRI1. Nature 474: 467–471. [DOI] [PMC free article] [PubMed] [Google Scholar]
- Ito J., Fukuda H. (2002). ZEN1 is a key enzyme in the degradation of nuclear DNA during programmed cell death of tracheary elements. Plant Cell 14: 3201–3211. [DOI] [PMC free article] [PubMed] [Google Scholar]
- Jun J.H., Ha C.M., Fletcher J.C. (2010). BLADE-ON-PETIOLE1 coordinates organ determinacy and axial polarity in Arabidopsis by directly activating ASYMMETRIC LEAVES2. Plant Cell 22: 62–76. [DOI] [PMC free article] [PubMed] [Google Scholar]
- Khan M., Xu M., Murmu J., Tabb P., Liu Y., Storey K., McKim S.M., Douglas C.J., Hepworth S.R. (2012). Antagonistic interaction of BLADE-ON-PETIOLE1 and 2 with BREVIPEDICELLUS and PENNYWISE regulates Arabidopsis inflorescence architecture. Plant Physiol. 158: 946–960. [DOI] [PMC free article] [PubMed] [Google Scholar]
- Kinkema M., Fan W., Dong X. (2000). Nuclear localization of NPR1 is required for activation of PR gene expression. Plant Cell 12: 2339–2350. [DOI] [PMC free article] [PubMed] [Google Scholar]
- Kinoshita T., Caño-Delgado A., Seto H., Hiranuma S., Fujioka S., Yoshida S., Chory J. (2005). Binding of brassinosteroids to the extracellular domain of plant receptor kinase BRI1. Nature 433: 167–171. [DOI] [PubMed] [Google Scholar]
- Li J., Lease K.A., Tax F.E., Walker J.C. (2001a). BRS1, a serine carboxypeptidase, regulates BRI1 signaling in Arabidopsis thaliana. Proc. Natl. Acad. Sci. USA 98: 5916–5921. [DOI] [PMC free article] [PubMed] [Google Scholar]
- Li J., Nam K.H., Vafeados D., Chory J. (2001b). BIN2, a new brassinosteroid-insensitive locus in Arabidopsis. Plant Physiol. 127: 14–22. [DOI] [PMC free article] [PubMed] [Google Scholar]
- McKim S.M., Stenvik G.E., Butenko M.A., Kristiansen W., Cho S.K., Hepworth S.R., Aalen R.B., Haughn G.W. (2008). The BLADE-ON-PETIOLE genes are essential for abscission zone formation in Arabidopsis. Development 135: 1537–1546. [DOI] [PubMed] [Google Scholar]
- Mou Z., Fan W., Dong X. (2003). Inducers of plant systemic acquired resistance regulate NPR1 function through redox changes. Cell 113: 935–944. [DOI] [PubMed] [Google Scholar]
- Nakagawa T., Kurose T., Hino T., Tanaka K., Kawamukai M., Niwa Y., Toyooka K., Matsuoka K., Jinbo T., Kimura T. (2007). Development of series of Gateway binary vectors, pGWBs, for realizing efficient construction of fusion genes for plant transformation. J. Biosci. Bioeng. 104: 34–41. [DOI] [PubMed] [Google Scholar]
- Nakazawa M., Ichikawa T., Ishikawa A., Kobayashi H., Tsuhara Y., Kawashima M., Suzuki K., Muto S., Matsui M. (2003). Activation tagging, a novel tool to dissect the functions of a gene family. Plant J. 34: 741–750. [DOI] [PubMed] [Google Scholar]
- Nebenführ A., Ritzenthaler C., Robinson D.G. (2002). Brefeldin A: Deciphering an enigmatic inhibitor of secretion. Plant Physiol. 130: 1102–1108. [DOI] [PMC free article] [PubMed] [Google Scholar]
- Nishikiori M., Dohi K., Mori M., Meshi T., Naito S., Ishikawa M. (2006). Membrane-bound tomato mosaic virus replication proteins participate in RNA synthesis and are associated with host proteins in a pattern distinct from those that are not membrane bound. J. Virol. 80: 8459–8468. [DOI] [PMC free article] [PubMed] [Google Scholar]
- Norberg M., Holmlund M., Nilsson O. (2005). The BLADE ON PETIOLE genes act redundantly to control the growth and development of lateral organs. Development 132: 2203–2213. [DOI] [PubMed] [Google Scholar]
- Ryu H., Kim K., Cho H., Park J., Choe S., Hwang I. (2007). Nucleocytoplasmic shuttling of BZR1 mediated by phosphorylation is essential in Arabidopsis brassinosteroid signaling. Plant Cell 19: 2749–2762. [DOI] [PMC free article] [PubMed] [Google Scholar]
- Saleh O., Issman N., Seumel G.I., Stav R., Samach A., Reski R., Frank W., Arazi T. (2011). MicroRNA534a control of BLADE-ON-PETIOLE 1 and 2 mediates juvenile-to-adult gametophyte transition in Physcomitrella patens. Plant J. 65: 661–674. [DOI] [PubMed] [Google Scholar]
- Shuai B., Reynaga-Peña C.G., Springer P.S. (2002). The LATERAL ORGAN BOUNDARIES gene defines a novel, plant-specific gene family. Plant Physiol. 129: 747–761. [DOI] [PMC free article] [PubMed] [Google Scholar]
- Sun Y., et al. (2010). Integration of brassinosteroid signal transduction with the transcription network for plant growth regulation in Arabidopsis. Dev. Cell 19: 765–777. [DOI] [PMC free article] [PubMed] [Google Scholar]
- Ueda T., Uemura T., Sato M.H., Nakano A. (2004). Functional differentiation of endosomes in Arabidopsis cells. Plant J. 40: 783–789. [DOI] [PubMed] [Google Scholar]
- Vida T.A., Emr S.D. (1995). A new vital stain for visualizing vacuolar membrane dynamics and endocytosis in yeast. J. Cell Biol. 128: 779–792. [DOI] [PMC free article] [PubMed] [Google Scholar]
- Wang Z.-Y., Bai M.-Y., Oh E., Zhu J.-Y. (2012). Brassinosteroid signaling network and regulation of photomorphogenesis. Annu. Rev. Genet. 46: 701–724. [DOI] [PubMed] [Google Scholar]
- Wang Z.Y., Nakano T., Gendron J., He J., Chen M., Vafeados D., Yang Y., Fujioka S., Yoshida S., Asami T., Chory J. (2002). Nuclear-localized BZR1 mediates brassinosteroid-induced growth and feedback suppression of brassinosteroid biosynthesis. Dev. Cell 2: 505–513. [DOI] [PubMed] [Google Scholar]
- Xu M., Hu T., McKim S.M., Murmu J., Haughn G.W., Hepworth S.R. (2010). Arabidopsis BLADE-ON-PETIOLE1 and 2 promote floral meristem fate and determinacy in a previously undefined pathway targeting APETALA1 and AGAMOUS-LIKE24. Plant J. 63: 974–989. [DOI] [PubMed] [Google Scholar]
- Yanagawa Y., Ohhashi A., Murakami Y., Saeki Y., Yokosawa H., Tanaka K., Hashimoto J., Sato T., Nakagawa H. (1999). Purification and characterization of the 26S proteasome from cultured rice (Oryza sativa) cells. Plant Sci. 149: 33–41. [Google Scholar]
- Yin Y., Vafeados D., Tao Y., Yoshida S., Asami T., Chory J. (2005). A new class of transcription factors mediates brassinosteroid-regulated gene expression in Arabidopsis. Cell 120: 249–259. [DOI] [PubMed] [Google Scholar]
- Zhang Y., Fan W., Kinkema M., Li X., Dong X. (1999). Interaction of NPR1 with basic leucine zipper protein transcription factors that bind sequences required for salicylic acid induction of the PR-1 gene. Proc. Natl. Acad. Sci. USA 96: 6523–6528. [DOI] [PMC free article] [PubMed] [Google Scholar]
Associated Data
This section collects any data citations, data availability statements, or supplementary materials included in this article.


