

Abstract
It has long been known that platelets undergo margination when flowing in blood vessels, such that there is an excess concentration near the vessel wall. We conduct experiments and three-dimensional boundary integral simulations of platelet-sized spherical particles in a microchannel 30 μm in height to measure the particle-concentration distribution profile and observe its margination at 10%, 20%, and 30% red blood cell hematocrit. The experiments involved adding 2.15-μm-diameter spheres into a solution of red blood cells, plasma, and water and flowing this mixture down a microfluidic channel at a wall shear rate of 1000 s−1. Fluorescence imaging was used to determine the height and velocity of particles in the channel. Experimental results indicate that margination has largely occurred before particles travel 1 cm downstream and that hematocrit plays a role in the degree of margination. With simulations, we can track the trajectories of the particles with higher resolution. These simulations also confirm that margination from an initially uniform distribution of spheres and red blood cells occurs over the length scale of O(1 cm), with higher hematocrit showing faster margination. The results presented here, from both experiments and 3D simulations, may help explain the relationship between bleeding time in vessel trauma and red blood cell hematocrit as platelets move to a vessel wall.
Introduction
The nonuniform distribution of red blood cells (RBCs) and platelets within a blood vessel is critical in the processes of hemostasis and thrombosis (1,2). After suffering an injury, subendothelial cells expose collagen, which recruits von Willebrand factor (VWF) from the blood flow (3). Platelets adsorb to the VWF, and then begin the formation of a platelet plug, or thrombosis, stopping blood loss and beginning the healing process (4). Thus, it is advantageous for platelets to be concentrated near the vessel wall, where they can quickly identify and respond to vessel wall injuries. The platelet distribution is in turn controlled by the distribution of the more populous RBCs (5).
When subjected to pressure-driven flow, such as in the microcirculation, RBCs are driven away from the wall and toward the blood vessel core, a phenomenon first quantified by Fahreus and Lindqvist (6). The evacuation of RBCs leaves behind a small cell-free region of fluid in the near-wall regime (7,8). Goldsmith and Marlow (9) provided an explanation of this lateral migration by using a microscope to observe RBCs in pressure-driven flow through 30- to 80-μm tubes. They found that under flow, the RBCs deformed considerably from the biconcave shape, generally aligning with the flow direction as the membrane rotated about the cell body. This tank-treading configuration breaks particle symmetry, and the cell climbs away from the wall. Gaehtgens and co-workers (10) observed similar shape changes of RBCs using a traveling capillary method. Aarts et al. (1) provided further confirmation for the cell-free region using a laser-Doppler technique to measure RBC concentration in 3-mm-diameter tubes. Suzuki and co-workers (11) conducted experiments to show that cell-free layer thickness decreased with decreasing cell deformability.
Because platelets occupy a small volume of whole blood, platelet-platelet collisions are relatively rare, and RBC-platelet collisions dominate the redistribution of platelets in blood. The core of the channel is rich in RBCs, which forced platelets to the outside of the vessel. Tangelder et al. (12) and Woldhuis et al. (13) measured the distribution of platelets in rabbit arterioles (vessel diameter 15–33 μm), finding an excess of platelets near the wall. Aarts et al. measured platelet distributions in significantly larger channels (3 mm), predicting that the largest platelet concentrations occurred at the cell wall. Eckstein et al. (14) theorized that platelet movement could be modeled with an ad hoc drift term superimposed on a diffusive model. They investigated this theory with a series of in vitro experiments, finding good agreement between experiments and theory for larger chambers (channel diameter >200 μm) (14,15). In contrast to Aarts et al., Eckstein predicted a maximum platelet concentration slightly removed from the vessel wall. Tokarev built a mathematical model to study the platelet distribution profile and examined the finite size effect on platelet margination (16). While they were researching platelet margination at elevated shear stresses, Zhao et al. (17) showed that the theories of both Aarts et al. and Eckstein agreed with the data, depending on the experimental resolution in the near-wall region. Uijttewaal and co-workers (18) studied the distribution of platelets and RBCs in a 100 μm channel, making contact with lateral migration theories in the dilute limit, and Xu and Wootton investigated platelet concentration in the near-wall region of tubes with an inner diameter of 3 mm by diverting a small portion of the flow (19).
Moreover, there has been substantial interest in simulation of platelet distribution, especially as modern computers have enabled simulations to begin accessing physiologically relevant regimes. Pozrikidis (20) conducted oblate spheroid simulations to explain the lack of platelet lift velocity near a wall relative to that of RBCs. To handle suspensions, Crowl and Fogelson (21) used two-dimensional numerical simulations of RBCs and platelets. They found a very large shear-induced platelet diffusivity (10−6 μm2/s) in the channel core that dropped quickly to zero at the channel wall. Zhao et al. (22) built a three-dimensional simulation including RBCs and platelets. They found that the third dimension reduced the platelet diffusivity by an order of magnitude, but the shear-induced diffusivity still dominated Brownian motion. Furthermore, Zhao et al. discovered the platelet drift velocity, as originally predicted by Eckstein et al. (14), and they found that platelets and platelet-sized spheres showed very similar diffusive behavior. Kumar and Graham (23,24) conducted 3D boundary integral simulations of suspensions of deformable objects and found that margination depended on size and rigidity. Vahidkhah et al. (25) also conducted 3D simulations examining the contribution of platelet diffusivity and drift velocity to margination in blood flow. There are many other additional notable research efforts on the topic of platelet migration (26–30).
Although the aim in the aforementioned experiments was to observe the platelet margination pheonomenon under the influence of RBCs, they failed to consider how platelet concentration distribution evolves over time, especially how fast margination comes to completion. Since blood is typically shaken after being drawn from human bodies, margination distance is valuable information for designing microfluidic devices. Also, the effect of hematocrit has not been studied carefully due to the resolution limit for small-sized channels, even though RBCs play a key role in platelet margination. Simulations have already provided answers to these questions, and they prompt us to revisit the experiments and compare the results to simulation results. In this work, we start with well-mixed blood and use fluorescence microscopy to measure the distribution of platelet-sized (2.15 μm diameter) microspheres in blood flowing through an in vitro 30 μm capillary tube at different distances downstream and to investigate the effect of varying hematocrits. We demonstrate that the spheres marginate to the walls, as expected, and the rate of margination is in agreement with the predictions of Zhao et al. (22). Furthermore, these microspheres marginate closer to the wall at higher hematocrits, which was seen previously only in simulations. The experimental procedure, including blood preparation, experimental setup, and image analysis, is described in Materials and Methods. Two experiments are described. In the first, particle tracking is used to estimate wall shear rates. The second experiment uses the aforementioned results to apply a known experimental shear rate and then measures the distribution of 2.15 μm spherical particles in blood. This is followed by the Results section, and the article concludes with a short analysis of our findings.
Materials and Methods
Experiment
Blood preparation
Whole blood with anticoagulant heparin was first obtained from the Stanford Blood Center (Menlo Park, CA). The blood was centrifuged at 5000 × g for 5 min (Microfuge 18, Beckman Coulter, Krefeld, Germany), separating blood into plasma, buffy coat, and RBCs. Using pipettes, the plasma and RBCs were recombined in known concentrations, and a solution of distilled water and fluorescent polystyrene particles was added. The final solutions had hematocrits of 10%, 20%, or 30%, as desired. Lipowsky et al. (31,32) found that 30 μm channels generally have a hematocrit of 16–20%, so 10% hematocrit is a low value, whereas 30% is very high. Distilled water comprised 40% of the solution, and the remainder was plasma. The polystyrene particles constituted 0.008% w/v (2.15 μm diameter, excitation 660 nm, emission 700 nm; Fluorescent Sky Blue particles, Spherotech, Lake Forest, IL).
Experimental setup
The experimental setup is shown in Fig. 1. The channel was prepared from rectangular capillary tubes (30 μm × 300 μm × 5 cm; VitroCom, Boonton, NJ). The capillary tubes bridged two glass slides, and reservoirs were epoxied onto each end. One reservoir was attached to a syringe and pressure gauge (200 series low-pressure diaphragm pressure gauge, Noshok, Cleveland, OH) and the other was open to the atmosphere. The capillary flow rate was controlled by varying the syringe pressure.
Figure 1.
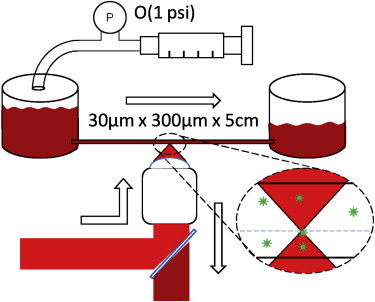
Experimental setup: when constant pressure is applied, blood is driven from one reservoir to another. The flow is approximately two-dimensional, with a 30 μm height. Slices of the channel are imaged, and in-focus particles are counted to build concentration profiles. To see this figure in color, go online.
An epifluorescent microscope (Eclipse TE300, Nikon, Tokyo, Japan) was used to image the flow chamber through a 60× oil objective (Nikon Plan Apo TIRF 60×/1.45 oil). The images were recorded with a charge-coupled device camera (Cascade 512B, Photometrics, Tucson, AZ) at 10 frames/s, and the system was illuminated with a red laser (660 nm; Stradus 660, Vortran, Sacramento, CA). To avoid significant particle streaking in the images, the laser was pulsed for 0.5 ms (velocity experiment) or 2 ms (particle distribution experiment) for each image. The camera exposure and laser pulse were synchronized using a pulse generator (Sapphire, Quantum Composers, Bozeman, MT) and in-house software built with libUSB and pySerial.
Image analysis
During each experiment, images were captured as 100 image tiff stacks. First, the background was extracted as the median of 100 images. The median was chosen as it was less sensitive to outliers such as fluorescing particles. If the mean was used, particle ghosts would have appeared in the background. The background served two purposes. First, for the shear-rate calibration experiments, the channel wall was identified using Canny edge detection followed by a Hough line transform. The particles flowed parallel to the channel wall, so identifying the wall gave extra orientation information for further particle processing. Second, the background was subtracted from each image to reduce the constant image noise. A sample background is shown in Fig. 2.
Figure 2.

Sample background extracted as the median of a 100 image tiff stack (10× objective). The channel walls are 300 μm apart and clearly visible. The bright spot at lower left is a particle stuck to the channel wall throughout the experiment, and the smudges are small dust particles outside the channel.
After removing the background, the images were run through a Fourier band-pass filter. Both high and low wavelengths were removed during this step. The removal of low frequencies reduced both the remaining wall signal and blurred particles, whereas removal of high frequencies reduced general noise. Next, a binary threshold was applied to the image, and candidate particles were identified. Finally, the possible particle locations in the prethreshold image were compared to a Gaussian to decide whether or not each identified region was a particle. A schematic of the general image analysis process is shown in Fig. 3.
Figure 3.
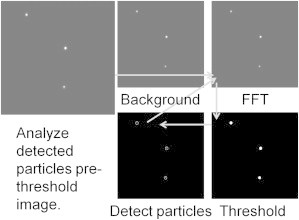
Image analysis procedure. Clockwise from upper left, the background is removed, the image is Fourier filtered, a binary threshold is applied, and particles are tentatively identified. Using the background-removed image, the tentative particle positions are compared to Gaussian functions to decide which regions are true particles.
Shear-rate calibration
The channel was first flushed with hexane for 1 min to minimize air bubble formation and reduce nonspecific adhesion along the channel wall. Next, blood was forced through the channel at a known pressure. For this series of experiments, depth resolution was less important, so a 10× objective (Nikon Plan Fluor 10×) was used to increase the field of view. The focal plane was set at approximately the channel center, but all particles (including out-of-focus particles) were clearly visible and readily localized. For each image, the camera exposure time was set at 100 ms. The laser only illuminated the channel for a fraction of that time. At t = 0, the laser was turned on for 0.5 ms, and the laser was turned on again at t = Δt for 0.5 ms. The time interval, , was set to 5 ms, 10 ms, or 20 ms, depending on the Ht and pressure drop. Thus, discounting edge cases and immobile (wall adsorbed) particles, each particle appeared twice per image, once at the beginning of the exposure, and once after time .
An unprocessed sample image is shown in Fig. 4, along with the results of image processing. Most particles appear as pairs, but two particles (top left and bottom left) did not move during the exposure. These particles were most likely attached to the channel walls. After processing the particles and identifying tentative particle locations, a pair probability matrix was formed. Particle images were more likely to be paired if their vector separation was parallel to the channel wall and the particle images were closer together. The particles were paired by extracting the matrix maxima, and the particle velocities were calculated as the separation distance over .
Figure 4.
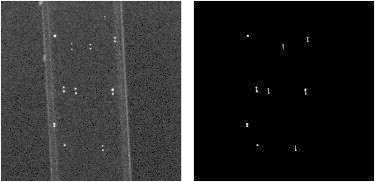
An unprocessed shear-rate calibration image is shown at left, with the processed form at right. There are two images for each exposure, so particle velocity is directly related to the particle image separation. Correct particle pairing for most of the images is shown at right. The two particles without pairs were stuck on the channel wall.
As can be seen in Fig. 4, many of the particles were correctly paired, although two particle pairs were missed at the top. These particles were dimmer as a result of uneven laser illumination, and the thresholding step removed them from the image. False particle matches (none in Fig. 4) accounted for ∼3% of total matches, but the affect of false matches was mitigated by removing the fastest and slowest particles from further data processing (fastest 10% and slowest 5%). In general, the false matches predicted very fast particles, whereas very slow particles were sometimes difficult to distinguish from adsorbed particles.
Particle distribution
Once again, the channels were first flushed with hexane for 1 min to avoid air bubbles and reduce wall adhesion. Using information from the shear calibration experiments, a constant pressure was applied to create a wall shear rate of 1000 s−1. For this experiment, focal depth was critical, so a 60× objective was used (estimated focal depth, ≈2 μm). Images of particles in focus and out of focus are shown in Fig. 5, which also shows that the current setup is capable of distinguishing an in focus particle from a particle out of focus by 2 μm. Thus, all particles above or below the focal plane by <2 μm were considered to be in focus.
Figure 5.

Particles in varying degrees of focus are shown, with Z representing the vertical distance between the particle and the focal plane. The focal depth was estimated to be 2 μm.
At the beginning of the experiment, the focal plane was placed at the bottom of the channel. One hundred images were taken, and the objective was raised by 2 μm, which raised the focal plane by ≈1.8 μm. Then, 100 more images were taken, and the process was repeated until half of the 30 μm channel had been imaged. The entire process was repeated three times at three different locations along the channel. Images were taken at 1, 2, and 3 cm from the inlet. Zhao et al. (22) predicted characteristic margination length scales of 2 cm and 1 cm for Ht = 10% and Ht = 20%, respectively, so the particle distributions were expected to show further margination at 2 cm and 3 cm. The experiment was repeated for blood solutions with Ht of 10%, 20%, and 30%.
Numerical methods
The 3D simulations solve boundary integral equations for Stokes flow (33).
| (1) |
| (2) |
where the single- and double-layer kernels N and K are defined as
| (3) |
| (4) |
and G and T are the fundamental Green’s function solutions for the Stokeslet and stresslet with periodic boundary conditions (34). The smooth particle mesh Ewald sum technique (35) is used to accelerate the simulation. The details of the simulation are identical to those in the Zhao study (22) unless specified otherwise, with the most notable difference being the replacement of discocyte-shaped platelets with rigid spheres that are spread uniformly in the initial distribution to more closely match the experimental conditions.
The simulation consists of a suspension of RBCs and rigid spheres. RBCs have a shear elasticity modeled by the Keller-Skalak law (36):
| (5) |
Here, the strain invariants and are defined in terms of the principal strains and as
| (6) |
and
| (7) |
The bending energy is computed by the edge bending formulation as used in Dao (37), Pozrikidis (20)
| (8) |
where is the RBC bending modulus, e represents an edge in the mesh, and is the dihedral angle formed between adjacent mesh triangles that share edge e.
Meshes for each RBC and for each rigid sphere have 1280 triangles. Using the value for RBC volume of V = 94 μm3 (21), we therefore nondimensionalize lengths by the equivalent radius of an RBC. In these nondimensional terms, the channel has height 10.6 (30 μm in dimensional units, the same height as in the experiment), periodic length 16 (45 μm), and periodic width 9 (25 μm). Spheres have diameter equivalent to 2.15 μm to match the xperiment. The nondimensional etimescale is determined by setting the plasma viscosity, , nondimensionalized to 1. The capillary number is set to make the characteristic wall shear rate , i.e., the value in experiments. The relationship between capillary number and wall shear rate varies slightly with hematocrit. For hematocrits of 10%, 20%, and 30%, a shear rate of is achieved at , respectively.
Results
Shear-rate calibration
Shear experiments were performed at Ht = 10%, 20%, and 30%. The observable quantity was particle velocity. During a single experiment, multiple particle velocities were measured, and a velocity histogram was formed. One example is shown in Fig. 6, along with the distribution for point particles in pressure-driven flow of a Newtonian fluid. As expected, there is some deviation from the parabolic flow-velocity profile. There are two physical reasons for the differences. First, blood is non-Newtonian, and its velocity profile is expected to be blunted compared to a parabola. (38,39). Second, the particles were not uniformly distributed throughout the channel when measured. These data were taken at approximately 0.6 cm from the channel inlet (as far upstream as possible), and reasonable margination was expected over this length scale.
Figure 6.
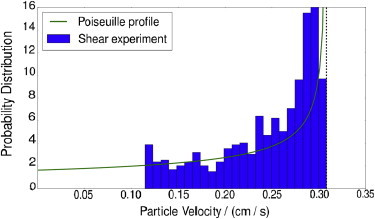
Particle velocity distribution (Ht = 10%, ΔP = 0.3 psi). The fastest particles (10%) and slowest particles (5%) were removed to reduce image processing errors. The Poiseuille profile was built by assuming two-dimensional parabolic flow with maximum velocity matched to the maximum observed particle velocity (vertical dotted line). To see this figure in color, go online.
Once the particle velocities were measured, the mean velocity was calculated. Since the slowest and fastest particles were removed, the mean was relatively insensitive to outliers. The experiment was repeated for several different Ht and , and the results are shown in Fig. 7. The 10% Ht and 20% Ht show similar pressure-velocity curves. However, at 30% Ht, significantly higher pressures were required to drive a given average velocity because of the increased effective viscosity. In all of our experiments, the 30% hematocrit case, which is very concentrated physiologically, showed qualitatively different behavior from the lower hematocrit cases.
Figure 7.
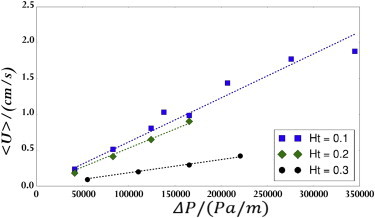
Average particle velocity at various Ht and driving pressure force. The data sets were fit with least-squares linear regressions. To see this figure in color, go online.
Fig. 7 gives an experimental correlation between pressure drop and average velocity, but wall shear rate is actually the quantity of interest here. To produce a correlation between average velocity and shear rate, large-scale numeric simulations, as described by Zhao et al. (22), were used. Fig. 8 shows the resulting correlation between velocity and shear rate. As expected based on its having the most significant bluntness in the velocity profile, the 30% Ht line is the steepest. By combining the results of Figs. 7 and 8, we found that pressure drops of 0.5 psi, 0.5 psi, and 1.2 psi, and capillary numbers of 0.41, 0.36, and 0.3 led to wall shear rates of 1000/s for Ht = 10%, 20%, and 30%, respectively.
Figure 8.
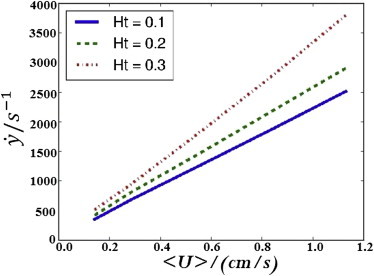
Simulation predictions for the relationship between average velocity and wall shear rate. To see this figure in color, go online.
Particle distribution
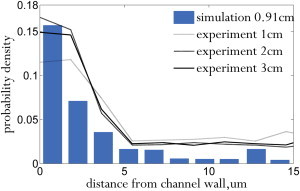
Zhao et al. (22) predicted that particles marginate over a length scale of , where is the diffusivity induced by RBC collisions. Using the diffusivities reported in Zhao et al. along with the experimental parameters, the margination length scale in our experiments should be 1.8 cm and 1.3 cm for 10% Ht and 20% Ht, respectively. The particle distributions measured from experiments (averaged over three runs) and compared to simulation are shown in Fig. 9 for 10% Ht (for 20% Ht, see Fig. 12). In this case, the particles marginated to the wall within 1 cm of the channel inlet. The distributions measured at 2 cm and 3 cm from the inlet show similar levels of margination, indicating that the measured margination length scale was comparable to that predicted by Zhao et al. (22) Due to the limitations of the experimental setup, we did not measure the particle distributions within 1 cm of the inlet. However, simulation shows that margination is completed at ∼1 cm. The corresponding simulation snapshots are shown in Figs. 10 and 11. Since we set a low error tolerance for the flow solver, the simulation took 45 days to evolve to 1.3 cm, and thus, we did not simulate margination to 2 cm and 3 cm from the inlet for a direct comparison to the experiment. However, since both experiment and simulation have apparently reached full margination at 1 cm, the particle distributions at 2 and 3 cm are expected to be similar.
Figure 9.

Distribution of 2-μm-diameter spherical particles in a 30 μm channel (Ht = 10%). To see this figure in color, go online.
Figure 12.
Distribution of 2-μm-diameter spherical particles in a 30 μm channel (Ht = 20%). To see this figure in color, go online.
Figure 10.

Snapshot of large-scale simulation used to estimate particle distribution at a distance of 0.01cm from the inlet (Ht = 10%, Ca = 0.41). To see this figure in color, go online.
Figure 11.
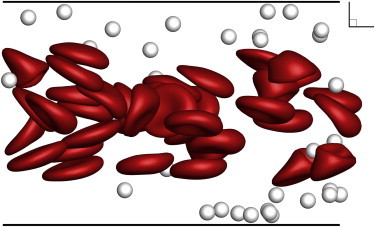
Snapshot of large-scale simulation used to estimate particle distribution at a distance of 1.3 cm from the inlet (Ht = 10%, Ca = 0.41). To see this figure in color, go online.
The results for 20% Ht (Fig. 12) are similar to the 10% Ht results. Once again, the particles marginated to the wall within 1 cm of the channel inlet, and no significant further margination occurred over the next 2 cm during the experiment. The simulation results (Figs. 13 and 14) show that full margination occurs by 0.8 cm, which is faster than for the 10% Ht case. Experimental results again match simulation. The cell-free layer was signifantly smaller at higher hematocrit, as expected from the results of Narsimhan et al. (40) Since the spheres marginated into the cell free layer, the concentration peak near the wall was larger for 20% Ht than for 10% Ht.
Figure 13.

Snapshot of large-scale simulation used to estimate particle distribution at a distance of 0.01cm from the inlet (Ht = 20%, Ca = 0.36). To see this figure in color, go online.
Figure 14.
Snapshot of large-scale simulation used to estimate particle distribution at a distance of 0.8 cm from the inlet (Ht = 20%, Ca = 0.36). To see this figure in color, go online.
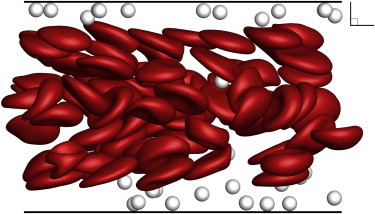
The experiments for 30% Ht (physiologically a very high hematocrit) were qualitatively different from the lower-hematocrit experiments. As explained before, a much higher pressure was required to drive the same shear rate (see Fig. 7), and the linear relationship between pressure drop and velocity was lost over the timescale of a margination experiment. As time passed, clots began to form along the channel walls, significantly altering the flow profile and making data analysis more difficult. Besides altering the position of the channel wall, the clots effectively created a yield stress, with low pressure drops leading to stagnant flow. To reduce clot formation, the pressure was periodically spiked to 5 psi, flushing partial clots. A sample run is shown in Fig. 15 along with simulation results at the same hematocrit. Although the simulation shows that full margination occurs as early as 0.6 cm (Fig. 15), the experiment does not show evidence of margination, in contrast to our experiments at 10% and 20% Ht. We might have lost some of the original anticoagulant after separation and remixing of blood. Although clotting could possibly be avoided by adding more anticoagulant, the experimental results are still valuable for showing the consequence of using higher-than-usual hematocrit, especially as a warning against using whole blood in capillary-sized channels.
Figure 15.
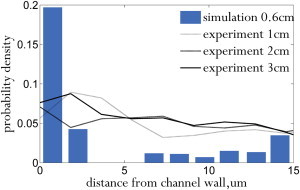
Distribution of 2-μm-diameter spherical particles in a 30 μm channel (Ht = 30%). To see this figure in color, go online.
Conclusions
Numerous authors have used simulations and theory to predict margination based on size and deformability of objects in a suspension of RBCs (14,16,22,25), particularly in the simple shear regime. We used fluorescence microscopy with particle tracking to experimentally measure the degree of margination of a suspension of RBCs and spheres in a 30 μm microchannel in pressure-driven flow. The conditions of these experiments were recreated in a 3D boundary integral simulation with deformable RBCs and rigid spheres.
Our experimental findings suggest that after 1 cm most spheres have marginated to a distance of within 5 μm of the wall in the 30 μm channel. The spheres remain closer to the wall at 20% RBC Ht than at 10% Ht. At 30% Ht, the effective viscosity of the suspension increases and clots form in the microchannel, making the experiment drastically different from those at lower hematocrit. Biologically, the expected hematocrit in a 30 μm vessel is 16–20% (31,32).
Our simulations allow a high-resolution examination of the margination process. Thus, we can examine the distance of individual spheres above the wall with more precision through simulation than through the coarse binning allowed by experiment. The simulations confirm that the degree of margination observed in the experiments is as expected.
Since the channel height is an order of magnitude larger than the radius of the RBCs, full margination requires O(1 cm). In actual blood vessels, we would expect numerous branches to occur over this length, having a significant effect on the flow, and therefore we have proven that branching plays a significant role in margination in the microcirculation. On the other hand, the margination distance we found in straight conduits is useful for guiding the design of biomedical devices and diagnostics. Once blood is drawn and gently shaken to prevent sedimentation, it takes 1 cm for platelets in straight bound flow to reestablish the margination profile.
Author Contributions
S.F. designed the experimental setup, conducted experiments, and performed image analysis. A.P.S. worked on the boundary integral method simulation code. Q.M.Q. assisted S.F. with collecting experimental data, ran simulations, and compared experimental and simulation results. E.S.G.S. is the principal investigator.
Acknowledgments
The authors acknowledge support from the U.S. Army High Performance Computing Research Center (AHPCRC), and support from Stanford University’s Certainty computer cluster, which is funded by the American Recovery and Reinvestment Act (ARRA) of 2009 (grant number: W911NF07200271). The authors also acknowledge National Science Foundation funding under CBET 1066263. Q.M.Q. is supported by Stanford Graduate Fellows in Science and Engineering (SGF).
References
- 1.Aarts P.A., van den Broek S.A., Heethaar R.M. Blood platelets are concentrated near the wall and red blood cells, in the center in flowing blood. Arteriosclerosis. 1988;8:819–824. doi: 10.1161/01.atv.8.6.819. [DOI] [PubMed] [Google Scholar]
- 2.Ni H., Freedman J. Platelets in hemostasis and thrombosis: role of integrins and their ligands. Transfus. Apheresis Sci. 2003;28:257–264. doi: 10.1016/S1473-0502(03)00044-2. [DOI] [PubMed] [Google Scholar]
- 3.Tomokiyo K., Kamikubo Y., Moroi M. Von Willebrand factor accelerates platelet adhesion and thrombus formation on a collagen surface in plateletreduced blood under flow conditions. Blood. 2005;105:1078–1084. doi: 10.1182/blood-2004-05-1827. [DOI] [PubMed] [Google Scholar]
- 4.Chen J., López J.A. Interactions of platelets with subendothelium and endothelium. Microcirculation. 2005;12:235–246. doi: 10.1080/10739680590925484. [DOI] [PubMed] [Google Scholar]
- 5.Valeri C.R., Cassidy G., Loscalzo J. Anemia-induced increase in the bleeding time: implications for treatment of nonsurgical blood loss. Transfusion. 2001;41:977–983. doi: 10.1046/j.1537-2995.2001.41080977.x. [DOI] [PubMed] [Google Scholar]
- 6.Fahreus R., Lindqvist T. The viscosity of the blood in narrow capillary tubes. Am. J. Physiol. 1931;96:562–568. [Google Scholar]
- 7.Bishop J.J., Popel A.S., Johnson P.C. Effects of erythrocyte aggregation and venous network geometry on red blood cell axial migration. Am. J. Physiol. Heart Circ. Physiol. 2001;281:H939–H950. doi: 10.1152/ajpheart.2001.281.2.H939. [DOI] [PubMed] [Google Scholar]
- 8.Tateishi N., Suzuki Y., Maeda N. Flow dynamics of erythrocytes in microvessels of isolated rabbit mesentery: cell-free layer and flow resistance. J. Biomech. 1994;27:1119–1125. doi: 10.1016/0021-9290(94)90052-3. [DOI] [PubMed] [Google Scholar]
- 9.Goldsmith H.L., Marlow J.C. Flow behavior of erythrocytes. II: Particle motions in concentrated suspensions of ghost cells. J. Colloid Interface Sci. 1979;71:383–407. [Google Scholar]
- 10.Gaehtgens P., Dührssen C., Albrecht K.H. Motion, deformation, and interaction of blood cells and plasma during flow through narrow capillary tubes. Blood Cells. 1980;6:799–817. [PubMed] [Google Scholar]
- 11.Suzuki Y., Tateishi N., Maeda N. Flow behavior of erythrocytes in microvessels and glass capillaries: effects of erythrocyte deformation and erythrocyte aggregation. Int. J. Microcirc. Clin. Exp. 1996;16:187–194. doi: 10.1159/000179172. [DOI] [PubMed] [Google Scholar]
- 12.Tangelder G.J., Teirlinck H.C., Reneman R.S. Distribution of blood platelets flowing in arterioles. Am. J. Physiol. 1985;248:H318–H323. doi: 10.1152/ajpheart.1985.248.3.H318. [DOI] [PubMed] [Google Scholar]
- 13.Woldhuis B., Tangelder G.J., Reneman R.S. Concentration profile of blood platelets differs in arterioles and venules. Am. J. Physiol. 1992;262:H1217–H1223. doi: 10.1152/ajpheart.1992.262.4.H1217. [DOI] [PubMed] [Google Scholar]
- 14.Eckstein E.C., Belgacem F. Model of platelet transport in flowing blood with drift and diffusion terms. Biophys. J. 1991;60:53–69. doi: 10.1016/S0006-3495(91)82030-6. [DOI] [PMC free article] [PubMed] [Google Scholar]
- 15.Yeh C., Eckstein E.C. Transient lateral transport of platelet-sized particles in flowing blood suspensions. Biophys. J. 1994;66:1706–1716. doi: 10.1016/S0006-3495(94)80962-2. [DOI] [PMC free article] [PubMed] [Google Scholar]
- 16.Tokarev A.A., Butylin A.A., Ataullakhanov F.I. Finite platelet size could be responsible for platelet margination effect. Biophys. J. 2011;101:1835–1843. doi: 10.1016/j.bpj.2011.08.031. [DOI] [PMC free article] [PubMed] [Google Scholar]
- 17.Zhao R., Kameneva M.V., Antaki J.F. Investigation of platelet margination phenomena at elevated shear stress. Biorheology. 2007;44:161–177. [PubMed] [Google Scholar]
- 18.Uijttewaal W.S.J., Nijhof E.-J., Heethaar R.M. Lateral migration of blood cells and microspheres in two-dimensional Poiseuille flow: a laser-Doppler study. J. Biomech. 1994;27:35–42. doi: 10.1016/0021-9290(94)90030-2. [DOI] [PubMed] [Google Scholar]
- 19.Xu C., Wootton D.M. Platelet near-wall excess in porcine whole blood in artery-sized tubes under steady and pulsatile flow conditions. Biorheology. 2004;41:113–125. [PubMed] [Google Scholar]
- 20.Pozrikidis C. Orbiting motion of a freely suspended spheroid near a plane wall. J. Fluid Mech. 2005;541:105–114. [Google Scholar]
- 21.Crowl L., Fogelson A.L. Analysis of mechanisms for platelet near-wall excess under arterial blood flow conditions. J. Fluid Mech. 2011;676:348–375. [Google Scholar]
- 22.Zhao H., Shaqfeh E.S.G., Narsimhan V. Shear-induced particle migration and margination in a cellular suspension. Phys. Fluids. 2012;24:011902. [Google Scholar]
- 23.Kumar A., Graham M.D. Accelerated boundary integral method for multiphase flow in non-periodic geometries. J. Comput. Phys. 2012;231:6682–6713. [Google Scholar]
- 24.Kumar A., Henríquez Rivera R.G., Graham M.D. Flow-induced segregation in confined multicomponent suspensions: effects of particle size and rigidity. J. Fluid Mech. 2014;738:423–462. [Google Scholar]
- 25.Vahidkhah K., Diamond S.L., Bagchi P. Platelet dynamics in three-dimensional simulation of whole blood. Biophys. J. 2014;106:2529–2540. doi: 10.1016/j.bpj.2014.04.028. [DOI] [PMC free article] [PubMed] [Google Scholar]
- 26.Doddi S.K., Bagchi P. Three-dimensional computational modeling of multiple deformable cells flowing in microvessels. Phys. Rev. E Stat. Nonlin. Soft Matter Phys. 2009;79:046318. doi: 10.1103/PhysRevE.79.046318. [DOI] [PubMed] [Google Scholar]
- 27.Freund J.B., Orescanin M.M. Cellular flow in a small blood vessel. J. Fluid Mech. 2011;671:466–490. [Google Scholar]
- 28.Freund J.B., Zhao H. A fast high-resolution boundary integral method for multiple interacting blood cells. In: Pozrikidis C., editor. Computational Hydrodynamics of Capsules and Biological Cells. Chapman Hall/CRC; Boca Raton, FL: 2010. pp. 71–111. [Google Scholar]
- 29.Lei H., Fedosov D.A., Karniadakis G.E. Blood flow in small tubes: quantifying the transition to the non-continuum regime. J. Fluid Mech. 2013;722:214–239. doi: 10.1017/jfm.2013.91. [DOI] [PMC free article] [PubMed] [Google Scholar]
- 30.Pivkin I., Richardson P., Karniadakis G.E. Effect of red blood cells on platelet aggregation. IEEE Eng. Med. Biol. Mag. 2009;28:32–37. doi: 10.1109/MEMB.2009.931788. [DOI] [PubMed] [Google Scholar]
- 31.Lipowsky H.H., Kovalcheck S., Zweifach B.W. The distribution of blood rheological parameters in the microvasculature of cat mesentery. Circ. Res. 1978;43:738–749. doi: 10.1161/01.res.43.5.738. [DOI] [PubMed] [Google Scholar]
- 32.Lipowsky H.H., Usami S., Chien S. In vivo measurements of “apparent viscosity” and microvessel hematocrit in the mesentery of the cat. Microvasc. Res. 1980;19:297–319. doi: 10.1016/0026-2862(80)90050-3. [DOI] [PubMed] [Google Scholar]
- 33.Pozrikidis C. Cambridge University Press; Cambridge, United Kingdom: 1992. Boundary Integral and Singularity Methods for Linearized Viscous Flow. [Google Scholar]
- 34.Hasimoto H. On the periodic fundamental solutions of the Stokes equations and their application to viscous flow past a cubic array of spheres. J. Fluid Mech. 1959;5:317–328. [Google Scholar]
- 35.Saintillan D., Darve E., Shaqfeh E.S.G. A smooth particle-mesh Ewald algorithm for Stokes suspension simulations: the sedimentation of fibers. Phys. Fluids. 2005;7:033301. [Google Scholar]
- 36.Skalak R., Ozkaya N., Skalak T.C. Biofluid mechanics. Annu. Rev. Fluid Mech. 1989;21:167–200. [Google Scholar]
- 37.Li J., Dao M., Suresh S. Spectrin-level modeling of the cytoskeleton and optical tweezers stretching of the erythrocyte. Biophys. J. 2005;88:3707–3719. doi: 10.1529/biophysj.104.047332. [DOI] [PMC free article] [PubMed] [Google Scholar]
- 38.Nakano A., Sugii Y., Niimi H. Measurement of red cell velocity in microvessels using particle image velocimetry (PIV) Clin. Hemorheol. Microcirc. 2003;29:445–455. [PubMed] [Google Scholar]
- 39.Tangelder G.J., Slaaf D.W., Reneman R.S. Velocity profiles of blood platelets and red blood cells flowing in arterioles of the rabbit mesentery. Circ. Res. 1986;59:505–514. doi: 10.1161/01.res.59.5.505. [DOI] [PubMed] [Google Scholar]
- 40.Narsimhan V., Zhao H., Shaqfeh E.S.G. Coarse-grained theory to predict the concentration distribution of red blood cells in wall-bounded Couette flow at zero Reynolds number. Phys. Fluids. 2013;25:061901. [Google Scholar]