

Abstract
Plant cell growth depends on a delicate balance between an inner drive—the hydrostatic pressure known as turgor—and an outer restraint—the polymeric wall that surrounds a cell. The classical technique to measure turgor in a single cell, the pressure probe, is intrusive and cannot be applied to small cells. In order to overcome these limitations, we developed a method that combines quantification of topography, nanoindentation force measurements, and an interpretation using a published mechanical model for the pointlike loading of thin elastic shells. We used atomic force microscopy to estimate the elastic properties of the cell wall and turgor pressure from a single force-depth curve. We applied this method to onion epidermal peels and quantified the response to changes in osmolality of the bathing solution. Overall our approach is accessible and enables a straightforward estimation of the hydrostatic pressure inside a walled cell.
Introduction
Freshly cut flowers retain their shapes, being in a state known as turgid. These flowers wilt when the hydrostatic pressure drops inside cells, reaching a flaccid state. Plant tissues can be roughly described as an ensemble of glued balloons filled with a concentrated aqueous solution. The envelopes of the balloons stand for the cell walls, which are mostly made of cross-linked polysaccharides composed of cellulose, hemicelluloses, and pectins, in addition to structural proteins and glycoproteins; cell wall thickness is typically between 1/100th and 1/10th of cell width (1). The difference in solute concentration between the cytoplasm and the outside of the cell membrane generates a hydrostatic pressure, also known as turgor pressure, that puts cell walls in tension (2). This tension is required for cell expansion and is important for the shape and function of plant cells (except when secondary cell walls have formed, such as in wood). Such internal hydrostatic pressure also appears important in the animal kingdom, for instance in the rounding of cells entering mitosis (3). In plants, because of the stiff cell wall surrounding the plasma membrane, as in other walled cells such as bacteria or fungi, hydrostatic pressure has values of the order of the atmospheric pressure, reaching as high as 20 bars. Many methods have been developed to quantify turgor pressure in plant tissues (2,4), but only one of these methods enables direct measurements at cell resolution. In its modern version, the pressure probe involve piercing the cell wall with a micropipette filled with oil and measuring the pressure needed to maintain the interface between oil and cell contents at approximately its initial position (5,6); this method is effective but intrusive, and is limited to large cells (>20 μm in diameter) because thin pipettes get clogged. Therefore, it is crucial to develop novel approaches that are not destructive and are applicable to smaller cells, such as in stomata or in tissues that harbor stem cells.
Because turgor pressure contributes to tissue stiffness, it is clear that the stiffness of a cell informs on its internal pressure (see, e.g., Arnoldi et al. (7) for bacteria and Durand-Smet et al. (8) for cultured plant cells). This idea was applied to plant cells, by exerting a force with a probe and measuring the contact area between the probe and the cell; the ratio of force to area directly yields a value of pressure (9–11), provided that the reaction force from the cell wall can be neglected. A major requirement of this approach is the optical measurement of the contact area, which is achievable only in specific cases. A step forward has been achieved by the use of micro- and nanoindentation systems (12–16) (see Routier-Kierzkowska et al. (17) and Milani et al. (18) for reviews), such as with atomic force microscopy (AFM), wherein a small probe exerts a force and the displacement is measured (or the reverse). When combined with the numerical simulations of the equations of continuum mechanics (e.g., with the finite-element method) using observed cell geometries (19–21), such nanoindentation approaches enable the deduction of turgor pressure. Because such numerical simulation needs to be repeated for each cell geometry, Vella et al. (22,23) sought analytical, explicit solutions of the equations of thin shells that could allow the deduction of the turgor from indentation curves and from the Young’s modulus of the cell wall and its thickness. Here we validate this approach experimentally and we extend it; we show how to estimate the elastic modulus of the cell wall and turgor pressure from a single force-displacement curve and the analytical forms obtained in Vella et al. (23), knowing the approximate thickness of the cell wall. We apply this approach to the epidermis of onion leaves, a good model system for plant morphogenesis and biophysics (9,10,16,24–30), and more importantly a system in which turgor pressure was measured using the pressure probe (9,10,27,28). Our approach is versatile and can be readily used to estimate turgor pressure without resorting to numerical simulations. We illustrate it by investigating the response of onion cells to changes in the osmolality of the external bath.
Materials and Methods
Sample preparation
We purchased white onion (Allium cepa L.) bulbs from a local market. Monolayers of epidermal cells are obtained by peeling scales (leaves) with tweezers, starting from the external part of a cut. We used the adaxial (inner) side of third leaves of bulbs. In each experiment, a roughly rectangular centimetric peel was placed into a Petri dish with the external cell wall (that has not been directly affected by peeling) facing the AFM; the peel was immobilized using pieces of adhesive tape placed along each of its sides. The Petri dish was filled with water or with an aqueous solution, so that the sample was kept moist (Fig. 1 a).
Figure 1.

Atomic force microscopy on onion epidermal peels. (a) Schematic of the setup (not to scale). (b) Top view of the onion epidermis and the AFM cantilever; cells are typically elongated (here their axes are roughly parallel to the cantilever). (c) Example of topographic (height) image (150 × 150 μm scan size); each of the two crests corresponds to the long axis of a cell (approximate height = 10 μm). (d) Typical force-depth curves—extension (blue) and retraction (red)—obtained on a cell. To see this figure in color, go online.
Atomic force microscopy
We used a Catalyst model AFM (Bruker, Santa Barbara, CA), coupled with an upright optical macroscope (Leica, Wetzlar, Germany) (31), which enables the positioning of the cantilever above the tissue (Fig. 1 b). All experiments were performed in liquid using a contact mode. We employed cantilevers with a nominal spring constant of 42 N/m and a tip height in the range 10–15 μm with a spherical end of radius of 0.4 μm (SD-Sphere-NCH-S-10; Nanosensors, Neuchatel, Switzerland). Such value of the spring constant was well suited for our measurements, except for flaccid peels for which cell stiffness was relatively small, leading to less precision in measurements. The spring constants were calibrated using 1) a TI 950 Triboindenter (Hysitron, Eden Prairie, MN) and were found to be in agreement (∼10%) with the nominal value, and 2) a calibration structure (FS-C 50; SiMetrics, Limbach-Oberfrohna, Germany) and were also found in agreement with the nominal value (within 5%: 40.57 ± 1.68 N/m). The AFM cantilever tip was imaged using scanning electron microscopy and the radius corresponded to the nominal value (5% error). Deflection sensitivity was calibrated daily, before and after each series of experiments; experiments were discarded a few times, when deflection sensitivity had drifted. The cantilever tip was optically placed at the center of each cell of interest, using the upright microscope. We used the POINT-AND-SHOOT feature of the Bruker software, which allowed us to obtain a topographic image (Fig. 1 c) of size 15 × 15 μm2 or 30 × 30 μm2 (or sometimes wider) and then select points to indent on the scanned area. At least five different locations were probed on each cell. These locations were chosen close to the cell axis to ensure a small slope and exert a force normal to the surface, avoiding potential biases arising when indentation is not perpendicular to the surface (16). The maximum force applied on cells was ∼10 μN, corresponding to a maximum indentation depth in the approximate range 1 μm (turgid cells) to 8 μm (flaccid cells); an example of an extension and a retraction curve is shown in Fig. 1 c. A repetition of three successive indentations was performed at each location, and the force-depth curves were found to be perfectly reproducible at a given location. Thus, 15–27 force curves were generated for each cell. The ramp velocity was 10 μm/s for both approach and retraction. We varied the ramp velocity (5, 10, and 20 μm/s) and did not find any substantial effect on the curves. All scans and ramps on a given cell took ∼5 min.
Osmotic treatments
A range of NaCl and sorbitol solutions were prepared, with an osmolarity spanning 0–0.6 osM (0–0.3 M for NaCl solutions and 0–0.6 M for sorbitol solutions). Before each change of bath, the dish was rinsed once with the new solution: the previous solution was removed with a pipette, the new solution was added, and then it was removed. We waited 5–10 min after having changed the bath before starting the measurements so that the solution could penetrate the peel. When 10 cells were followed across the range of solutions, measurements in each bath took ∼1 h because 5 min were spent for each cell. We probed cells in the same order to ensure that a given cell had spent a similar time in each solution.
Theoretical basis of pressure estimation
We use the theoretical model of Vella et al. (23) for an inflated shell. This model relies on the hypotheses that the cell wall can be considered as a thin shell, that indentation depth is smaller than (or comparable to) wall thickness (as found in numerical simulations (23)), and that the cell surface can be approximated by an ellipsoid over a height corresponding to the indentation depth. If these hypotheses are not verified, then a more realistic model such as in Hayot et al. (15) and Routier-Kierzkowska et al. (16) is needed. These three hypotheses hold in our experiments (for details, see below).
The force-depth is then predicted to be linear, the slope yielding the apparent stiffness of the shell, k. This stiffness is related to internal pressure P to the shell thickness t to the elastic modulus of the shell E, and to the local Gaussian κG and mean κM curvatures of the shell at the indentation point by the following equation:
| (1) |
with
Therefore, the deduction of P requires the measurement of the apparent stiffness of the cell, of the elastic modulus of the cell wall and its thickness, and of the local topography of the cell. A schematic of our measurement strategy is visible in Fig. 2. Once these parameters are known, the implicit Eq. 1 can be numerically solved (see PYTHON script (https://www.python.org) in the Supporting Material).
Figure 2.

Schematics of the methodology to infer pressure: The topographic (height) image yields the local mean, κM, and Gaussian, κG, curvatures at the indentation point; the cell wall modulus, E, and the cell stiffness, k, are deduced from force-depth curves. Together with an independent measurement of wall thickness, t, these data enable the estimation of cell hydrostatic pressure, P. To see this figure in color, go online.
Cell wall thickness
In order to determine cell wall thickness, we imaged fine sections of onion scales using transmission electron microscopy (performed at Centre Technologique des Microstructures, Université Claude Bernard Lyon 1; same protocol as Sieber et al. (32)). Seventeen different regions in the abaxial side of third leaves were observed (Fig. S1 in the Supporting Material). We found the thickness of the external cell wall to be roughly constant, with a value of t = 1.62 ± 0.36 μm. This value of thickness is ∼3/100th of cell width.
Cell wall elastic modulus
The model presented above (Eq. 1) is valid as long as the cell wall can be considered as a thin shell, which does not hold at smaller depths where the size of the cell wall region perturbed by the pyramidal tip is smaller than thickness. In this small depth regime, the force-depth curves are mostly sensitive to the mechanical properties of the cell wall (13). We followed the methodology of Milani et al. (13) to deduce a local value of the cell wall elastic modulus. We used force measurements at indentation depths <300 nm (see justification below). Because this depth is much smaller than the cell wall thickness, such measurements are expected to be mostly sensitive to the local cell wall elastic modulus. We considered only the approach curve to avoid the effect of adhesion between the cantilever tip and the sample, and we fitted the curve (up to 300-nm depth) with the Hertz model (33),
| (2) |
where F is the applied force; δ is the corresponding indentation depth; E and ν are the Young’s modulus and the Poisson’s ratio (ν = 0.5 in practice), respectively; and R = 0.4 μm is the radius of our AFM cantilever tip (see typical fit in Fig. 3 a). The Hertz fit of the force-displacement curves was obtained using the NANOSCOPE ANALYSIS software (Bruker). Almost all the fits had a coefficient of determination R2 > 0.99.
Figure 3.

Extraction of mechanical and geometrical parameters from AFM data. (a) Fits of one typical AFM curve (blue) using a linear fit on the upper part of the curve (red line, 75–100% of maximal force) and a Hertz fit on the bottom part of the curve (green curve, corresponding indentation depth ≤300 nm). (b) Typical surface height measured by AFM (yellow) and its corresponding polynomial fit (blue), which is used to compute curvatures. To see this figure in color, go online.
The Hertz model assumes isotropy of the material, whereas the cell wall is anisotropic, and so should be considered as an orthotropic material with three moduli and three shear moduli. For instance, it has been shown that the onion epidermis is not isotropic (26). As discussed in Milani et al. (13), the modulus that we deduce here is likely to be closer to the smallest modulus, i.e., the modulus in the direction perpendicular to the cell wall. We note, however, that the estimation of pressure is rather insensitive to the values of Young’s modulus and of Poisson’s ratio (for instance, changes of 20% in the value of modulus induce changes of 3% in the estimation of pressure). Likewise, inhomogeneity of cell wall mechanics would not affect the estimation of pressure. Finally, the estimation of pressure does not change if the values of modulus obtained from the retraction curve are used instead of those from approaching curves. Values of the modulus obtained using the retraction curve and a fit that accounts for adhesion (a constant shift in force to Eq. 2) are provided in Figs. S2 and S3.
Apparent stiffness
The value of the apparent stiffness is obtained from the slope of the linear part of the force-depth curve. In practice, we used data with a force ranging from 75% to 100% of the maximal force (see Fig. 3 a). The fit was obtained using the NANOSCOPE ANALYSIS software (Bruker). Almost all the fits had a coefficient of determination R2 > 0.99. In order to remove viscouslike behavior (see Results and Discussion), we defined the stiffness, k, as the average of the extension slope and the retraction slope. These slopes are shown in Figs. S2 and S3.
Curvatures
AFM measurement gives access to the height of the surface z(x,y) as a function of the coordinates x and y of the two-dimensional scan. Measured topography is convoluted with tip shape, which roughly corresponds to smoothing the topography on a scale smaller than 1 μm; this smoothing does not affect the measurements of curvatures because the radii are always >20 μm. To calculate the curvatures of the surfaces, we used a polynomial fit of the surface (Fig. 3 b) over regions of size 15 × 15 μm2 or 30 × 30 μm2 (which were smaller than cell width) according to scan size. We performed fits to second-order polynomials of the form z(x,y) = ax2 + by2 + cxy + dx + ey + f via the method of least-squares; the coefficient of determination R2 was always >0.995. A typical fit is displayed in Fig. 3 b. The mean (κM) and Gaussian (κG) curvatures are computed from the partial derivatives of z as
| (3) |
where we used the notation . The corresponding PYTHON script (https://www.python.org/psf/) is provided in the Supporting Material.
Range of applicability of the models
The Hertz model (Eq. 2) is applicable if the two following conditions are satisfied: 1) The cell wall is significantly thicker than the diameter of contact region, i.e., t ≫ 2(Rδ)1/2, with R being the radius of the cantilever tip and δ the indentation depth. This condition is equivalent to δ ≪ t2/R/4 = 1.6 μm for our experiments. 2) The Hertz contact has a smaller stiffness than the inflated shell, i.e., dF/dδ ≪ k, because the system behaves as a nonlinear spring (Hertz contact) and a linear spring (inflated shell) in series, and so the equivalent stiffness is determined by the softest spring. This condition is equivalent to δ ≪ 9/64 k2/E2 ∼ 3 μm for our experiments. Here, the first condition is more restrictive. In practice, we found that fitting the Hertz model for δ < 300 nm yielded good fits, although we also used 100 nm as a bound to verify our results.
The inflated shell model (Eq. 1) is valid for indentation depths greater than the range of validity of the Hertz model and smaller than a value of the order of shell thickness. In practice, we found force-depth curves to be approximately linear for depths δ > 0.5 μm up to the maximal force used, suggesting the applicability of the model in this range. In addition, this model requires an approximation of cell shape by an ellipsoid over a region corresponding to the deformed region, the width of which can be estimated as 2(2δ/κM)1/2, κM being the mean curvature, which is typically 20 μm in our experiments. In practice, we used either 15 or 30 μm for this size.
Results and Discussion
Hydrostatic pressure of onion epidermis cells in water
Extracting hydrostatic pressure
Because the onion epidermis is a good model system for plant biophysics (9,10,16,24–30) and pressure probe measurements are available (9,10,27–29), we performed experiments on onion epidermal peels that consist of cell monolayers. The peels were immobilized at the bottom of a Petri dish and immersed in water to keep them moist. An AFM allowed us to scan the topography of the cells (Fig. 1 c) and perform local indentation to obtain force-depth curves (Fig. 1 d). Successive force-depth curves obtained at the same location were superimposed, indicating that no irreversible deformations occurred. Accordingly, we did not observe discontinuities in the slope of force-displacement curves, which would indicate material failure (34). Extension and retraction curves differed, showing a viscouslike behavior. Finally, only small negative forces were observed at the end of retraction, suggesting negligible adhesion of the cantilever tip to the top wall.
We first checked that cell stiffness is mostly sensitive to turgor pressure, by comparing the turgid and the flaccid state of a given cell. To do so we probed one cell, gently punctured it at a distance from the measurement point using a thin needle, and then probed the cell again at the same point. The slope of the force-depth curve decreased significantly (Fig. 4 a), demonstrating that the slope is mostly sensitive to turgor pressure (16). We then based our approach on the theoretical results of Vella et al. (23): The force-depth curve on a highly pressurized elastic shell is linear and its slope is primarily determined by the inner pressure and the local curvatures at the indentation point, and secondarily by the elastic modulus and the thickness of the shell (see Eq. 1). In practice (for details, see Materials and Methods), we computed the mean and Gaussian curvatures from the height profile obtained from local topographic AFM scans. We measured cell wall thickness using transmission electron microscopy. We deduced the elastic modulus from the 0–300-nm range of force-depth curves (13). Finally, we determined the slope from the upper part of force-depth curves; because the extension and retraction slopes differed by having no visible plasticity, indicating a viscouslike behavior, we reasoned that adding the two slopes would remove the viscous component due to the change in sign of the velocity between extension and retraction; therefore, we considered the apparent stiffness to be given by the average of these two slopes.
Figure 4.

Estimation of turgor pressure. (a) Example of AFM extension force-depth curves obtained on a cell, when turgid (blue) and when deflated (red) after puncture. (b) Pressure values obtained in 41 specific cells (blue crosses) from seven different peels. (Red) Mean value of each peel and its associated standard deviation. To see this figure in color, go online.
Discussion of the values of pressure
In the following we analyze all data obtained in ultrapure water, i.e., 41 onion epidermal cells from seven different peels (corresponding to seven different days) and five different onion bulbs. All values of pressure per cell are shown on Fig. 4 b, where cells are grouped by peel. The value of pressure in a given cell was computed from the average of 5–9 measurement locations. The standard deviation of pressure in each cell was low (∼0.01 MPa), confirming that our interpretation of the experiments yields a cell-based feature. We also found that the prediction for pressure is quite insensitive to the values of modulus and thickness, allowing us to use a single value of thickness for all experiments and to neglect the mechanical anisotropy of the cell wall.
The mean pressure of all cells probed was 0.33 ± 0.10 MPa. This value is of the same order but lower than the values of ∼0.6 MPa found with the pressure probe (9,10,27,28) or of ∼1 MPa found using plasmolysis experiments (24). Because experiments with plasmolysis might induce osmoregulation (see below), it is likely that they overestimate the pressure. Similarly, it cannot be excluded that cell impalement by the pressure probe induces an active response. In our experiments, the values of pressure range from 0.2 to 0.6 MPa, a dispersion that is similar to that (0.2–1 MPa) reported with the pressure probe (28).
We observed an important variability from one peel to another (reflecting biological variability between samples) and less variability within one peel. It is considered by default that hydrostatic pressure is uniform within a tissue due to the plasmodesmata that connect neighboring plant cells (2). While differences in turgor between layers have been reported (35), differences in turgor pressure within the same cell layer have only been suggested to occur between stomata and other leaf epidermal cells (36), because their opening and closing involves changes in turgor. Interestingly, we noticed that puncturing one cell of the peel did not affect turgor in neighboring cells. Indeed, plasmodesmata gating can be induced by differences in turgor between neighboring cells in a trichome (a leaf hair) (37). Overall, our results suggest that, even within one peel, different cells may differ in turgor pressure (in particular, see cell No. 4 in sorbitol treatments hereafter).
Dependence of wall mechanics and pressure on bath osmolarity
Onion epidermis bathed in NaCl solutions
In order to demonstrate that we can detect pressure variations, we followed many cells in a given peel during a range of osmotic treatments. Ten cells were chosen in a field of ∼1 mm2 in the center of the peel. The osmolarity of the bath was increased from 0 to 0.3 M NaCl in 0.05 M steps in order to decrease the hydrostatic pressure of the cells. The 10 cells were probed in each bath.
Fig. 5 a shows the resulting changes in the force-depth curves with bath osmolarity for one cell. (A similar behavior was observed for the nine others.) Such curves reveal information about pressure, especially their slopes at high indentation depth. Apparent stiffness, k, is plotted for each cell in Fig. 5 b as a function of the bath osmotic pressure Π = MiRT, where M is the molarity of the bath solution, i is the Van ’t Hoff factor of the solute (i = 2 for NaCl), R is the gas constant, and T is the absolute temperature (294 K in our case). The value of k decreases when the bath osmotic pressure increases, except for some cells that experience slight increases at some steps. We also found that extracted elastic moduli depend on the osmotic pressure Π (Fig. 5 c), an observation that is discussed hereafter. The estimated hydrostatic pressure, P, decreased from 0.2 to 0.3 MPa to almost zero for the more concentrated baths.
Figure 5.
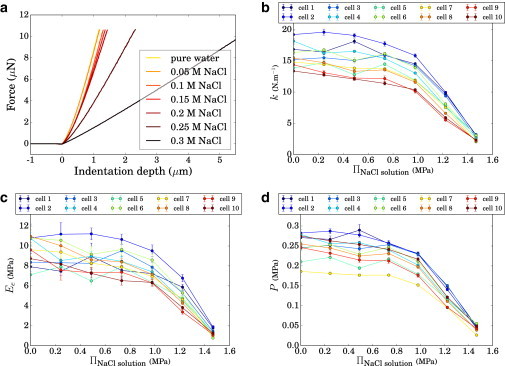
Measurements in NaCl solutions. Ten cells were followed as the bath osmotic pressure Π was increased. (a) AFM force-depth extension curves on one cell. (b) Apparent cell stiffness, k. (c) Young’s modulus values Ee deduced from the extension curves. (d) Estimated pressure, P. To see this figure in color, go online.
Influence of the nature of the osmolyte
Osmolytes can elicit cellular responses and may also affect the properties of the cell wall by influencing its water potential and the density of polysaccharides in the wall (38,39). Therefore, we performed the same experiments with sorbitol (Van ’t Hoff factor i = 1). We used seven solutions of sorbitol spanning the 0–0.6 M range (Fig. 6 a), which corresponds to the same range of osmotic pressures as in experiments with NaCl.
Figure 6.

Measurements in sorbitol solutions. Ten cells were followed as the bath osmotic pressure Π was increased up to 1.47 MPa, then kept overnight at 0 MPa (after which the cells were measured) and then increased back to 1.47 MPa. (a) AFM force-depth extension curves on one cell. (b) Apparent cell stiffness, k. (c) Young’s modulus values Ee deduced from the extension curves. (d) Estimated pressure, P. To see this figure in color, go online.
The slope of the force-depth curves and the elastic modulus decreased with increasing sorbitol concentration (Fig. 6, b and c). This decrease appears more moderate than with NaCl: The pressure decreased down to 0.2 MPa with sorbitol, whereas it dropped down to 0.05 MPa with NaCl. However, this difference is within the variability between experiments: In some experiments, the drop in pressure was larger than here, while in other experiments it was impossible to deflate cells. We cannot exclude differences between the effects of two different osmolytes; but if such differences exist, they are hidden by the biological variability between onion peels.
The particular behavior of cell No. 4 (depicted in light blue in Fig. 6) is worth noticing: it has a lower turgor, was a neighbor to cell No. 5, and had no specific features. This shows that cells can behave differently within the same peel and that we can detect such differences.
To test reversibility of the treatments, the peel was bathed again in ultrapure water overnight and then bathed in 0.6 M sorbitol during ∼90 min. The same 10 cells were probed and the results plotted on the right of each graph (the last two points corresponding to Π (bath) = 0 and 1.47 MPa indicated in red on the axis). These results show that most of the cells were able to reinflate overnight, reaching a pressure almost as high as on the first day, and were still responsive to a new osmotic treatment.
Influence of bath osmolarity on wall elastic modulus
Here with both NaCl and sorbitol, the deduced Young’s modulus value is influenced by the bath osmotic pressure: while rather constant at ∼10 MPa for diluted baths, it drops down to 1 MPa in the NaCl experiment for the most concentrated bath (Fig. 5 c). This drop is consistent with the raw force-depth curves, which differ in curvature at the contact point when the osmolyte concentration is varied (Figs. 5 a and 6 a). Observations are summarized in Fig. 7 a that show E versus P for the two sets of experiments, where these values were averaged over all cells probed except cell No. 4, which showed a different behavior in sorbitol. In this plot, the maximum value of P for each type of symbol corresponds to cells bathed in ultrapure water. The same trends are observed with the two osmolytes, although the modulus appears slightly higher with NaCl. Our values of Young’s modulus are comparable to those obtained on isolated onion epidermal cell walls in Xi et al. (30) that ranged from 5 to 20 MPa. They are also comparable to values obtained in studies using a similar approach on the shoot apex of Arabidopsis (12,13) or on cells in culture (14), ranging from 0.1 to 10 MPa. However, they are lower than values obtained on the epidermis of Arabidopsis leaves (15), possibly because these leaves are more exposed and fulfill a different function than onion inner scales.
Figure 7.

Summary of results with osmotic treatments (using data from Figs. 5 and 6). (a) Changes in deduced Young’s modulus E with turgor pressure, P. (Red) NaCl solutions, modulus averaged over 10 cells. (Dark blue) Sorbitol solutions, modulus averaged over nine cells (all cells from Fig. 6 except No. 4). (Light blue) Sorbitol experiment, cell No. 4. (Circles) Values obtained on the second day with sorbitol. (b) Changes in estimated turgor pressure, P, with bath osmotic pressure Π. Same colors and symbols as in (a). To see this figure in color, go online.
Different hypotheses could account for the observation that the modulus decreases with turgor:
Our methodology to deduce E could be sensitive to turgor because the depth of 300 nm used for the fits is not sufficiently smaller than wall thickness (∼1.6 μm) to warrant the applicability of the Hertz model. However, in the theoretical analysis of Hayot et al. (15) on the indentation of thick shells under pressure, it is reported that the perceived elastic modulus increases by <20% when the pressure is doubled for an indentation depth of ∼1/4 of thickness, whereas here we instead observe an increase of 100%. In addition, we reextracted elastic moduli by using depths <100 nm and found similar values of modulus (although more noisy because of the smaller number of points used for the fits). Therefore, it is more likely that this decrease in modulus with pressure reflects an intrinsic property of the cell wall.
The mechanical properties of the cell wall might depend on how the osmolyte influences the amount of water in the cell wall and consequently the density of polysaccharides in the cell wall. It would be tempting to ascribe the differences between the two osmolytes (Fig. 7 a) to such effect, but these differences are within the biological variability between samples. In addition, studies on the influence of osmolytes on isolated cell walls (38,39) conclude that the wall often becomes thinner and/or less extensible when bathed in osmolytes, suggesting that adding osmolytes would increase wall stiffness.
The cell wall modulus could increase with mechanical stress, and hence with pressure. Indeed, it has been reported that cell walls may behave as nonlinear elastic materials that are strain-hardening, in plants (40,41) and in bacteria (42). However, direct tensile tests on onion peels (10,25) did not show a strong nonlinear elastic behavior, although in our case it is likely that the value of modulus deduced is more sensitive to the modulus in the direction of wall thickness (13). Therefore, we cannot exclude other hypotheses that would account for the increase of modulus with hydrostatic pressure.
Pressure variations with bath osmolarity
If a cell is passive and is perfectly semipermeable (its membrane being only permeable to water), then hydrostatic pressure, P, and bath osmotic pressure, Π, are related through
| (4) |
with Πint being the osmotic pressure inside the cell. The predicted slope of −1 for P(Π) differs greatly from observations (Fig. 7 b): The slope varies between ∼0 and −1/3. In all experiments that we performed, the changes in hydrostatic pressure were always significantly less than expected for a perfect semipermeable bag experiencing external osmotic pressure changes. Interestingly, hydrostatic pressure varies nonlinearly with the osmotic pressure of the bath (Fig. 7 b). As a consequence, at least one of the two basic hypotheses required for Eq. 4 is not valid.
On the one hand, the barrier between the cytoplasm and the bath composed by the cell membrane and the cell wall could be imperfectly semipermeable. First, the permeability of the barrier to water could be reduced. It has already been noticed that under osmotic treatment the hydraulic conductivity can be reduced in roots and in leaves (e.g., Cramer (43) and Azaizeh et al. (44)). However, such reduction in permeability would only affect the hydraulic timescale and not the equilibrium hydrostatic pressure. Second, the effective difference in water potential related to the external solute could be multiplied by a factor σ ≤ 1 known as the reflection coefficient (45), so that the slope of P(Π) would be −σ. However, the reflection coefficient was found to be σ = 1 for mannitol (which has the same molecular size as sorbitol) used for Chara (46). We also note that our data with sorbitol seems farther from a semipermeable bag than with NaCl (Fig. 7), although this difference could also be ascribed to biological variability between peels. Third, solutes might move passively down their osmotic gradient in the absence of water movement. While plasma membranes are likely impermeable to sorbitol (46), Na+ can enter cells through nonselective cation channels (47). Overall, imperfect semipermeability could account for observations with NaCl, but is unlikely to apply to those with sorbitol.
On the other hand, the osmotic content of cells could be actively regulated. Such a response could involve elevating internal osmolality by the uptake of solutes that do not normally permeate through the plasma membrane or by the breakdown of sugars (or of polysaccharides); see, for instance, Beauzamy et al. (2). A few plant species possess sorbitol transporters (48), although this has not been documented for onion. More generally, active osmoregulation can be observed in many walled cells: in plants (49,50), in fission yeast (51), or in bacteria (52). Similarly, our results suggest that osmoregulation occurs, which does not exclude imperfect semipermeability in the case of NaCl.
Conclusions
Here, we introduced a methodology to quantify internal pressure and cell wall modulus at cell resolution using nanoindentation and an independent measurement of cell wall thickness (Fig. 2), combined with solving a simple equation. We retrieved values of hydrostatic pressure that are comparable to those obtained with other techniques, using onion as a model system. We further revealed the response of onion epidermal cells to osmotic treatments, which seems to involve osmoregulation.
This approach is applicable to the epidermal tissue of any plant organ that is flat enough to be imaged with atomic force microscopy, although this condition is not restrictive because the leaf, the shoot apex, and the root have been imaged with AFM (18). This method is nondestructive and nonintrusive, providing an alternative to the classic pressure probe and opening the possibility to follow a cell over time in a developing tissue.
Author Contributions
L.B. and A.B. designed research, discussed the results, and wrote the manuscript; L.B. performed experiments; and L.B. and J.D. performed data analysis.
Acknowledgments
We thank Mathieu Colombani and Yoël Forterre for demonstrating the pressure probe, Bruno Moulia for discussions about plasmolysis and osmoregulation in onion, Ludovic Bellon for discussions about the AFM calibration, and Vincent Mirabet for his help with curvature extraction from AFM topographic data.
This work was supported by the European Research Council (Starting Grant PhyMorph No. 307387 to A.B.).
Editor: Sean Sun.
Footnotes
This is an open access article under the CC BY-NC-ND license (http://creativecommons.org/licenses/by-nc-nd/4.0/).
Supporting Material
References
- 1.Niklas K.J. The University of Chicago Press; Chicago, IL: 1992. Plant Biomechanics, An Engineering Approach to Plant Form and Function. [Google Scholar]
- 2.Beauzamy L., Nakayama N., Boudaoud A. Flowers under pressure: ins and outs of turgor regulation in development. Ann. Bot. (Lond.) 2014;114:1517–1533. doi: 10.1093/aob/mcu187. [DOI] [PMC free article] [PubMed] [Google Scholar]
- 3.Stewart M.P., Helenius J., Hyman A.A. Hydrostatic pressure and the actomyosin cortex drive mitotic cell rounding. Nature. 2011;469:226–230. doi: 10.1038/nature09642. [DOI] [PubMed] [Google Scholar]
- 4.Geitmann A. Experimental approaches used to quantify physical parameters at cellular and subcellular levels. Am. J. Bot. 2006;93:1380–1390. doi: 10.3732/ajb.93.10.1380. [DOI] [PubMed] [Google Scholar]
- 5.Green P.B. Growth physics in Nitella: a method for continuous in vivo analysis of extensibility based on a micro-manometer technique for turgor pressure. Plant Physiol. 1968;43:1169–1184. doi: 10.1104/pp.43.8.1169. [DOI] [PMC free article] [PubMed] [Google Scholar]
- 6.Hüsken D., Steudle E., Zimmermann U. Pressure probe technique for measuring water relations of cells in higher plants. Plant Physiol. 1978;61:158–163. doi: 10.1104/pp.61.2.158. [DOI] [PMC free article] [PubMed] [Google Scholar]
- 7.Arnoldi M., Fritz M., Boulbitch A. Bacterial turgor pressure can be measured by atomic force microscopy. Phys. Rev. E Stat. Phys. Plasmas Fluids Relat. Interdiscip. Topics. 2000;62(1 Pt B):1034–1044. doi: 10.1103/physreve.62.1034. [DOI] [PubMed] [Google Scholar]
- 8.Durand-Smet P., Chastrette N., Asnacios A. A comparative mechanical analysis of plant and animal cells reveals convergence across kingdoms. Biophys. J. 2014;107:2237–2244. doi: 10.1016/j.bpj.2014.10.023. [DOI] [PMC free article] [PubMed] [Google Scholar]
- 9.Lintilhac P.M., Wei C., Outwater J.O. Ball tonometry: a rapid, nondestructive method for measuring cell turgor pressure in thin-walled plant cells. J. Plant Growth Regul. 2000;19:90–97. doi: 10.1007/s003440000009. [DOI] [PubMed] [Google Scholar]
- 10.Wei C., Lintilhac P.M., Tanguay J.J. An insight into cell elasticity and load-bearing ability. Measurement and theory. Plant Physiol. 2001;126:1129–1138. doi: 10.1104/pp.126.3.1129. [DOI] [PMC free article] [PubMed] [Google Scholar]
- 11.Wang L., Hukin D., Thomas C. Comparison of plant cell turgor pressure measurement by pressure probe and micromanipulation. Biotechnol. Lett. 2006;28:1147–1150. doi: 10.1007/s10529-006-9075-x. [DOI] [PubMed] [Google Scholar]
- 12.Peaucelle A., Braybrook S.A., Höfte H. Pectin-induced changes in cell wall mechanics underlie organ initiation in Arabidopsis. Curr. Biol. 2011;21:1720–1726. doi: 10.1016/j.cub.2011.08.057. [DOI] [PubMed] [Google Scholar]
- 13.Milani P., Gholamirad M., Hamant O. In vivo analysis of local wall stiffness at the shoot apical meristem in Arabidopsis using atomic force microscopy. Plant J. 2011;67:1116–1123. doi: 10.1111/j.1365-313X.2011.04649.x. [DOI] [PubMed] [Google Scholar]
- 14.Radotić K., Roduit C., Kasas S. Atomic force microscopy stiffness tomography on living Arabidopsis thaliana cells reveals the mechanical properties of surface and deep cell-wall layers during growth. Biophys. J. 2012;103:386–394. doi: 10.1016/j.bpj.2012.06.046. [DOI] [PMC free article] [PubMed] [Google Scholar]
- 15.Hayot C.M., Forouzesh E., Turner J.A. Viscoelastic properties of cell walls of single living plant cells determined by dynamic nanoindentation. J. Exp. Bot. 2012;63:2525–2540. doi: 10.1093/jxb/err428. [DOI] [PMC free article] [PubMed] [Google Scholar]
- 16.Routier-Kierzkowska A.-L., Weber A., Smith R.S. Cellular force microscopy for in vivo measurements of plant tissue mechanics. Plant Physiol. 2012;158:1514–1522. doi: 10.1104/pp.111.191460. [DOI] [PMC free article] [PubMed] [Google Scholar]
- 17.Routier-Kierzkowska A.-L., Smith R.S. Measuring the mechanics of morphogenesis. Curr. Opin. Plant Biol. 2013;16:25–32. doi: 10.1016/j.pbi.2012.11.002. [DOI] [PubMed] [Google Scholar]
- 18.Milani P., Braybrook S.A., Boudaoud A. Shrinking the hammer: micromechanical approaches to morphogenesis. J. Exp. Bot. 2013;64:4651–4662. doi: 10.1093/jxb/ert169. [DOI] [PubMed] [Google Scholar]
- 19.Forouzesh E., Goel A., Turner J.A. In vivo extraction of Arabidopsis cell turgor pressure using nanoindentation in conjunction with finite element modeling. Plant J. 2013;73:509–520. doi: 10.1111/tpj.12042. [DOI] [PubMed] [Google Scholar]
- 20.Vogler H., Draeger C., Grossniklaus U. The pollen tube: a soft shell with a hard core. Plant J. 2013;73:617–627. doi: 10.1111/tpj.12061. [DOI] [PubMed] [Google Scholar]
- 21.Weber A., Braybrook S., Smith R.S. Micro-indentation of plant cells: what are we measuring? J. Exp. Bot. 2015 doi: 10.1093/jxb/erv135. In press. [DOI] [PMC free article] [PubMed] [Google Scholar]
- 22.Vella D., Ajdari A., Boudaoud A. The indentation of pressurized elastic shells: from polymeric capsules to yeast cells. J. R. Soc. Interface. 2012;9:448–455. doi: 10.1098/rsif.2011.0352. [DOI] [PMC free article] [PubMed] [Google Scholar]
- 23.Vella D., Ajdari A., Boudaoud A. Indentation of ellipsoidal and cylindrical elastic shells. Phys. Rev. Lett. 2012;109:144302. doi: 10.1103/PhysRevLett.109.144302. [DOI] [PubMed] [Google Scholar]
- 24.Gerdenitsch W. Microscopic contributions to the pressure-volume diagram of the cell-water relations as demonstrated with tissue cells. Protoplasma. 1984;119:35–47. [Google Scholar]
- 25.Kerstens S., Decraemer W.F., Verbelen J.-P. Cell walls at the plant surface behave mechanically like fiber-reinforced composite materials. Plant Physiol. 2001;127:381–385. [PMC free article] [PubMed] [Google Scholar]
- 26.Suslov D., Verbelen J.-P., Vissenberg K. Onion epidermis as a new model to study the control of growth anisotropy in higher plants. J. Exp. Bot. 2009;60:4175–4187. doi: 10.1093/jxb/erp251. [DOI] [PubMed] [Google Scholar]
- 27.Przedpelska-Wasowicz E.M., Wierzbicka M. Gating of aquaporins by heavy metals in Allium cepa L. epidermal cells. Protoplasma. 2011;248:663–671. doi: 10.1007/s00709-010-0222-9. [DOI] [PMC free article] [PubMed] [Google Scholar]
- 28.Colombani, M. 2013. Mechanics of fast movement in the carnivorous plant Dionea. Elasto-hydrodynamic measurements at cell and tissue scales. Consequences for the closing mechanism. PhD thesis. University of Marseille, Marseille, France.
- 29.Gadalla A., Dehoux T., Audoin B. Transverse mechanical properties of cell walls of single living plant cells probed by laser-generated acoustic waves. Planta. 2014;239:1129–1137. doi: 10.1007/s00425-014-2045-y. [DOI] [PubMed] [Google Scholar]
- 30.Xi X., Kim S.H., Tittmann B. Atomic force microscopy based nanoindentation study of onion abaxial epidermis walls in aqueous environment. J. Appl. Phys. 2015;117:024703. [Google Scholar]
- 31.Milani P., Mirabet V., Boudaoud A. Matching patterns of gene expression to mechanical stiffness at cell resolution through quantitative tandem epifluorescence and nanoindentation. Plant Physiol. 2014;165:1399–1408. doi: 10.1104/pp.114.237115. [DOI] [PMC free article] [PubMed] [Google Scholar]
- 32.Sieber P., Schorderet M., Nawrath C. Transgenic Arabidopsis plants expressing a fungal cutinase show alterations in the structure and properties of the cuticle and postgenital organ fusions. Plant Cell. 2000;12:721–738. doi: 10.1105/tpc.12.5.721. [DOI] [PMC free article] [PubMed] [Google Scholar]
- 33.Johnson K.L. Cambridge University Press; Cambridge, UK: 1987. Contact Mechanics. [Google Scholar]
- 34.Forouzesh E., Goel A., Turner J.A. Quantifying plant cell-wall failure in vivo using nanoindentation. MRS Comm. 2014;4:107–111. [Google Scholar]
- 35.Rygol J., Pritchard J., Zimmermann U. Transpiration induces radial turgor pressure gradients in wheat and maize roots. Plant Physiol. 1993;103:493–500. doi: 10.1104/pp.103.2.493. [DOI] [PMC free article] [PubMed] [Google Scholar]
- 36.Roberts A.G., Oparka K.J. Plasmodesmata and the control of symplastic transport. Plant Cell Environ. 2003;26:103–124. [Google Scholar]
- 37.Oparka K.J., Prior D.A.M. Direct evidence for pressure-generated closure of plasmodesmata. Plant J. 1992;2:741–750. [Google Scholar]
- 38.Evered C., Majevadia B., Thompson D.S. Cell wall water content has a direct effect on extensibility in growing hypocotyls of sunflower (Helianthus annuus L.) J. Exp. Bot. 2007;58:3361–3371. doi: 10.1093/jxb/erm183. [DOI] [PubMed] [Google Scholar]
- 39.Lee J., Holbrook N.M., Zwieniecki M.A. Ion induced changes in the structure of bordered pit membranes. Front. Plant Sci. 2012;3:55. doi: 10.3389/fpls.2012.00055. [DOI] [PMC free article] [PubMed] [Google Scholar]
- 40.Kierzkowski D., Nakayama N., Smith R.S. Elastic domains regulate growth and organogenesis in the plant shoot apical meristem. Science. 2012;335:1096–1099. doi: 10.1126/science.1213100. [DOI] [PubMed] [Google Scholar]
- 41.Lipchinsky A., Sharova E.I., Medvedev S.S. Elastic properties of the growth-controlling outer cell walls of maize coleoptile epidermis. Acta Physiol. Plant. 2013;35:2183–2191. [Google Scholar]
- 42.Deng Y., Sun M., Shaevitz J.W. Direct measurement of cell wall stress stiffening and turgor pressure in live bacterial cells. Phys. Rev. Lett. 2011;107:158101. doi: 10.1103/PhysRevLett.107.158101. [DOI] [PubMed] [Google Scholar]
- 43.Cramer G.R. Differential effects of salinity on leaf elongation kinetics of three grass species. Plant Soil. 2003;253:233–244. [Google Scholar]
- 44.Azaizeh H., Gunse B., Steudle E. Effects of NaCl and CaCl2 on water transport across root cells of maize (Zea mays L.) seedlings. Plant Physiol. 1992;99:886–894. doi: 10.1104/pp.99.3.886. [DOI] [PMC free article] [PubMed] [Google Scholar]
- 45.Kedem O., Katchalsky A. Thermodynamic analysis of the permeability of biological membranes to non-electrolytes. Biochim. Biophys. Acta. 1958;27:229–246. doi: 10.1016/0006-3002(58)90330-5. [DOI] [PubMed] [Google Scholar]
- 46.Steudle E., Tyerman S.D. Determination of permeability coefficients, reflection coefficients, and hydraulic conductivity of Chara corallina using the pressure probe: effects of solute concentrations. J. Membr. Biol. 1983;75:85–96. [Google Scholar]
- 47.Zhu J.-K. Regulation of ion homeostasis under salt stress. Curr. Opin. Plant Biol. 2003;6:441–445. doi: 10.1016/s1369-5266(03)00085-2. [DOI] [PubMed] [Google Scholar]
- 48.Noiraud N., Maurousset L., Lemoine R. Identification of a mannitol transporter, AgMaT1, in celery phloem. Plant Cell. 2001;13:695–705. doi: 10.1105/tpc.13.3.695. [DOI] [PMC free article] [PubMed] [Google Scholar]
- 49.Benkert R., Obermeyer G., Bentrup F.-W. The turgor pressure of growing lily pollen tubes. Protoplasma. 1997;198:1–8. [Google Scholar]
- 50.Shabala S.N., Lew R.R. Turgor regulation in osmotically stressed Arabidopsis epidermal root cells. Direct support for the role of inorganic ion uptake as revealed by concurrent flux and cell turgor measurements. Plant Physiol. 2002;129:290–299. doi: 10.1104/pp.020005. [DOI] [PMC free article] [PubMed] [Google Scholar]
- 51.Minc N., Boudaoud A., Chang F. Mechanical forces of fission yeast growth. Curr. Biol. 2009;19:1096–1101. doi: 10.1016/j.cub.2009.05.031. [DOI] [PMC free article] [PubMed] [Google Scholar]
- 52.Cayley D.S., Guttman H.J., Record M.T., Jr. Biophysical characterization of changes in amounts and activity of Escherichia coli cell and compartment water and turgor pressure in response to osmotic stress. Biophys. J. 2000;78:1748–1764. doi: 10.1016/s0006-3495(00)76726-9. [DOI] [PMC free article] [PubMed] [Google Scholar]
Associated Data
This section collects any data citations, data availability statements, or supplementary materials included in this article.