

ABSTRACT
Nuclear positioning is a crucial cell function, but how a migrating cell positions its nucleus is not understood. Using traction-force microscopy, we found that the position of the nucleus in migrating fibroblasts closely coincided with the center point of the traction-force balance, called the point of maximum tension (PMT). Positioning of the nucleus close to the PMT required nucleus–cytoskeleton connections through linker of nucleoskeleton-to-cytoskeleton (LINC) complexes. Although the nucleus briefly lagged behind the PMT following spontaneous detachment of the uropod during migration, the nucleus quickly repositioned to the PMT within a few minutes. Moreover, traction-generating spontaneous protrusions deformed the nearby nucleus surface to pull the nuclear centroid toward the new PMT, and subsequent retraction of these protrusions relaxed the nuclear deformation and restored the nucleus to its original position. We propose that the protruding or retracting cell boundary transmits a force to the surface of the nucleus through the intervening cytoskeletal network connected by the LINC complexes, and that these forces help to position the nucleus centrally and allow the nucleus to efficiently propagate traction forces across the length of the cell during migration.
KEY WORDS: Nucleus, LINC complex, KASH4, Tensile forces, Traction stress, Cytoskeleton
INTRODUCTION
The nucleus is an important cellular organelle that performs numerous functions, including organization of the genome, regulation of gene expression and regulation of signaling (Mammoto et al., 2013; Swift et al., 2013). Proper positioning of the nucleus is essential for several cell and tissue functions, such as cell migration (Friedl et al., 2011; Luxton and Gundersen, 2011), polarization (Gomes et al., 2005), division (Gönczy, 2008) and development (Roth et al., 1995; Zhang et al., 2007; Zhao et al., 2012). Nuclear positioning is a tightly regulated process in cells, and deregulation of nuclear positioning is associated with diverse pathologies (Burke and Roux, 2009; Dupin and Etienne-Manneville, 2011; Gundersen and Worman, 2013).
In many cultured cell types, the nucleus can be seen to be positioned near the cell center. Given the large size of mammalian nuclei (diameter ∼10–15 microns depending on cell type), maintaining the roughly central position of the nucleus in a motile cell requires active force generation on the nuclear surface that is sensitive to changes in cell shape. Parsing the various contributors to the nuclear-force balance that keep it centrally positioned in the cell has remained challenging.
Each of the three cytoskeletal elements are known to be involved in nuclear positioning (Starr, 2007). Microtubule motors – like dynein and kinesin – generate shear forces on the nuclear surface that result in nuclear rotations in fibroblasts (Levy and Holzbaur, 2008; Wu et al., 2011), can cause nuclear translocations in epithelial cells (Wilson and Holzbaur, 2012) and are required for nuclear migration in Caenorhabditis elegans embryos (Fridolfsson et al., 2010; Fridolfsson and Starr, 2010; Meyerzon et al., 2009). Actomyosin forces have been hypothesized to pull on the nucleus (Chancellor et al., 2010; Friedl et al., 2011; Sims et al., 1992; Wang et al., 2009; Wu et al., 2014), push on it (Friedl et al., 2011; Roth et al., 1995; Zhang et al., 2007) and shear it (Folker et al., 2011; Kim et al., 2014; Luxton et al., 2010). In addition, intermediate filaments can trap and resist the motion of the nucleus by forming a ‘cage’-like structure around it (Ketema et al., 2007; Postel et al., 2011; Wilhelmsen et al., 2005), as well as transmit active forces from the actomyosin cytoskeleton to the nuclear surface (Dupin et al., 2011).
The challenge of determining the source of anterior and posterior forces on the nucleus in motile cells is that perturbations to a cytoskeletal component alter forces throughout the cell; selective inhibition in the leading edge or the trailing edge is difficult. In previous work (Wu et al., 2014), we used the Rac1 photoactivation assay (Machacek et al., 2009; Wang et al., 2010; Wu et al., 2009) to trigger local lamellipodia formation in serum-starved NIH 3T3 fibroblasts, which enabled selective perturbation to the nuclear force balance. The increased pulling force on the nucleus triggered by photoactivated lamellipodial formation suggested that a ‘tug-of-war’ between anterior and posterior pulling forces positions the nucleus in crawling NIH 3T3 fibroblasts (Wu et al., 2014); although it remained unclear whether these results apply to spontaneous lamellipodial formation in unstimulated migrating cells. In this paper, we perform traction-force microscopy analyses of intact and linker of nucleoskeleton-to-cytoskeleton (LINC)-complex-perturbed cells to show that efficient front-to-back transmission of tensile forces in the cell requires nucleus–cytoskeleton linkages. Our results support the hypothesis that lamellipodial protrusions in a migrating cell transmit a pulling force through the intervening cytoskeletal network to the nuclear surface and that the nucleus propagates these forces to the cell's trailing edge.
RESULTS
Nuclear position coincides with the point of maximum tension in the cell
In a recent paper (Wu et al., 2014), we proposed a model in which the leading edge pulls the nucleus forward and that this force is balanced by tensile forces in the trailing edge. If the tension is transmitted from the front to the back, mainly through the nucleus, then the position of the nucleus should coincide closely with where the tension is maximum along the cell axis. To test this prediction, we performed traction-force microscopy analyses of migrating NIH 3T3 fibroblasts and quantified traction-stress distributions for the cells. From the traction-stress distribution, we calculated the line corresponding to the major axis of contraction (hereafter called the line of contraction, see Materials and Methods). We then calculated the point at which the maximum tension along the line of contraction occurred [hereafter referred to as the point of maximum tension (PMT)] (Fig. 1A). Because the mechanical behavior of the nucleus has been shown to depend on tissue stiffness (Swift et al., 2013), and we have shown that the rigidity of the substratum alters nuclear shape (Lovett et al., 2013), we performed these experiments on polyacrylamide gels with sufficiently different rigidities. Remarkably, in control cells, the nuclear position closely coincided with the PMT (Fig. 1B,C), and, on average, both points were slightly behind the cell centroid (supplementary material Fig. S1), independent of substrate rigidity.
Fig. 1.

Nuclear positioning coincides with the PMT in the cell in a nucleus–cytoskeleton-linkage-dependent manner. (A) DIC images show the position of the nucleus in wild-type (WT), EGFP-expressing (EGFP) and KASH4-expressing (KASH4) cells. The nuclear centroid coincides with the point of maximum tension (PMT, calculated as shown here and described in Materials and Methods) in control but lags behind it in KASH4-expressing cells. Vertical solid and dashed lines indicate the positions of the nuclear centroid and the PMT, respectively. (B) Scatter plots of nucleus centroid positions with respect to the PMT in wild-type (WT), EGFP-expressing (EGFP) and KASH4-expressing cells on gels with Young's moduli of 5.2 or 46 kPa. For each sample, the x and y coordinates of the PMT and the nucleus centroids were rotated such that the line of contraction was parallel to the x-axis and the leading edge of the cell was facing the positive x-axis, and translocated such that the PMT lay at the origin. Red dots represent the mean. Ovals represent standard deviation. (C) Bar plot of the data in B showing that the nuclear position closely coincides with the PMT in wild-type (WT) and EGFP-expressing cells (EGFP), whereas it lags behind the PMT by several microns in KASH4-expressing (KASH4) cells. The trend is independent of substrate stiffness. N≥20 for each condition. *P<0.05, **P<0.025, ***P<0.005, ****P<0.0005. (D) Disruption of the LINC complex does not alter cell tension. No significant difference was observed in the average cell tension between wild-type (WT), EGFP-expressing (EGFP) and KASH4-expressing (KASH4) cells. N≥18 for each condition. (E) Myosin II activity is not significantly different between control and KASH4-expressing cells. Fluorescent images of control cells (top row) and Y27-treated cells (1 hour) (middle row) fixed and stained for phosphorylated myosin light chain 2 (red) and DNA (blue) show the decreased presence of active myosin in Y27-treated cells. The bottom row shows a KASH4-transfected cell (green) having similar myosin activity as that of the surrounding control cells, as apparent from the comparable phosphorylated myosin light chain signal. Error bars represent s.e.m. Scale bars: 10 µm.
To decouple the nucleus from the cytoskeleton, we disrupted the so-called LINC complex, which comprises nesprin-family proteins connected to SUN1 and SUN2 proteins (Roux et al., 2009; Fridolfsson and Starr, 2010), by overexpressing the Klarsicht, ANC-1, Syne homology (KASH) domain of nesprin 4 tagged with enhanced green fluorescent protein (EGFP) (hereafter termed KASH4; supplementary material Fig. S2). We found that, in contrast to control, nuclei in cells with a disrupted LINC complex lagged behind the PMT and the cell centroid by several microns (Fig. 1B,C; supplementary material Fig. S1).
A possible reason for the abnormally positioned nucleus in KASH4-expressing cells is that the overall tension in these cells is altered upon decoupling the nucleus from the cytoskeleton. However, on two substrates of differing stiffness, we found no significant difference in the total cell tension between control and KASH4-expressing cells (Fig. 1D). These results were confirmed by immunostaining for phosphorylated myosin (Fig. 1E), which showed no discernible difference in myosin activity in control versus KASH4-expressing cells.
The nucleus is dynamically moved in the direction of the PMT
We next investigated the dynamic correlation between the nuclear position and the PMT in migrating fibroblasts. In cells where the trailing edge had just detached, the PMT moved rapidly toward the leading edge (Fig. 2A). The positioning of the nucleus did not respond as rapidly, and lagged behind the PMT for a few minutes (Fig. 2B). As the cell shape was re-established, the nucleus was observed to re-coincide with the PMT (Fig. 2C,D).
Fig. 2.

The nucleus is dynamically moved in the direction of the PMT. (A) DIC images of a representative cell during different phases of migration (top), the corresponding traction-stress maps (middle) and corresponding nuclear outlines showing the relative positions of the PMT and nuclear centroid (bottom). Following spontaneous tail detachment, the PMT moves towards the leading edge and the nucleus lags behind it. (B) The nucleus does not respond quickly and lags behind the PMT for a few minutes. (C) The nucleus dynamically re-coincides with the PMT as the cell shape is re-established. Scale bars: 20 µm. (D) Time-dependent profile of the position of the nuclear centroid relative to the PMT along the line of contraction. The nuclear centroid lags behind the PMT just after the detachment of the trailing edge (t=5 minutes) and then is moved to coincide with it over time. Error bars represent s.e.m. N=10 cells.
We next looked for the effect of protrusions on nuclear position and the PMT. We observed that single elongated migrating NIH 3T3 fibroblasts occasionally formed dynamic F-actin-rich lateral protrusions proximal to the nucleus that were stable for several minutes before retracting back (Fig. 3A). To track the fate of the nucleus (visualized by expressing GFP-tagged histone H1), we imaged different confocal planes during the formation and retraction of the lateral protrusions (different planes are shown in Fig. 3A). Interestingly, in some but not all confocal planes, the nucleus appeared to deform in the direction of the protrusion over a time of a few minutes, and it maintained its deformed shape for as long as the protrusion persisted, before relaxing back upon retraction of the protrusion (Fig. 3A,B). Reconstructing the nuclear cross section in the y–z view revealed a clear reversible deformation close to the basal plane during the local protrusion process and subsequent relaxation (Fig. 3A, y–z view).
Fig. 3.

Local reversible nuclear deformation in response to local protrusion and retraction. (A) Fluorescent images of a migrating cell transfected with red fluorescent protein (RFP)–LifeAct (F-actin) and GFP–histone-H1 (nucleus) on glass showing the formation and retraction of a lateral protrusion near the nucleus (arrows) at various confocal planes (planes 1–4 in the cartoon on the left) and the reversible nuclear deformation (in the x–y plane) accompanying the protrusion. y–z view of the nucleus at the mid-plane shows the deformation in the y–z plane. Vertical dashed lines indicate the position of the corresponding y–z plane. Arrowheads indicate the cell cortex moving outward. (B) Outlines of the protrusion (top left) and retraction (bottom left) of the newly formed local protrusion and the associated nuclear shape at the different time points. y–z views showing the reversible nuclear deformation (right panels). (C) DIC images of a representative cell on 46-kPa gel during the formation of a lateral protrusion, and the corresponding traction stress maps. (D) Overlay of the nuclei and PMTs in C showing the correlation in the motion of the PMT and nuclear centroid. (E) Time-dependent profiles of lateral distances of the PMT and nucleus centroid from the initial PMT position. Error bars represent s.e.m. N=10 cells. Scale bars: 10 µm.
We next used traction-force microscopy to measure the traction stresses in the cell mid-section during the formation of a lateral protrusion. Within 10–15 minutes of formation of the protrusion, substantial local traction stresses were observed under it and were directed in the opposite direction (Fig. 3C). This is consistent with an outward pull on the nucleus in the direction of the protrusion (Fig. 3C). As seen in Fig. 3D,E, the PMT moved toward the protrusion over a time period of 20 minutes. The nucleus was also seen to respond in a similar fashion (Fig. 3E). The results in Figs 2 and 3 reveal the dynamic control over nuclear position with respect to the PMT during trailing-edge detachment and re-establishment of cell shape.
Lateral stress fibers do not compress the nucleus to deform it
To understand the forces that cause nuclear deformation in response to protrusion, we next inhibited myosin activity by treating cells with the Rho-kinase inhibitor Y27632 (hereafter termed Y27). As shown in Fig. 4A,B, although treatment with Y27 did not inhibit protrusive activity proximal to the nuclear surface (consistent with previous reports, Lele et al., 2006), the local nuclear deformation observed in control cells was substantially reduced. To quantify the nuclear deformation upon the formation of lateral protrusions, we measured the width of the nucleus before and after the protrusion had formed. Although the deformation was significantly reduced in Y27-treated cells (Fig. 4A–C), there appeared to be some translocation, but it was not always directed toward the protrusion. Similar to the myosin-inhibition experiments, in KASH4-expressing cells, nuclear deformation in response to lateral protrusion was significantly reduced, although some translocation did occur (Fig. 4A–C). Taken together, these experiments suggest that actomyosin activity and nuclear–cytoskeletal linkages are required for nuclear deformation in the direction of the protrusions.
Fig. 4.

Significant nuclear deformation in response to local protrusion proximal to the nuclear surface requires myosin II activity and an intact LINC complex. (A) The formation and retraction of a lateral protrusion near the nucleus in control, Y27-treated and KASH4-overexpressing cells. Noticeable nuclear deformation is observed in control cells but not in myosin-II-inhibited or LINC-complex-disrupted cells. Scale bars: 10 µm. (B) Outlines of the protrusion (top) and retraction (bottom) of the newly formed local protrusion and the associated nuclear shape at the different time points. (C) Quantification of nuclear deformation upon the formation of lateral protrusion as measured by the strain in the nuclear width at the maximum deformation point. Strains represent the change (final−initial) in the nuclear width at the maximum deformation point divided by its initial value. Error bars represent s.e.m. N≥17 for each condition (for ‘Normal’, 121 cells were observed, 102 cells had protrusions and 102 cells were analyzed for strain calculation). For Y27-treated cells, 178 cells were observed, 150 cells had protrusions and 150 cells were analyzed for strain calculation. For KASH4 expression, 25 cells were observed, 17 cells had protrusions and 17 cells were analyzed for strain calculations. Each cell was observed for more than 8 hours. #P<0.00001.
Because actomyosin stress fibers have been proposed to compress the nucleus laterally (Versaevel et al., 2012), one possible hypothesis is that the protrusion displaces stress fibers away from the nucleus, resulting in an expanded nuclear shape. To test this hypothesis, we tracked the fate of the F-actin bundles in different confocal planes [Fig. 5A, corresponding to the cell shown in Fig. 3A; no bundles were visible on the apical side of the nucleus in the cell shown, F-actin was visualized by expressing red fluorescent protein (RFP)–LifeAct]. The basal bundles under the nucleus were essentially stationary during the protrusion and relaxation (Fig. 5A). At the mid-plane (Fig. 3A, plane at 0.75 μm), the cortex moved outward with the protrusion (indicated with arrow heads), but it was clearly not physically touching the nuclear surface. Taken together, these observations argue against a model in which a compressive force resulting from lateral stress fibers is relaxed in order to allow nuclear expansion. We did not find any correlation between nuclear deformation and the motion of actomyosin bundles at any of the confocal planes examined.
Fig. 5.

The nucleus does not expand laterally upon severing lateral stress fibers running parallel to it. (A) Kymograph during the formation and retraction of the lateral protrusion. No motion of the actin bundles underneath the nucleus is noticeable as it undergoes the local deformation. (B) Cartoon showing the two types of lateral actin stress fibers that were severed in this study. (C) A schematic showing the laser ablation experiment of lateral stress fibers. (D) Confocal images showing that laser ablation of a lateral stress fiber running parallel to the side of the nucleus either not touching it (top) or touching it (bottom) does not cause expansion in the nuclear area. Insets show the two sides of the severed stress fiber. Arrowheads indicate the severing point. Arrows indicate the two ends of the severed stress fiber. (E) Quantification of the nuclear shape change before and after lateral stress fiber severing showing a small decrease in the nuclear major and minor axes, and area upon stress fiber severing. Strains represent the change (final−initial) in the parameter divided by its initial value. Error bars represent s.e.m. N=10. *P<0.05 compared to 0. Scale bars: 6 µm (A); 10 µm (D, actin, actin inserts); 5 µm (D, nucleus).
To further test for a role of lateral compression through actomyosin fibers, we severed individual lateral actomyosin fibers that run parallel to the side of the nucleus by using femtosecond laser ablation (Fig. 5B,C). Two subsets of lateral fibers were severed: fibers that touched the nucleus (Fig. 5D, bottom) and fibers that did not (Fig. 5D, top), because the latter ones could still be mechanically coupled to the nucleus. Elongated nuclei were observed in elongated cells independent of whether lateral stress fibers were touching their sides (in any confocal plane). By using confocal scanning, we found that, on average, lateral fibers that touched the nucleus were approximately 1.2 µm above the basal plane of the cell. Severing a lateral fiber that ran along the side of the nucleus and in close physical proximity of the nucleus or a fiber that seemed to physically touch the nucleus did not produce any noticeable outward expansion in the nucleus [Fig. 5D; in both examples shown, no other lateral fibers were present as confirmed using 3D confocal imaging (supplementary material Movies 1 and 2)]. In cases where the lateral stress fiber appeared to touch the nucleus, the fiber was severed 5–10 µm away from the nucleus to avoid damaging the nucleus. We quantified the change in the shape of the nucleus before and after stress-fiber ablation by calculating the strain in the major and minor axes, and the area of the nucleus. Instead of an increase in the area and an increase in the minor axis predicted by an expansion, there was a slight decrease in all three values (Fig. 5E), arguing against a mechanism in which the lateral fibers compress the nucleus and shape it.
Traction-force dynamics in migrating cells reveals that the nucleus is an internal force propagator
To test further the idea that the nucleus propagates internal forces, we performed traction-force microscopy analyses of single migrating NIH 3T3 fibroblasts, looking for instances of spontaneous detachment of the trailing edge. We calculated the tension across the nuclear position – the tension at the intersection of the nuclear bisector with the line of contraction (hereafter referred to as the nuclear bisector tension, NBT; the calculation is illustrated in Fig. 1A and described in Materials and Methods). This tension is the maximum tension that could potentially be transmitted through the nucleus. In actuality, only a portion of this tension is transmitted through the nucleus; the rest of it is transmitted through cytoskeletal elements, such as stress fibers that span the length of the cell or intermediate filaments that connect to the nuclear surface (Petrie et al., 2014). To estimate the tension transmitted through the nucleus following detachment of the trailing edge, we tracked the NBT following detachment (Fig. 6B). The tail detached more quickly in control than in KASH4-expressing cells (Fig. 6A), and the NBT decayed rapidly after detachment in control NIH 3T3 fibroblasts (within a few minutes, Fig. 6B). In KASH4-overexpressing cells, detachment of the trailing edge produced a slower decay of NBT (Fig. 6B). The reduction in NBT was also smaller in KASH4-overexpressing cells compared with that of control cells (Fig. 6B,C). Both the magnitude and time scale of decay of NBT was independent of the stiffness. Collectively, these results further support the conclusion that efficient front-to-back transmission of tension across the nucleus requires nuclear linkages.
Fig. 6.

Traction-force dynamics in migrating cells reveals that the nucleus is a propagator of internal force. (A) DIC images of migrating cells before and after trailing-edge detachment events. Spontaneous tail detachment occurs more rapidly in wild-type (WT) and EGFP-expressing cells (EGFP) than in KASH4-expressing (KASH4) cells. Scale bars: 10 µm. (B) Time-dependent profiles of decaying nuclear bisector tension (NBT) on two substrates of differing stiffness (top and bottom panels) following spontaneous detachment of the trailing edge in wild-type (WT), EGFP-expressing (EGFP) and KASH4-expressing (KASH4) cells. The drop in NBT was slower and smaller in KASH4-expressing cells compared with that of control cells. (C) Comparison of the percentage drop in NBT following spontaneous tail detachment between wild-type (WT), EGFP-expressing (EGFP) and KASH4-expressing (KASH4) cells on two substrates of differing stiffness. A larger drop is observed in control than in KASH4-expressing cells. The trend does not depend on the stiffness of the underlying substrate. Error bars represent s.e.m. N=5. **P<0.025, ***P<0.005.
Efficient force transmission between the trailing edge and the leading edge requires an intact LINC complex
To further test the hypothesis that the nucleus transmits tensile forces between the leading edge and the trailing edge, we detached the trailing edge of the cell with a micro-manipulator (Fig. 7A), which immediately removes traction at the trailing edge. If the anterior and posterior portions of the cell are mechanically coupled, then detaching the trailing edge should immediately decrease the traction stress in the anterior portion of the cell. As seen in Fig. 7A, for both control and KASH4-expressing cells, the cell traction decreased measurably after detachment of the trailing edge. We quantified the stress in a region that spanned from the leading edge to halfway between the leading edge and the nucleus. Any decrease in stress in this region upon detaching the trailing edge more than 50 microns away is likely to indicate a ‘long-range’ transmission of intracellular tension between the leading and the trailing edge. On detaching the trailing edge, we found that the stress in this region dropped rapidly by 40% on average in control cells (Fig. 7A,B), whereas only a 20% average drop was observed for cells with KASH4 overexpression. This finding was consistent on both of the tested substrates of differing stiffness (Fig. 7E). These results indicate that the nucleus contributes to the transmission of forces between the trailing edge and the leading edge through the LINC complex.
Fig. 7.

The LINC complex transmits forces across the nucleus. (A) DIC images (top), cell and nuclear outlines (middle) and corresponding traction stress maps (bottom) of migrating wild-type (WT), EGFP-expressing (EGFP) and KASH4-expressing (KASH4) cells before and after forced trailing-edge detachment. Scale bars: 20 µm. (B) Bar plot showing a comparison between the percentage drop in traction stress at the midpoint between the leading edge and the nucleus after forced detachment of the trailing edge between wild-type (WT), EGFP-expressing (EGFP) and KASH4-expressing (KASH4) cells on two substrates of differing stiffness. A much more substantial drop is observed in control than in KASH4-expressing cells. The trends do not depend on the rigidity of the underlying substrate. Error bars represent s.e.m. N≥10. *P<0.05, **P<0.025.
DISCUSSION
Positioning of the nucleus is an essential cell function and of recent interest in literature (Friedl et al., 2011; Gomes et al., 2005; Gönczy, 2008; Luxton and Gundersen, 2011; Minc et al., 2011). As a single motile cell continuously deforms in shape, its changing shape must generate continuously varying forces on the nuclear surface so that the nucleus is maintained in its central position. In this paper, we provide direct evidence that the nucleus is pulled on by forces generated in a spontaneously generated protrusion. In migrating NIH 3T3 fibroblasts, protrusions proximal to the nuclear surface were observed to develop, stabilize and then retract over time. The nucleus responded by deforming in the direction of the local protrusion, maintaining its deformation and then relaxing back on retraction of the protrusion. These results suggest that the motion of the cell membrane is coupled to the nucleus. There are at least two mechanisms by which this could happen – a mechanism in which protrusion causes an expansion in the intervening cytoskeletal network, which pulls on the nucleus to deform it; and another in which new F-actin filaments combine with existing myosin motors to increase the contractile force on the nucleus. The nuclear deformation was significantly suppressed on inhibition of myosin activity; however, nuclear translocation was not inhibited. This suggests that although the protrusion might still generate a pulling force on the nuclear surface due to expansion of the intervening cytoskeletal network, no significant deformation was observed because the overall tension on the nucleus is decreased in myosin-inhibited cells. Similarly, we observed no significant deformation but some translocation in KASH4-expressing cells, suggesting that there is a requirement of nuclear–cytoskeletal linkage for mechanical coupling of the membrane to the nucleus. These linkages might be due to nuclear proteins like nesprin 2G (Chang et al., 2013), or they might be transmitted by other structures, such as intermediate filaments (Dupin et al., 2011; Maniotis et al., 1997).
Because the nucleus is thought to potentially be compressed by lateral stress fibers in slender portions of the migrating cell (Versaevel et al., 2012), one hypothesis is also that local protrusion pulls out lateral fibers that then allows the nucleus to expand. Our results, however, indicate that nuclear deformation is not necessarily accompanied by stress fiber motion in the direction of the protrusion and that severing individual fibers touching the nucleus or in close physical proximity of it does not cause expansion of the nucleus; these results argue against the lateral compression hypothesis. Taken together with our previous results, where we did not observe apical fibers oriented orthogonal to the cell axis that translocated in the direction of nuclear motion (Wu et al., 2014), we conclude that stress fibers are not likely to play a major role in moving the nucleus during fibroblast migration.
In a previous study (Wu et al., 2014), we observed that the nucleus moves toward a newly formed lamellipodium in a myosin-dependent manner, based on which we proposed that the nucleus might transmit internal tension from the front to the back of a migrating NIH 3T3 fibroblast. If true, such a model makes the prediction that the nucleus coincides with where the tension is maximum in the cell. The location of the maximum tension along the cell's contractile axis can be estimated from measurements of the traction-stress distribution. Here, we have directly tested the above prediction by performing traction-force microscopy with control and KASH4-expressing cells and found that the nuclear centroid coincides closely with the PMT in control cells but that the nucleus lags behind the PMT by several microns in KASH4-expressing cells. This lag is not due to a change in the total tension generated by KASH4-expressing cells because the average cell tension and the myosin activity were comparable in control and KASH4-expressing cells (Fig. 1D,E). This apparent lack of correlation between the nuclear centroid and the PMT indicates a strong role for the nucleus–cytoskeleton connections in the nuclear-positioning mechanism.
Furthermore, measurements of the decrease in the traction stress at the cell front on detachment of the trailing edge in particular revealed the mechanical role of the nucleus in migrating cells. Disruption of the LINC complex through KASH4 expression decreased the drop in tension at the front significantly compared with control, indicating that the nuclear linkages with the cytoskeleton are required for efficient transmission of tension between the front and the back of the cell. Importantly, overall cell tension was unchanged between control and KASH4-expressing cells, which rules out effects on myosin activity as being responsible for the differential drop in stress. Consistent with these observations, control cells showed a faster and larger drop in stress upon natural tail detachment compared with KASH4-expressing cells.
The motion of the nucleus toward new protrusions apparently contradicts other experiments in which the nucleus at the edge of a scratch wound is pushed to the back of the cell by retrograde flow of actin from the leading edge (Gomes et al., 2005; Luxton et al., 2010). However, there are some important differences between the two experiments. Firstly, the nuclear movement in monolayers was observed in cells at the boundary of a monolayer, where cell–cell pulling forces are present (Desai et al., 2009; Liu et al., 2010), and possibly substantial; here only isolated cells were studied where such forces do not exist. If the cell-to-cell forces are propagated to the nucleus and are greater than the pulling forces from the front edge, a net backward motion of the nucleus is to be expected. Secondly, studies by Gundersen and co-workers have examined cells during their early polarization phase before any cell translocation occurred (Gomes et al., 2005; Luxton et al., 2010), whereas our study investigated cells during active migration.
The model that emerges from the experiments and quantitative analyses here is shown in Fig. 8. In this model, forces are exerted on the nucleus from the anterior and posterior portions of the cell. The nuclear centroid coincides with the PMT in the cell, which slightly lags behind the cell centroid. KASH4 overexpression causes the nucleus, to considerably lag behind the PMT, as well as behind the cell centroid, emphasizing the importance of the nuclear–cytoskeletal connections in normal cell function.
Fig. 8.
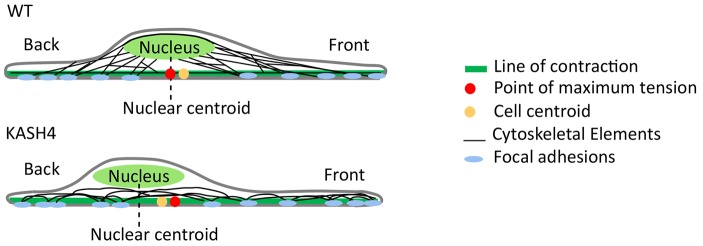
Physical model of nuclear force balance showing the relative positions of the cell centroid, nuclear centroid and the PMT in wild-type and KASH4-expressing migrating cells. In control cells, the nuclear centroid coincides with the PMT, whereas the centroid lags behind the PMT in KASH4-expressing (KASH4) cells. WT, wild type.
MATERIALS AND METHODS
Cell culture, plasmids and transfection
NIH 3T3 fibroblasts were cultured in Dulbecco's modified Eagle's medium with 4.5g/l glucose (Mediatech, Manassas, VA) supplemented with 10% DBS (Gibco, Grand Island, NY) and 1% penicillin-streptomycin (Mediatech, Manassas, VA), and maintained at 37°C in a humidified 5% CO2 environment. Transient transfection of plasmids into the cells was performed for 6 hours using the Lipofectamine 2000 transfection reagent (Invitrogen, Carlsbad, CA) and OPTI-MEM medium (Invitrogen, Carlsbad, CA). In this work, the following plasmid constructs were used: EGFP–KASH4 [used as described previously (Roux et al., 2009)], LifeAct-TagRFP, GFP–histone-H1 and EGFP. For myosin inhibition, Y27632 (EMD Millipore, Billerica, MA) was added to the cell medium at a final concentration of 25 µM >1 hour prior to imaging and was kept throughout the imaging period (8 hours). For microscopy, cells were transferred onto fibronectin-coated (5 µg/ml, BD Biosciences) 35-mm diameter glass-bottomed dishes (WPI, Sarasota, FL) and allowed to spread on substrates for 24 hours before imaging.
Immunofluorescence microscopy
Immunofluorescence microscopy for Y27632-treated NIH 3T3 cells was performed in order to check the specificity of an antibody against phosphorylated myosin light chain 2 (serine residue 19) (Cell Signaling, 3671S). NIH 3T3 cells were treated with 10 µM of Y27632 for 1 hour and fixed with 3% (w/v) paraformaldehyde/PBS for 10 minutes and further permeabilized with 0.4% Triton X-100 in PBS for 15 minutes. After fixation and permeabilization, cells were incubated with the antibody against phosphorylated myosin light chain 2 and Alex-Fluor-568-conjugated goat anti-rabbit secondary antibody (Life Technologies, A11036), each for 20 minutes at 25°C. DNA was detected with Hoechst dye 33258. Coverslips were mounted with 10% Mowiol 4-88 (17951; Polysciences). Images were obtained using Nikon Eclipse 90i microscope (40×/0.75 Plan Fluor DIC M/N2 objective) and a CDC camera (CoolSNAP HQ, Photometrics) linked to a workstation running NIS-Elements software (Nikon). To monitor phosphorylated myosin in the LINC-complex-perturbed cells, EGFP–KASH4 was transiently expressed, as previously reported (Roux et al., 2009). NIH 3T3 cells were transfected with EGFP–KASH4 using Lipofectamine 2000 (Life Technologies) as recommended by the manufacturer. After 18 hours, transfected cells were analyzed by immunofluorescence, as previously described (Roux et al., 2009).
Microscopy
Epifluorescent imaging (individual images and time lapse) was performed on a Nikon TE2000 inverted fluorescent microscope equipped with a 40×/1.30NA oil immersion objective and CCD camera (CoolSNAP HQ2, Photometrics, Tucson, AZ). During imaging, cells were maintained at 37°C in a humidified 5% CO2 environment. When applicable, high-throughput experiments were performed by simultaneously imaging multiple cells.
Confocal images were taken on a Nikon A1 confocal microscope using a 60×/1.40NA oil immersion objective. Throughout the imaging period, cells were maintained at 37°C in a humidified 5% CO2 environment.
Trailing-edge detachment
An Eppendorf Femtojet microinjection system (Eppendorf North America, Hauppauge, NY) was used to lower a micropipette (0.5-µm diameter tip) to the plane of the trailing edge (taking care not to touch the gel surface) and to carefully slide it underneath the trailing edge, translocating it towards the trailing edge to cause it to detach. The micropipette was then raised through a distance of 3–5 µm.
Traction-force microscopy
Fibronectin-coated (5 µg/ml, BD Biosciences) polyacrylamide (PAA) gels were prepared on glass-bottomed dishes (WPI, Sarasota, FL) as described previously (Lovett et al., 2013). Fluorescent microspheres of 0.5-µm diameter (Invitrogen) were suspended in the hydrogel before polymerization and used as fiduciary markers. NIH 3T3 cells were plated at a 5% confluence and incubated for 24 hours at 37°C in a humidified 5% CO2 environment. Differential interference contrast (DIC) and fluorescent images of isolated cells were taken simultaneously before and after careful and complete removal of a cell from the substrate using a micromanipulator with a 0.5-µm diameter micropipette (Eppendorf North America, Hauppauge, NY). Traction stresses were then calculated from the images using the LIBTRC software package kindly provided by Micah Dembo (Boston University, Boston, MA), who originally proposed the method of traction-force microscopy (TFM) and developed this algorithm (Dembo and Wang, 1999).
Two different ratios of acrylamide and bis-acrylamide (Fisher), 50:1 and 20:1, were used to make gels with Young's moduli of 5.2 kPa and 46 kPa, respectively. The Young's modulus of the PAA gels was measured with rheology, as described previously (Lovett et al., 2013).
Laser ablation
Cells were allowed to grow on substrates for 24 hours before performing laser ablations. For ablating single stress fibers, an upright Olympus FV1000 MPE multiphoton laser-scanning microscope equipped with a 60×/0.9NA water immersion objective was used. To image GFP–actin, the 488-nm laser line was used at 10% power. Single stress fiber ablation was performed with a Ti:Sapphire laser (Chameleon XR, Coherent, Santa Clara, CA) attenuated to 40% power at 790-nm wavelength. Five iterations were used to ablate the fiber, followed by 5–10 minutes of imaging retracting fibers. Z-stacks at 0.3-µm step size were acquired every 10 minutes following ablation for up to 30 minutes. The nucleus was visualized with SYTO59 red fluorescent dye (Invitrogen) for 15 minutes before ablation experiments.
Image analysis
Images (time lapses and individual) were processed using the NIS-Elements software (Nikon Corporation) and the ImageJ software (NIH; contrast enhancement), and then imported into the LIBTRC software (Dembo and Wang, 1999; Lo et al., 2000; Munevar et al., 2001) for calculation of the traction force. ImageJ was also used to calculate cell and nucleus centroids.
Traction integrals
The integrals of the traction vectors on each side of any line in the traction field are equal in magnitude and opposite in direction. However, the equal magnitudes of the integrated traction vectors on each side of the line vary with the position of the line. The PMT was found from the traction field as follows. First, the direction of the principal axis of the traction field (PA), which is the direction of the major traction dipole, was calculated from the moment matrix (Dembo and Wang, 1999). The location of the line of contraction, a line parallel to the PA, was then fixed so as to maximize the magnitude of the integrated traction vectors on each side of the line. We then found the point on this line where the integrated traction vectors were maximized across another line perpendicular to the PA. This unique point was identified as the PMT (the calculation is illustrated in supplementary material Fig. S3).
The nuclear bisecting line was calculated as the line passing through the nuclear centroid and that is perpendicular to the PA. The NBT was calculated as the magnitude of the integral of the traction stresses on each side of the nuclear bisecting line. The overall cell tension was calculated by integrating the entire traction-stress field.
Statistical analysis
All data are presented as mean±s.e.m., all statistical comparisons were made using ANOVA. Statistical significance was assumed for P<0.05.
Supplementary Material
Acknowledgements
The authors thank Professor Micah Dembo (Boston University) for providing the LIBTRC software package for computing traction stresses.
Footnotes
Competing interests
The authors declare no competing or financial interests.
Author contributions
S.A. designed, performed, analyzed all experiments [except for the laser ablation (designed and performed by D.L.), the p-myosin light chain staining, and the endogenous nesprin 3 displacement experiments (designed and performed by D.K. and K.J.R.)] and co-wrote the manuscript; R.D. and T.L. supervised the project and co-wrote the manuscript.
Funding
This work is supported by the National Science Foundation [grant CMMI 0954302 to T.P.L.]; and by the National Institutes of Health [grants R01GM102486 to T.P.L., K.J.R. and R.B.D., R01GM102203 to K.J.R., 5R01EB014869 to T.P.L. and K.J.R., P20GM103548 and P20GM103620 to Sanford Research, University of South Dakota]. Deposited in PMC for release after 12 months.
Supplementary material
Supplementary material available online at http://jcs.biologists.org/lookup/suppl/doi:10.1242/jcs.161703/-/DC1
References
- Burke B. and Roux K. J. (2009). Nuclei take a position: managing nuclear location. Dev. Cell 17, 587-597. 10.1016/j.devcel.2009.10.018 [DOI] [PubMed] [Google Scholar]
- Chancellor T. J., Lee J., Thodeti C. K. and Lele T. (2010). Actomyosin tension exerted on the nucleus through nesprin-1 connections influences endothelial cell adhesion, migration, and cyclic strain-induced reorientation. Biophys. J. 99, 115-123. 10.1016/j.bpj.2010.04.011 [DOI] [PMC free article] [PubMed] [Google Scholar]
- Chang W., Folker E. S., Worman H. J. and Gundersen G. G. (2013). Emerin organizes actin flow for nuclear movement and centrosome orientation in migrating fibroblasts. Mol. Biol. Cell 24, 3869-3880. 10.1091/mbc.E13-06-0307 [DOI] [PMC free article] [PubMed] [Google Scholar]
- Dembo M. and Wang Y. L. (1999). Stresses at the cell-to-substrate interface during locomotion of fibroblasts. Biophys. J. 76, 2307-2316. 10.1016/S0006-3495(99)77386-8 [DOI] [PMC free article] [PubMed] [Google Scholar]
- Desai R. A., Gao L., Raghavan S., Liu W. F. and Chen C. S. (2009). Cell polarity triggered by cell-cell adhesion via E-cadherin. J. Cell Sci. 122, 905-911. 10.1242/jcs.028183 [DOI] [PMC free article] [PubMed] [Google Scholar]
- Dupin I. and Etienne-Manneville S. (2011). Nuclear positioning: mechanisms and functions. Int. J. Biochem. Cell Biol. 43, 1698-1707. 10.1016/j.biocel.2011.09.004 [DOI] [PubMed] [Google Scholar]
- Dupin I., Sakamoto Y. and Etienne-Manneville S. (2011). Cytoplasmic intermediate filaments mediate actin-driven positioning of the nucleus. J. Cell Sci. 124, 865-872. 10.1242/jcs.076356 [DOI] [PubMed] [Google Scholar]
- Folker E. S., Ostlund C., Luxton G. W., Worman H. J. and Gundersen G. G. (2011). Lamin A variants that cause striated muscle disease are defective in anchoring transmembrane actin-associated nuclear lines for nuclear movement. Proc. Natl. Acad. Sci. USA 108, 131-136. 10.1073/pnas.1000824108 [DOI] [PMC free article] [PubMed] [Google Scholar]
- Fridolfsson H. N. and Starr D. A. (2010). Kinesin-1 and dynein at the nuclear envelope mediate the bidirectional migrations of nuclei. J. Cell Biol. 191, 115-128. 10.1083/jcb.201004118 [DOI] [PMC free article] [PubMed] [Google Scholar]
- Fridolfsson H. N., Ly N., Meyerzon M. and Starr D. A. (2010). UNC-83 coordinates kinesin-1 and dynein activities at the nuclear envelope during nuclear migration. Dev. Biol. 338, 237-250. 10.1016/j.ydbio.2009.12.004 [DOI] [PMC free article] [PubMed] [Google Scholar]
- Friedl P., Wolf K. and Lammerding J. (2011). Nuclear mechanics during cell migration. Curr. Opin. Cell Biol. 23, 55-64. 10.1016/j.ceb.2010.10.015 [DOI] [PMC free article] [PubMed] [Google Scholar]
- Gomes E. R., Jani S. and Gundersen G. G. (2005). Nuclear movement regulated by Cdc42, MRCK, myosin, and actin flow establishes MTOC polarization in migrating cells. Cell 121, 451-463. 10.1016/j.cell.2005.02.022 [DOI] [PubMed] [Google Scholar]
- Gönczy P. (2008). Mechanisms of asymmetric cell division: flies and worms pave the way. Nat. Rev. Mol. Cell Biol. 9, 355-366. 10.1038/nrm2388 [DOI] [PubMed] [Google Scholar]
- Gundersen G. G. and Worman H. J. (2013). Nuclear positioning. Cell 152, 1376-1389. 10.1016/j.cell.2013.02.031 [DOI] [PMC free article] [PubMed] [Google Scholar]
- Ketema M., Wilhelmsen K., Kuikman I., Janssen H., Hodzic D. and Sonnenberg A. (2007). Requirements for the localization of nesprin-3 at the nuclear envelope and its interaction with plectin. J. Cell Sci. 120, 3384-3394. 10.1242/jcs.014191 [DOI] [PubMed] [Google Scholar]
- Kim D. H., Cho S. and Wirtz D. (2014). Tight coupling between nucleus and cell migration through the perinuclear actin cap. J. Cell Sci. 127, 2528-2541. 10.1242/jcs.144345 [DOI] [PMC free article] [PubMed] [Google Scholar]
- Lele T. P., Pendse J., Kumar S., Salanga M., Karavitis J. and Ingber D. E. (2006). Mechanical forces alter zyxin unbinding kinetics within focal adhesions of living cells. J. Cell. Physiol. 207, 187-194. 10.1002/jcp.20550 [DOI] [PubMed] [Google Scholar]
- Levy J. R. and Holzbaur E. L. (2008). Dynein drives nuclear rotation during forward progression of motile fibroblasts. J. Cell Sci. 121, 3187-3195. 10.1242/jcs.033878 [DOI] [PMC free article] [PubMed] [Google Scholar]
- Liu Z., Tan J. L., Cohen D. M., Yang M. T., Sniadecki N. J., Ruiz S. A., Nelson C. M. and Chen C. S. (2010). Mechanical tugging force regulates the size of cell-cell junctions. Proc. Natl. Acad. Sci. USA 107, 9944-9949. 10.1073/pnas.0914547107 [DOI] [PMC free article] [PubMed] [Google Scholar]
- Lo C. M., Wang H. B., Dembo M. and Wang Y. L. (2000). Cell movement is guided by the rigidity of the substrate. Biophys. J. 79, 144-152. 10.1016/S0006-3495(00)76279-5 [DOI] [PMC free article] [PubMed] [Google Scholar]
- Lovett D. B., Shekhar N., Nickerson J. A., Roux K. J. and Lele T. P. (2013). Modulation of nuclear shape by substrate rigidity. Cell Mol. Bioeng. 6, 230-238. 10.1007/s12195-013-0270-2 [DOI] [PMC free article] [PubMed] [Google Scholar]
- Luxton G. W. and Gundersen G. G. (2011). Orientation and function of the nuclear-centrosomal axis during cell migration. Curr. Opin. Cell Biol. 23, 579-588. 10.1016/j.ceb.2011.08.001 [DOI] [PMC free article] [PubMed] [Google Scholar]
- Luxton G. W., Gomes E. R., Folker E. S., Vintinner E. and Gundersen G. G. (2010). Linear arrays of nuclear envelope proteins harness retrograde actin flow for nuclear movement. Science 329, 956-959. 10.1126/science.1189072 [DOI] [PMC free article] [PubMed] [Google Scholar]
- Machacek M., Hodgson L., Welch C., Elliott H., Pertz O., Nalbant P., Abell A., Johnson G. L., Hahn K. M. and Danuser G. (2009). Coordination of Rho GTPase activities during cell protrusion. Nature 461, 99-103. 10.1038/nature08242 [DOI] [PMC free article] [PubMed] [Google Scholar]
- Mammoto T., Mammoto A. and Ingber D. E. (2013). Mechanobiology and developmental control. Annu. Rev. Cell Dev. Biol. 29, 27-61. 10.1146/annurev-cellbio-101512-122340 [DOI] [PubMed] [Google Scholar]
- Maniotis A. J., Chen C. S. and Ingber D. E. (1997). Demonstration of mechanical connections between integrins, cytoskeletal filaments, and nucleoplasm that stabilize nuclear structure. Proc. Natl. Acad. Sci. USA 94, 849-854. 10.1073/pnas.94.3.849 [DOI] [PMC free article] [PubMed] [Google Scholar]
- Meyerzon M., Fridolfsson H. N., Ly N., McNally F. J. and Starr D. A. (2009). UNC-83 is a nuclear-specific cargo adaptor for kinesin-1-mediated nuclear migration. Development 136, 2725-2733. 10.1242/dev.038596 [DOI] [PMC free article] [PubMed] [Google Scholar]
- Minc N., Burgess D. and Chang F. (2011). Influence of cell geometry on division-plane positioning. Cell 144, 414-426. 10.1016/j.cell.2011.01.016 [DOI] [PMC free article] [PubMed] [Google Scholar]
- Munevar S., Wang Y. and Dembo M. (2001). Traction force microscopy of migrating normal and H-ras transformed 3T3 fibroblasts. Biophys. J. 80, 1744-1757. 10.1016/S0006-3495(01)76145-0 [DOI] [PMC free article] [PubMed] [Google Scholar]
- Petrie R. J., Koo H. and Yamada K. M. (2014). Generation of compartmentalized pressure by a nuclear piston governs cell motility in a 3D matrix. Science 345, 1062-1065. 10.1126/science.1256965 [DOI] [PMC free article] [PubMed] [Google Scholar]
- Postel R., Ketema M., Kuikman I., de Pereda J. M. and Sonnenberg A. (2011). Nesprin-3 augments peripheral nuclear localization of intermediate filaments in zebrafish. J. Cell Sci. 124, 755-764. 10.1242/jcs.081174 [DOI] [PubMed] [Google Scholar]
- Roth S., Neuman-Silberberg F. S., Barcelo G. and Schüpbach T. (1995). cornichon and the EGF receptor signaling process are necessary for both anterior-posterior and dorsal-ventral pattern formation in Drosophila. Cell 81, 967-978. 10.1016/0092-8674(95)90016-0 [DOI] [PubMed] [Google Scholar]
- Roux K. J., Crisp M. L., Liu Q., Kim D., Kozlov S., Stewart C. L. and Burke B. (2009). Nesprin 4 is an outer nuclear membrane protein that can induce kinesin-mediated cell polarization. Proc. Natl. Acad. Sci. USA 106, 2194-2199. 10.1073/pnas.0808602106 [DOI] [PMC free article] [PubMed] [Google Scholar]
- Sims J. R., Karp S. and Ingber D. E. (1992). Altering the cellular mechanical force balance results in integrated changes in cell, cytoskeletal and nuclear shape. J. Cell Sci. 103, 1215-1222. [DOI] [PubMed] [Google Scholar]
- Starr D. A. (2007). Communication between the cytoskeleton and the nuclear envelope to position the nucleus. Mol. Biosyst. 3, 583-589. 10.1039/b703878j [DOI] [PMC free article] [PubMed] [Google Scholar]
- Swift J., Ivanovska I. L., Buxboim A., Harada T., Dingal P. C., Pinter J., Pajerowski J. D., Spinler K. R., Shin J. W., Tewari M. et al. (2013). Nuclear lamin-A scales with tissue stiffness and enhances matrix-directed differentiation. Science 341, 1240104 10.1126/science.1240104 [DOI] [PMC free article] [PubMed] [Google Scholar]
- Versaevel M., Grevesse T. and Gabriele S. (2012). Spatial coordination between cell and nuclear shape within micropatterned endothelial cells. Nat. Commun. 3, 671 10.1038/ncomms1668 [DOI] [PubMed] [Google Scholar]
- Wang N., Tytell J. D. and Ingber D. E. (2009). Mechanotransduction at a distance: mechanically coupling the extracellular matrix with the nucleus. Nat. Rev. Mol. Cell Biol. 10, 75-82. 10.1038/nrm2594 [DOI] [PubMed] [Google Scholar]
- Wang X., He L., Wu Y. I., Hahn K. M. and Montell D. J. (2010). Light-mediated activation reveals a key role for Rac in collective guidance of cell movement in vivo. Nat. Cell Biol. 12, 591-597. 10.1038/ncb2061 [DOI] [PMC free article] [PubMed] [Google Scholar]
- Wilhelmsen K., Litjens S. H., Kuikman I., Tshimbalanga N., Janssen H., van den Bout I., Raymond K. and Sonnenberg A. (2005). Nesprin-3, a novel outer nuclear membrane protein, associates with the cytoskeletal linker protein plectin. J. Cell Biol. 171, 799-810. 10.1083/jcb.200506083 [DOI] [PMC free article] [PubMed] [Google Scholar]
- Wilson M. H. and Holzbaur E. L. (2012). Opposing microtubule motors drive robust nuclear dynamics in developing muscle cells. J. Cell Sci. 125, 4158-4169. 10.1242/jcs.108688 [DOI] [PMC free article] [PubMed] [Google Scholar]
- Wu Y. I., Frey D., Lungu O. I., Jaehrig A., Schlichting I., Kuhlman B. and Hahn K. M. (2009). A genetically encoded photoactivatable Rac controls the motility of living cells. Nature 461, 104-108. 10.1038/nature08241 [DOI] [PMC free article] [PubMed] [Google Scholar]
- Wu J., Lee K. C., Dickinson R. B. and Lele T. P. (2011). How dynein and microtubules rotate the nucleus. J. Cell. Physiol. 226, 2666-2674. 10.1002/jcp.22616 [DOI] [PubMed] [Google Scholar]
- Wu J., Kent I. A., Shekhar N., Chancellor T. J., Mendonca A., Dickinson R. B. and Lele T. P. (2014). Actomyosin pulls to advance the nucleus in a migrating tissue cell. Biophys. J. 106, 7-15. 10.1016/j.bpj.2013.11.4489 [DOI] [PMC free article] [PubMed] [Google Scholar]
- Zhang X., Xu R., Zhu B., Yang X., Ding X., Duan S., Xu T., Zhuang Y. and Han M. (2007). Syne-1 and Syne-2 play crucial roles in myonuclear anchorage and motor neuron innervation. Development 134, 901-908. 10.1242/dev.02783 [DOI] [PubMed] [Google Scholar]
- Zhao T., Graham O. S., Raposo A. and St Johnston D. (2012). Growing microtubules push the oocyte nucleus to polarize the Drosophila dorsal-ventral axis. Science 336, 999-1003. 10.1126/science.1219147 [DOI] [PMC free article] [PubMed] [Google Scholar]
Associated Data
This section collects any data citations, data availability statements, or supplementary materials included in this article.