

Abstract
Specific details concerning the spatial organization of nucleosomes in 30 nm fibers remain unknown. To investigate this, we analyzed all stereochemically possible configurations of two-start nucleosome fibers with short DNA linkers L = 13–37 bp (nucleosome repeat length (NRL) = 160–184 bp). Four superhelical parameters—inclination of nucleosomes, twist, rise, and diameter—uniquely describe a regular symmetric fiber. The energy of a fiber is defined as the sum of four terms: elastic energy of the linker DNA, steric repulsion, electrostatics, and a phenomenological (H4 tail–acidic patch) interaction between two stacked nucleosomes. By optimizing the fiber energy with respect to the superhelical parameters, we found two types of topological transition in fibers (associated with the change in inclination angle): one caused by an abrupt 360° change in the linker DNA twisting (change in the DNA linking number, ΔLk = 1), and another caused by overcrossing of the linkers (ΔLk = 2). To the best of our knowledge, this topological polymorphism of the two-start fibers was not reported in the computations published earlier. Importantly, the optimal configurations of the fibers with linkers L = 10n and 10n + 5 bp are characterized by different values of the DNA linking number—that is, they are topologically different. Our results are consistent with experimental observations, such as the inclination 60° to 70° (the angle between the nucleosomal disks and the fiber axis), helical rise, diameter, and left-handedness of the fibers. In addition, we make several testable predictions, among them different degrees of DNA supercoiling in fibers with L = 10n and 10n + 5 bp, different flexibility of the two types of fibers, and a correlation between the local NRL and the level of transcription in different parts of the yeast genome.
Introduction
The structure of nucleosome, the basic unit of DNA organization in eukaryotic chromatin, was determined with atomic resolution more than a decade ago (1). However, stereochemical details of the next level in the hierarchical organization of DNA in chromatin are still the subject of intense debate (reviewed in (2–5)). Among different models proposed to describe the spatial arrangement of nucleosomes in the so-called 30 nm fiber, the solenoid (6–8) and the two-start (9–13) conformations are probably the best known. The x-ray structure of a tetranucleosome solved by Schalch et al. (10) and Cryo-EM images obtained by Song et al. (11) support the two-start organization. On the other hand, the Cryo-EM data presented by Robinson et al. (7) support the solenoid (interdigitated) model. Based on single-molecule pulling experiments, Kruithof et al. (8) suggested that both spatial nucleosome arrangements occur, and that the linker length, L, determines which arrangement is more favorable: the two-start fiber is more stable for short linkers (e.g., L = 20 bp), whereas the solenoid is formed when linkers are 50 bp or longer.
All the results mentioned above were obtained using arrays of strongly positioned 601 nucleosomes (14), with the nucleosome repeat length (NRL) varying from 167 to 237 bp in increments of 10 bp. Assuming that the nucleosome core is 147 bp, this means that the linker L belongs to the {10n} series. Only recently, Correll et al. (12) analyzed nucleosome arrays with L = 25 bp (NRL = 172 bp) and demonstrated that they have a stronger preference for the unfolded state compared with the arrays with L = 20 or 30 bp. The increased fiber plasticity observed for L = 25 bp may be functionally significant because this linker length belongs to the same {10n + 5} series as the L = 15 bp, known to be predominant in yeast chromatin (15–17). According to the earlier biochemical data (18), linker sizes in the higher eukaryotes are also close to {10n + 5}.
The distinct charge-dependent folding pathways observed for fibers with L = 10n and L = 10n + 5 (12) suggest different morphologies, and in particular, different spatial arrangements of DNA linkers in these fibers. Various mechanical models of the fiber have been proposed earlier (13,19,20), with linking number ΔLk varying from 0 to –2 per nucleosome, depending on the linker DNA configuration. In principle, computational analysis could shed light on the molecular mechanisms responsible for this topological polymorphism.
However, most of the computational studies of chromatin fibers did not focus on their topological properties. The early studies were based on the two-angle model introduced by Woodcock et al. (21), where the linker DNA was considered to be a straight rod (22,23). Later, elastic energy terms were added to the model, to account for the linker bending and twisting (24–26). Eventually, the number of independent parameters in the regular fiber model was increased up to six in the study by Koslover et al. (27). The regular fibers were also considered by Scipioni et al. (28) who optimized torsional energy of the linker DNA both for the two-start helices and for the solenoid (interdigitated) structures. In addition, several groups used Monte Carlo simulations to study the influence of charges on structural variability of chromatin fibers (29,30) including formation of loops (31). Recently, Nam and Arya (32) analyzed topological variants of the chromatin fibers under external torsional forces, applying Brownian dynamics to an array of nucleosomes with the fixed linker size L ≈ 60 bp. Still, it should be noted that the topological polymorphism inherent in the chromatin fibers (and its relation to the linker length) was not addressed explicitly in the computer modeling studies mentioned above.
In this study, we make a systematic analysis of all stereochemically possible two-start left-handed configurations of the chromatin fiber, paying special attention to topological polymorphism. We focus on the two-start fibers, as it allows us to compare our results with the high-resolution models based on x-ray (10) and Cryo-EM data (11). We limit our analysis to the relatively short linkers, L = 13 to 37 bp, to exclude the possible formation of solenoid-type structures observed for the long linkers (7,8). We are mostly interested in the left-handed configurations, because the small-angle x-ray scattering analysis performed by Williams et al. (13) suggests formation of left-handed nucleosome fibers in solution. In addition to DNA elastic energy and steric restraints (27,28), our model includes electrostatic and H4 tail–acidic patch interactions. We demonstrate that for each linker L, in addition to the conformers described earlier (10,11,27–31) there is a novel family of topoisomers with different ΔLk that may be biologically relevant. We also show that the right-handed fibers are energetically less favorable than the left-handed ones. Finally, we propose specific ways to check the validity of our theoretical findings.
Materials and Methods
Arrangement of nucleosomes in chromatin fiber
We consider symmetric regular fibers—that is, the fibers that retain the same shape if they are turned upside down, and whose linkers have the same conformation. In this case, the fiber geometry is described by four parameters, three of which specify positions of nucleosome centers in a cylindrical coordinate frame (Fig. 1 A): radius r, rise h, and polar angle φ or the twist angle between consecutive nucleosomes (27). This angle determines the number of stacks, N, in the fiber: N ≈ 360°/φ. For instance, φ = 120° corresponds to the three-stack fiber (N = 3).
Figure 1.
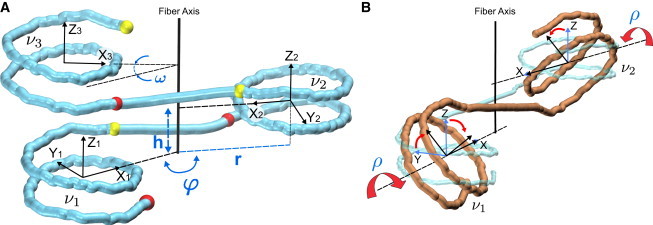
Definition of the chromatin fiber parameters. (A) Cylindrical parameters h (rise), r (radius), and polar angle φ. This angle determines the superhelical fiber twist: ω = 2φ –360° (the polar angle between the centers of nucleosomes ν1 and ν3). In this particular case, φ = 165° and ω = –30°. The entry points of nucleosomes are shown as red balls, and the exit points as yellow balls. Each nucleosome is associated with a right-handed coordinate frame in which axis Z represents the superhelical axis of the nucleosome (calculated as described in (44)), axis X points toward the nucleosome dyad, and axis Y is perpendicular to X and Z. (B) Inclination angle ρ (defining rotation around the dyad axis X) is related to the angle γ measured by electric dichroism (39–41), which is the angle between the Y axis and the fiber axis. These two angles are related by equation γ = | 90° – | ρ | |. Increasing the inclination angle by Δρ leads to decreasing the total twisting of the linker between nucleosomes ν1 and ν2 by ∼2Δρ. The images were prepared with the VMD software package (45). To see this figure in color, go online.
The superhelical fiber twist is defined as ω = 2φ – 360°. Since we are mostly interested in the two-stack left-handed fibers, we set the value of φ to vary between 150° and 180°. (The values of φ > 180° will give rise to right-handed structures). The radius and rise values were not restrained.
The fourth parameter, ρ, defines inclination of nucleosomes relative to the fiber axis (Fig. 1 B). In general, orientation of a nucleosome would be defined by three rotations around the X, Y, and Z axes (Fig. 1 A). If, however, symmetric fibers are considered, then only one rotation around the dyad axis X, ρ, is permitted (Fig. 1 B); rotations around the Y and Z axes would break the symmetry.
If the nucleosomes were disconnected, variation of the inclination angle ρ from 0° to 180° would cover all possible structures of a chromatin fiber. However, because the DNA linkers connect the exit and the entry points in consecutive nucleosomes in a fixed order (see the red and yellow balls in Fig. 1 A), variation of the angle ρ by 180° is not sufficient. A comprehensive analysis of all possible fiber structures requires variation of this angle by 360°. This consideration distinguishes our approach from the studies published earlier (27,28).
To calculate the optimal geometry of the internucleosomal linkers, we used numeric minimization (see Supporting Material).
Energy terms
Four energy terms are considered in our calculations: elastic, electrostatic, and histone H4 tail–acidic patch interactions, as well as the steric hindrance term.
-
1)
The elastic energy of the linker DNA deformations is calculated using the knowledge-based potential functions introduced by Olson et al. (33) (see Supporting Material).
-
2)
The electrostatic energy is calculated using the Coulomb potential with 30 Å cutoff and the water dielectric constant ε = 78. The DNA charges are partially neutralized because of the salt screening effect (see Supporting Material). In addition, we made computations with the Debye-Huckel potential (see Supporting Material).
-
3)
The H4 tail–acidic patch interactions are modeled phenomenologically, with the minimum of the internucleosome interaction –8 kT (see Supporting Material).
-
4)
Steric clashes are modeled by a van der Waals-like repulsion potential (see Supporting Material). Note that the nucleosome core particles (DNA and histones) are considered to be rigid in our computations.
Computation of DNA writhing and linking number
To evaluate the topological changes occurring in DNA on formation of a nucleosome fiber, we use three topological parameters: ΔTw (the change in DNA twisting); DNA writhing, Wr; and the change in the linking number, ΔLk (compared with the relaxed state of DNA) (34–36). To calculate the DNA writhing, Wr, we use the quadrangle method described by Levitt (37) and Klenin and Langowski (38). Topological parameters Wr and ΔLk are only meaningful for closed or restrained-end DNA. Therefore, we added extra base pairs to close the DNA chain. There is no imposed superhelical density in our model. We find the minimum energy conformation for the free DNA and then close the ends and calculate the topological parameters. (For details, see Supporting Material.)
Results and Discussion
The twisting- and writhing-induced transitions in nucleosome fiber
The numerical results presented in this section were obtained mostly for the fibers with linker L = 20 bp (sometimes, for L = 25 bp); however, the observed trends are valid for the other L values as well. First, consider variability of the two-start nucleosome fiber (Fig. 2) when the angle ρ defining inclination of the nucleosome disk relative to the fiber axis (Fig. 1) changes from –180° to 180°. The fibers with ρ < –90° are energetically unfavorable (Fig. 3 A). Nevertheless, they are shown to illustrate the whole spectrum of the fiber conformations. Note that all these fibers have different geometry—see, for example, positions of the DNA entry points shown as red balls. This explains why one should consider the 360° variation of the inclination angle. (Also, see Movie S1 and Supporting Material.)
Figure 2.
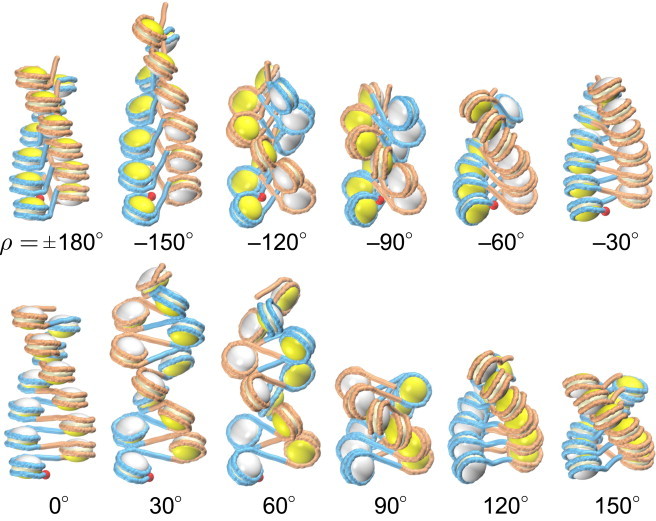
Two-start chromatin fibers with the linker L = 20 bp, with the inclination angle ρ changing from ±180° to 150°. All conformations correspond to the energetically optimal points (Fig. 3A). Note that all these structures are different—in particular, the fiber with ρ = –90° differs from the fiber with ρ = 90° (see positions of the DNA entry points shown as red balls). The DNA is presented in alternating blue and orange colors, to emphasize the two stacks of nucleosomes and to clarify the passage of linkers in the middle of the fiber. The histone cores are also shown in two colors: the entry sides of nucleosomes (interacting with the DNA entry points shown as red balls) are colored in yellow, and the exit sides are in white. In this way, it is easier to distinguish the fiber configurations. For example, for ρ = 0 the white sides of the cores face upward, whereas for ρ = 180° they face downward. To see this figure in color, go online.
Figure 3.
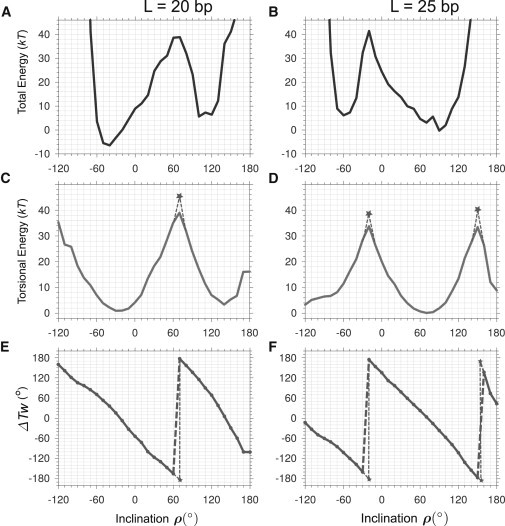
Energy profiles and DNA twisting for the chromatin fibers with the linkers L = 20 (A, C, and E) and 25 bp (B, D, and F). Each point corresponds to a minimum of the conformation energy in the space of three fiber parameters—radius, rise, and polar angle φ (Fig. 1A). Energy is very high for ρ < –120° so this region is omitted for clarity. (A and B) Total energy. (C and D) Torsional energy of the linker DNA. (E and F) Changes in the excess twisting, ΔTw, of the linker DNA as a function of the inclination angle ρ. The points shown by asterisks in (C)–(F) correspond to the linker DNA undertwisted or overtwisted by more than 180°. (See the main text for details.)
The changes in the fiber shape and dimension presented in Fig. 2 seem to be gradual, if we consider mainly the orientation of nucleosomes and linkers. If, however, we focus on the details of the DNA conformation and its energy, it becomes clear that the linker DNA undergoes two sharp transitions, one close to ρ = 60° and another around ρ = –120°. We will consider these transitions in more detail.
Type I transition
The increase in the angle ρ from 60° to 70° is accompanied by an abrupt ∼360° change in the DNA twisting (Fig. 3 E). This effect can be explained as follows. Increasing the inclination angle ρ by some amount Δρ leads to decreasing the total twisting of the linker by ∼2Δρ (Fig. 1 B). The optimal torsional energy of DNA corresponds to ρ ≈ –30° (Fig. 3 C). An increase in ρ by 90°, from –30° to 60°, brings about a significant ∼180° untwisting of the linker DNA (Fig. 3 E). As a consequence, the torsional energy of the DNA linker increases by ∼40 kT (Fig. 3 C).
A further increase in ρ, up to 70°, would be even more costly energetically if the changes in DNA conformation followed the same trend—that is, if the linker DNA untwisted by 183°, the torsional energy would exceed 43 kT (see the points shown by asterisks in Fig. 3, C and E). If, however, the linker DNA abruptly changes its conformation and becomes overtwisted at ρ = 70°, the DNA torsional energy will be less than that described above because overtwisting of the linker by 177° is more favorable than its undertwisting by 183° (Fig. 3, C and E). This conformational transition is illustrated in Fig. 4. An increase in the inclination angle ρ beyond the transition point brings additional relief in the DNA twisting tension (Fig. 3 C). As a result, the second minimum of the DNA torsional energy is achieved for the inclination angle ρ = 140°, whereas the local minimum of the total energy is observed for ρ = 100° to 120° (Fig. 3 A).
Figure 4.
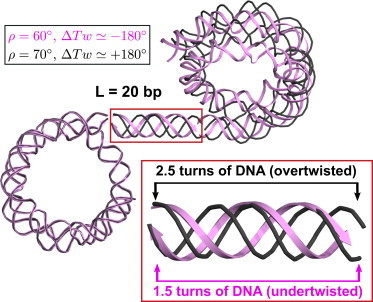
Abrupt change in the linker DNA excess twisting, ΔTw, caused by increase in the inclination angle ρ. For ρ = 60° (pink ribbon) the linker DNA is undertwisted by ∼180°. For ρ = 70° (black wire) the linker DNA is overtwisted by ∼180°. The nucleosomes on the left are superimposed. The images were prepared with the Chimera software package (46). Inset: the DNA twisting differs by one helical turn (∼360°) in the two linkers. Compare the black wires representing ∼2.5 turns of DNA in the case of ρ = 70° with the pink ribbons corresponding to ∼1.5 helical turns (ρ = 60°). To see this figure in color, go online.
Note that for closed DNA (or for DNA with the fixed ends) the twist-induced transition described above is practically impossible without type I topoisomerase because in such a case, each nucleosome has to rotate by ∼360° relative to its neighbor to achieve this topological change. Moreover, this twisting will accumulate, that is, the third nucleosome will rotate relative to the first one by ∼720°, and the fourth nucleosome will rotate by ∼1080°, and so on.
Type II transition
At approximately ρ = –120° we encounter another type of sharp transition caused by the change in DNA writhing, Wr. If we compare the two fiber structures with ρ = –130° and ρ = –110° (Fig. 5, A and C), in the first case the two bottom linkers shown in blue are positioned above the linker shown in orange, whereas in the second case, the blue linkers are positioned below the orange one. This change in the spatial arrangement of linkers is accompanied by DNA passing through itself (Fig. 5 B) and leads to a sharp increase in DNA writhing by ±2. This is a typical example of the topological transition in DNA induced by type II topoisomerase (Topo II).
Figure 5.
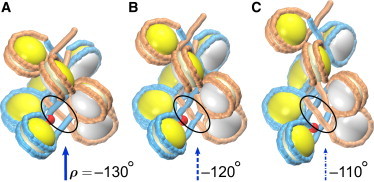
The writhing-induced transition occurring in the chromatin fiber with the linker L = 20 bp. Note the different mutual positioning of linkers in the fibers with ρ = –130°, –120°, and –110° (A, B, and C, respectively). (A) The two bottom linkers shown in blue are positioned above the linker shown in orange (solid blue arrow). (B) Overcrossing (intersection) of the blue and orange DNA linkers (dotted-line blue arrow). (C) The two bottom blue linkers are positioned below the orange linker (dash-and-dot blue arrow). To see this figure in color, go online.
Thus, we see that the conformational space of nucleosome fibers with linker L = 20 bp is characterized by two local energy minima surrounded by topological barriers. In this regard, the fibers with L = 25 bp are qualitatively similar to the fibers with L = 20 bp, but the torsional energy minima and maxima are positioned differently (Fig. 3 D). The exact values of DNA writhing and twisting, as well as their dependence on the linker length and inclination angle ρ are discussed below.
Energetically optimal conformations
As shown above, the torsional energy profiles for fibers with linkers L = 20 and 25 bp have two minima spaced ∼180° apart, with the energy values close to zero for both minima (Fig. 3, C and D). Consideration of other energy terms changes the balance between the two minima (Figs. 3, A and B, and S5 in the Supporting Material), while preserving the bimodality of the energy profiles. For other linker sizes, the same bimodal effect is visible in the energy landscape in the two-dimensional (2D) space (ρ, L) shown in Fig. 6. In terms of the inclination angle ρ, the dark blue regions with the lowest energy span either the –80° < ρ < –30°, or 80° < ρ < 120° interval. In terms of the linker length (along the vertical axis), this 2D landscape has a clear 10 to 11 bp periodicity, which reflects the helical period of B-DNA. In particular, the energy profiles for L = 20 and 30 bp are similar to each other, with the global energy minima appearing on the left side of the plot (negative ρ values), whereas for L = 15, 25, and 35 bp, the minima are on the right side (positive ρ values).
Figure 6.
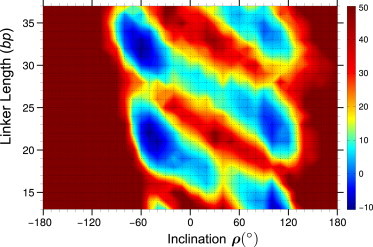
Total energy of the two-start fibers as a function of the inclination angle ρ and the linker length L. Optimization is made in the space of three remaining fiber parameters, i.e., radius, rise, and polar angle φ. Dark blue regions (negative energy) represent stable structures, whereas dark brown areas are those with energies higher than 50 kT. Cross-sections of this 2D map for linkers L = 20 and 25 bp are shown in Fig. 3, A and B. To see this figure in color, go online.
The optimal conformations for L = 20 and 30 bp have the inclination angle ρ ≈ –45° and –60°, respectively, which is in accord with models based on x-ray (10) and Cryo-EM data (11). Note that the blue and red elongated regions (with low and high energy, respectively) are tilted from top-left to bottom-right. This skewed energy landscape pattern is entirely consistent with the tilt of the contour lines for excess twisting, ΔTw, in Fig. 7 A.
Figure 7.

Variation of the three topological parameters as a function of the inclination angle ρ and the linker length L. The contour plots are consistent with the conformation energy map presented in Fig. 6. (A) The excess twisting of the linker DNA, ΔTw (compare with Fig. 3, E and F). The ΔTw values are expressed in the number of DNA helical turns (or degrees/360). (B) The writhing number per nucleosome, Wr. (C) Change in the linking number per nucleosome, ΔLk (relative to the relaxed state of DNA). See Fig. S12 for additional details. (D) Classification of the fiber conformations: three families of topoisomers. The cyan region represents family T2 with the lowest ΔLk values (approximately from –2.2 to –1.5). The yellow region corresponds to the family T1 with intermediate ΔLk (from –1.2 to –0.5). The highest ΔLk values define family T0 (approximately from 0 to 0.5). The ovals denote energetically optimal regions shown in Fig. 6. To see this figure in color, go online.
The brown areas to the left and right of the blue islands of stability have extremely high energy. The ρ < –90° region is unfavorable because of linker-linker and linker DNA-nucleosome clashes (see Fig. S5). For |ρ| > 130°, the DNA elastic energy is prohibitively high because of strong bending of the linkers (see the kinky DNA conformations in Fig. 2 and Movie S1). For details of the contributions of each energy term, see Fig. S5.
As to the central area between the low-energy blue regions, the fiber conformations with ρ = –20° to 60° are unfavorable for a number of reasons. The region around ρ = 0 is characterized by a partial loss of internucleosome stacking and high elastic energy of DNA (compare the structures with ρ = –30° to 30° in Fig. 2 to see the loss of stacking, and see Fig. S5). For the ρ angles between 20° and 60°, the adjacent nucleosomal DNA in the same stack (e.g., the two orange nucleosomes in Fig. 2, ρ = 30°, 60°) are colliding, thereby inducing electrostatic repulsion. In general, our results are consistent with the electric dichroism (ED) data suggesting strong inclination of nucleosomes in the fiber (39–41).
In addition, we analyzed the right-handed two-start fibers (180° < φ < 210°) and found that the linker-nucleosome clashes prevent close stacking of nucleosomes in this case; as a consequence, the minimum energy is higher than in the left-handed fibers (see Supporting Material). Apparently, the chirality of nucleosomes dictates the left-handedness of the chromatin fiber.
Topological changes in chromatin fibers with various linker lengths
To evaluate topological changes occurring in DNA on formation of a nucleosome fiber, we used three topological parameters: the change in DNA twisting, ΔTw; DNA writhing, Wr; and the change in the linking number, ΔLk—see Figs. S10 and S12 and Table S2.
Variation in linker DNA twisting as a function of the inclination angle ρ and the linker length L is presented in Fig. 7 A. This plot is a generalization of Fig. 3, E and F, where variation of ΔTw is shown for L = 20 and 25 bp. The difference is that in Fig. 3, E and F the excess twist values are given in degrees, whereas in Fig. 7 A they are given in DNA helical turns (i.e., degrees/360). The triple tilted contour lines denote the abrupt change in ΔTw from –0.5 to 0.5 (corresponding to the sharp increase in excess twisting from –180° to 180° in Fig. 3, E and F, see green arrows). The tilted contour lines also imply that ΔTw depends both on the angle ρ and the linker L.
By contrast, the contour lines in Fig. 7 B are nearly vertical. This means that the DNA writhing varies substantially with changes in the inclination, ρ, but practically does not depend on the linker length L. In particular, the abrupt changes in Wr from 0 to –2 occur at ρ = –120° (±10°) for all values of L (see red arrows). This sharp transition is accompanied by the over-crossing of DNA linkers as was described above for L = 20 bp (Fig. 5).
Adding together the excess twisting of the linker, ΔTw, and the writhing, Wr, we find the change in the DNA linking number, ΔLk = ΔTw + Wr (Fig. 7 C). The resulting contour plot represents a rather complicated pattern containing vertical, horizontal, and tilted lines. The tilted contour lines in Fig. 7 C originate from the skewed triple lines in Fig. 7 A, which highlight the abrupt changes in ΔTw from 0.5 to –0.5. Accordingly, ΔLk also changes by ∼1 (see green arrows intersecting tilted contour lines in Fig. 7, A and C). The multiple vertical lines at ρ ≈ –120° demarcate a stepwise transition in ΔLk, which originates from a similarly sharp transition in Wr visible in Fig. 7 B; both ΔLk and Wr values are changed by ∼2 (see red arrows).
The horizontal contour lines in Fig. 7 C are the result of summation of the ΔTw and Wr values. Despite the fact that both ΔTw and Wr strongly correlate with the inclination angle ρ (Fig. 7, A and B), the sum of these parameters looks like a piece-wise constant function of the angle ρ (Fig. S12).
All these findings taken together allow us to divide the two-start fiber topoisomers into three families, T2, T1, and T0 (Fig. 7 D). The structures with the lowest ΔLk values (from approximately –2.2 to –1.5) belong to the family T2. The fibers with intermediate ΔLk (from –1.2 to –0.5) comprise family T1. The highest ΔLk values define family T0 (from ∼0 to 0.5). The transition between families T2 and T1 is related to abrupt changes in DNA twisting (shown by green arrows in Fig. 7, A and C). The sharp transition between the families T0 and T2 is related to the sudden increase in DNA writhing (red arrows in Fig. 7, B and C). The ovals correspond to energetically optimal regions (Fig. 6). Importantly, the optimal topoisomers for L = 20 and 30 bp belong to the family T2, whereas for L = 15, 25, and 35 bp they belong to the family T1.
Optimal conformations for L = 20 and 25 bp are presented in Fig. 8. In terms of topology, the difference between the two families of structures is more obvious in the stretched forms. In particular, it is clear that in the case of T2 (Fig. 8 C) the nucleosomal DNA makes almost two complete turns—apparently more than in T1 (Fig. 8 F). Hence, the DNA writhing and linking number are larger in absolute value in the T2 structures (compare with Fig. 7).
Figure 8.
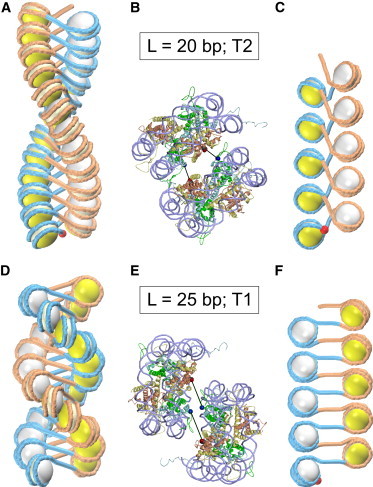
Topoisomers T2 and T1 for linkers L = 20 bp (A–C) and L = 25 bp (D–F), respectively. The optimal structure for L = 20 bp has inclination angle ρ = –45° and rise h = 27 Å (A and B); the optimal structure for L = 25 bp has ρ = 90° and h = 23 Å (D and E). The difference between the two families is clearly visible in the stretched forms with h = 55 Å (C and F). Note a more extensive folding of DNA in the nucleosomal disks in (C). This is consistent with the DNA writhing: Wr = –1.7 in (C) and Wr = –0.9 in (F). Red balls indicate the DNA entry points. The detailed representations in (B) and (E) show that there are no steric clashes between the stacked nucleosomes ν1 and ν3 (Fig. 1A). The internucleosome stacking is stabilized by the H4 tail-acidic patch bridges shown by black lines; the distances between Asp24 (H4) and Glu61 (H2A) are 23 Å in (B) and 34 Å in (E) (see Fig. S3 for details). To see this figure in color, go online.
In terms of stability, the two types of structures are also different. Direct visual comparison shows that the internucleosome stacking is stronger for L = 20 bp: the contact area is larger (Fig. 8 A) and the H4 tail–acidic patch bridge length (Fig. 8 B) is closer to the optimal value in this case. Accordingly, the numerical results indicate that the stacking energy is lower for L = 20 bp (Fig. S5) and the total energy minimum is deeper for L = 20 bp compared with L = 25 bp (Figs. 3, A and B, and 6). Overall, our computations strongly suggest that the T2 topoisomer for L = 20 bp is the most favorable energetically, whereas the T1 topoisomer for L = 25 bp is the best one.
The x-ray (10) and Cryo-EM data (11) provide strong support for stabilization of T2 topoisomers for L = 10n. In contrast, there is no direct evidence for formation of the T1 topoisomers. We believe this is because in all imaging studies except the one reported by Correll et al. (12), the linkers of type 10n + 5 were not analyzed. However, the linking number measurements suggest the presence of the T1 topoisomer, at least in SV40 minichromosomes (42,43).
Conclusions
We performed a thorough analysis of stereochemically feasible two-start chromatin fibers with internucleosome linkers varying from 13 to 37 bp. For each linker length, we found three families of topoisomers characterized by different linking number values (Fig. 7 D). The families are separated by topological barriers—that is, conformational transition between the structures belonging to different families is only possible in the presence of cutting-closing enzymes (topoisomerases of type I or II) for closed or restrained-end fiber. Depending on the linker length, the most favorable topoisomer belongs either to family T2 (ΔLk ≈ –1.5 to –2.2), or to family T1 (ΔLk ≈ –0.5 to –1.2) (Figs. 6 and 7 D). Existence of the two families of structures with different linking numbers is consistent with the earlier observations of Williams et al. (13) who built space-filling models of the crossed-linker fibers with ΔLk = –1 and –2. The family T0 comprises highly unfavorable conformations, at least concerning the short linkers in this study (Fig. 7 D).
In this study we focused on the relationship between the DNA linker length and the fiber topology. We found that although in terms of torsional energy both topoisomers T1 and T2 are equally feasible, adding all energy terms together makes one topoisomer preferable to the other. One of our most important conclusions is that for linkers L = 10n, the topoisomer T2 is more favorable, whereas for linkers L = 10n + 5 the topoisomer T1 is the optimal conformation. The superhelical density of DNA in the optimal fiber structures (σ = –0.09 and σ = –0.06 for L = 20 and 25 bp, respectively) is in the range of values observed experimentally (47) (see Supporting Material). These values give an estimate of the torsional stress experienced by DNA were the histones to be removed.
The T1 topoisomer (with L = 25 bp) demonstrates a higher bending and stretching flexibility compared with the T2 topoisomer (with L = 20 bp). This may be explained by the fact that nucleosomes are strongly inclined in the T1 form (Fig. 8), and the internucleosome stacking interactions are less sensitive to deformations of the fiber (data not shown). Our data complement what was recently found by Clauvelin et al. (48) about the effects of linker length on the interactions and deformability of simulated nucleosome arrays. Note that our results are in accord with the findings of Correll et al. (12) suggesting that in the absence of the linker histone the fibers with L = 10n +5 are less stable than the fibers with L = 10n. In fact, our study was motivated by these findings (12); before 2012 there were no experimental data indicating that folding of the chromatin fiber periodically depends on the changes in linker DNA length.
To the best of our knowledge, such a detailed computational search of energetically favorable two-start fiber conformations has not been previously carried out. The critical difference between our approach and those used by others (27–31) is that we considered all possible orientations of the nucleosomal disks relative to the fiber axis, resulting in all possible topologies. (That is, we allowed a 360° range of variation for the inclination angle ρ—see Figs. 1 and 2.) By contrast, Koslover et al. (27) varied the nucleosome inclination angle β in the interval only between 0° and 180° (see their Fig. 5). Similarly, Scipioni et al. (28) also did not investigate the entire phase space of the fiber conformations. The two-start fibers analyzed in these studies closely resemble the x-ray-based model by Schalch et al. (10) and belong to the family T2; the T1 conformations were not considered.
According to the ED measurements (39–41), nucleosomes are strongly inclined in fibers. The angle between the nucleosome disks and the fiber axis, γ = | 90° – | ρ | |, is estimated to be ∼20° to 30° for various chromatin fibers with mixed internucleosome spacing. In terms of the inclination angle ρ used in this study (Fig. 1), the average value of |ρ| is ∼60° to 70°. Our computations also suggest that the angle ρ significantly deviates from zero in the optimal conformations from both topological families: |ρ| = 40° to 60° for the T2, and 80° to 90° for the T1 family (Fig. 6), or |ρ| ≈ 65° on average. Assuming that the fractions of topoisomers T1 and T2 are comparable in the fibers used for ED measurements, we conclude that our results are generally consistent with experimental data.
It can be argued that there are multiple ways to take into account the electrostatic potential. In this study we chose to employ the Coulomb potential with a 30 Å cutoff and charge reduction because of salt screening. We also used the Debye-Huckel potential; importantly, the overall results did not change significantly (see Supporting Material). The other critical issue is modeling of the internucleosome stacking interaction. Here, it is described with a phenomenological potential (see Supporting Material) whose depth, –8 kT, is taken as the average of the two experimental values obtained by fiber stretching (8,49). It would be interesting to see how using more rigorous physical approximations would change the exact energy landscape for the internucleosome stacking interaction. We found, however, that varying the potential depth practically does not affect the total energy profiles (see Fig. S4). Entropy has not been considered in our model explicitly. However, at the qualitative level we can estimate the entropy of conformational states comparing the widths of corresponding energy minima. In this way, one can see that the optimal energy minima (Fig. 3, A and B) are more favorable entropically than the secondary minima (because their energy profiles are wider). In summary, we conclude that the final results, especially the topological classification of the stereochemically feasible fiber conformations, are essentially independent of the numerical details of the potentials selected to model the histone-DNA interactions.
Potentially, any kind of chromatin polymorphism (structural and/or topological) is interesting from the point of view of gene regulation. The expected general implications of this study is that it may reveal new mechanisms for encoding structural information in a nucleosome array in the form of alternative topological states (i.e., topological switch between the T1 and T2 topoisomers).
The topological and structural aspects of our findings can be tested both in vitro and in vivo. First, employing the approach used by Simpson et al. (50) and Norton et al. (51), one can measure the number of superhelical turns in covalently closed DNA induced by formation of precisely positioned 601 nucleosomes (14) separated by linkers L = 20 or 25 bp. In this way, it is possible to detect the difference in linking number between the topoisomers T1 and T2 predicted by our model (Figs. 7 D and 8).
Second, the increased flexibility of the T1 topoisomer (with L = 10n + 5) compared with the T2 topoisomer (with L = 10n) may be utilized by cell in differential folding of the functionally distinct parts of the genome. In particular, we hypothesize that the highly and lowly expressed genes may have different average NRL values. To test this hypothesis, we analyzed high-resolution nucleosome positioning data in yeast (17,52) and found that there is a strong correlation between the level of expression and local nucleosome spacing: the average NRL = 161 to 162 bp for highly active genes (i.e., linker L = 14 to 15 bp), whereas NRL = 167 to 168 bp (i.e., linker L = 20 to 21 bp) for less frequently transcribed genes (A. Katebi, D.N., F. Cui, and V.B.Z., unpublished observation). A possible explanation of this correlation is that the greater plasticity of the fibers with L ≈ 10n + 5 may facilitate formation of gene loops (53,54), thereby inducing transcription of the corresponding genes.
The observed correlation may reflect a more general tendency of chromosomal domains containing active or repressed genes to retain topologically distinct higher-order structures. It remains to be seen whether this topological mechanism of transcription regulation is applicable to higher eukaryotes, but the available information (55) suggests that the changes in NRL on cell differentiation in mice follow the same trend as described above for yeast.
Author Contributions
V.B.Z. designed research; D.N. performed research; and D.N. and V.B.Z. analyzed data and wrote the article.
Acknowledgments
We are grateful to Wilma Olson and Sergei Grigoryev for sharing their unpublished observations and valuable discussions and to George Leiman for text editing. We appreciate constructive critical remarks by anonymous reviewers. The research was supported by the NIH Intramural Research Program.
Supporting Material
References
- 1.Davey C.A., Sargent D.F., Richmond T.J. Solvent mediated interactions in the structure of the nucleosome core particle at 1.9 a resolution. J. Mol. Biol. 2002;319:1097–1113. doi: 10.1016/S0022-2836(02)00386-8. [DOI] [PubMed] [Google Scholar]
- 2.Tremethick D.J. Higher-order structures of chromatin: the elusive 30 nm fiber. Cell. 2007;128:651–654. doi: 10.1016/j.cell.2007.02.008. [DOI] [PubMed] [Google Scholar]
- 3.van Holde K., Zlatanova J. Chromatin fiber structure: where is the problem now? Semin. Cell Dev. Biol. 2007;18:651–658. doi: 10.1016/j.semcdb.2007.08.005. [DOI] [PubMed] [Google Scholar]
- 4.Schlick T., Hayes J., Grigoryev S. Toward convergence of experimental studies and theoretical modeling of the chromatin fiber. J. Biol. Chem. 2012;287:5183–5191. doi: 10.1074/jbc.R111.305763. [DOI] [PMC free article] [PubMed] [Google Scholar]
- 5.Luger K., Dechassa M.L., Tremethick D.J. New insights into nucleosome and chromatin structure: an ordered state or a disordered affair? Nat. Rev. Mol. Cell Biol. 2012;13:436–447. doi: 10.1038/nrm3382. [DOI] [PMC free article] [PubMed] [Google Scholar]
- 6.Routh A., Sandin S., Rhodes D. Nucleosome repeat length and linker histone stoichiometry determine chromatin fiber structure. Proc. Natl. Acad. Sci. USA. 2008;105:8872–8877. doi: 10.1073/pnas.0802336105. [DOI] [PMC free article] [PubMed] [Google Scholar]
- 7.Robinson P.J.J., Fairall L., Rhodes D. EM measurements define the dimensions of the ‘30-nm’ chromatin fiber: evidence for a compact, interdigitated structure. Proc. Natl. Acad. Sci. USA. 2006;103:6506–6511. doi: 10.1073/pnas.0601212103. [DOI] [PMC free article] [PubMed] [Google Scholar]
- 8.Kruithof M., Chien F.T., van Noort J. Single-molecule force spectroscopy reveals a highly compliant helical folding for the 30-nm chromatin fiber. Nat. Struct. Mol. Biol. 2009;16:534–540. doi: 10.1038/nsmb.1590. [DOI] [PubMed] [Google Scholar]
- 9.Dorigo B., Schalch T., Richmond T.J. Nucleosome arrays reveal the two-start organization of the chromatin fiber. Science. 2004;306:1571–1573. doi: 10.1126/science.1103124. [DOI] [PubMed] [Google Scholar]
- 10.Schalch T., Duda S., Richmond T.J. X-ray structure of a tetranucleosome and its implications for the chromatin fibre. Nature. 2005;436:138–141. doi: 10.1038/nature03686. [DOI] [PubMed] [Google Scholar]
- 11.Song F., Chen P., Li G. Cryo-EM study of the chromatin fiber reveals a double helix twisted by tetranucleosomal units. Science. 2014;344:376–380. doi: 10.1126/science.1251413. [DOI] [PubMed] [Google Scholar]
- 12.Correll S.J., Schubert M.H., Grigoryev S.A. Short nucleosome repeats impose rotational modulations on chromatin fibre folding. EMBO J. 2012;31:2416–2426. doi: 10.1038/emboj.2012.80. [DOI] [PMC free article] [PubMed] [Google Scholar]
- 13.Williams S.P., Athey B.D., Langmore J.P. Chromatin fibers are left-handed double helices with diameter and mass per unit length that depend on linker length. Biophys. J. 1986;49:233–248. doi: 10.1016/S0006-3495(86)83637-2. [DOI] [PMC free article] [PubMed] [Google Scholar]
- 14.Lowary P.T., Widom J. New DNA sequence rules for high affinity binding to histone octamer and sequence-directed nucleosome positioning. J. Mol. Biol. 1998;276:19–42. doi: 10.1006/jmbi.1997.1494. [DOI] [PubMed] [Google Scholar]
- 15.Lohr D.E. Detailed analysis of the nucleosomal organization of transcribed DNA in yeast chromatin. Biochemistry. 1981;20:5966–5972. doi: 10.1021/bi00524a007. [DOI] [PubMed] [Google Scholar]
- 16.Wang J.P., Fondufe-Mittendorf Y., Widom J. Preferentially quantized linker DNA lengths in Saccharomyces cerevisiae. PLOS Comput. Biol. 2008;4:e1000175. doi: 10.1371/journal.pcbi.1000175. [DOI] [PMC free article] [PubMed] [Google Scholar]
- 17.Cui F., Cole H.A., Zhurkin V.B. Transcriptional activation of yeast genes disrupts intragenic nucleosome phasing. Nucleic Acids Res. 2012;40:10753–10764. doi: 10.1093/nar/gks870. [DOI] [PMC free article] [PubMed] [Google Scholar]
- 18.Strauss F., Prunell A. Organization of internucleosomal DNA in rat liver chromatin. EMBO J. 1983;2:51–56. doi: 10.1002/j.1460-2075.1983.tb01379.x. [DOI] [PMC free article] [PubMed] [Google Scholar]
- 19.Grigoryev S.A., Ioffe L.B. The dependence of the linking number of a circular minichromosome upon the shape and the orientation of its nucleosomes. FEBS Lett. 1981;130:43–46. doi: 10.1016/0014-5793(81)80661-8. [DOI] [PubMed] [Google Scholar]
- 20.Worcel A., Strogatz S., Riley D. Structure of chromatin and the linking number of DNA. Proc. Natl. Acad. Sci. USA. 1981;78:1461–1465. doi: 10.1073/pnas.78.3.1461. [DOI] [PMC free article] [PubMed] [Google Scholar]
- 21.Woodcock C.L., Grigoryev S.A., Whitaker N. A chromatin folding model that incorporates linker variability generates fibers resembling the native structures. Proc. Natl. Acad. Sci. USA. 1993;90:9021–9025. doi: 10.1073/pnas.90.19.9021. [DOI] [PMC free article] [PubMed] [Google Scholar]
- 22.Schiessel H., Widom J., Gelbart W.M. Polymer reptation and nucleosome repositioning. Phys. Rev. Lett. 2001;86:4414–4417. doi: 10.1103/PhysRevLett.86.4414. [DOI] [PubMed] [Google Scholar]
- 23.Barbi M., Mozziconacci J., Victor J.M. How the chromatin fiber deals with topological constraints. Phys. Rev. E Stat. Nonlin. Soft Matter Phys. 2005;71:031910. doi: 10.1103/PhysRevE.71.031910. [DOI] [PubMed] [Google Scholar]
- 24.Wedemann G., Langowski J. Computer simulation of the 30-nanometer chromatin fiber. Biophys. J. 2002;82:2847–2859. doi: 10.1016/S0006-3495(02)75627-0. [DOI] [PMC free article] [PubMed] [Google Scholar]
- 25.Wong H., Victor J.M., Mozziconacci J. An all-atom model of the chromatin fiber containing linker histones reveals a versatile structure tuned by the nucleosomal repeat length. PLoS ONE. 2007;2:e877. doi: 10.1371/journal.pone.0000877. [DOI] [PMC free article] [PubMed] [Google Scholar]
- 26.Lanzani G., Schiessel H. Out of register: how DNA determines the chromatin fiber geometry. EPL. 2012;97:38002. [Google Scholar]
- 27.Koslover E.F., Fuller C.J., Spakowitz A.J. Local geometry and elasticity in compact chromatin structure. Biophys. J. 2010;99:3941–3950. doi: 10.1016/j.bpj.2010.10.024. [DOI] [PMC free article] [PubMed] [Google Scholar]
- 28.Scipioni A., Turchetti G., De Santis P. Geometrical, conformational and topological restraints in regular nucleosome compaction in chromatin. Biophys. Chem. 2010;148:56–67. doi: 10.1016/j.bpc.2010.02.010. [DOI] [PubMed] [Google Scholar]
- 29.Kepper N., Foethke D., Rippe K. Nucleosome geometry and internucleosomal interactions control the chromatin fiber conformation. Biophys. J. 2008;95:3692–3705. doi: 10.1529/biophysj.107.121079. [DOI] [PMC free article] [PubMed] [Google Scholar]
- 30.Perišić O., Collepardo-Guevara R., Schlick T. Modeling studies of chromatin fiber structure as a function of DNA linker length. J. Mol. Biol. 2010;403:777–802. doi: 10.1016/j.jmb.2010.07.057. [DOI] [PMC free article] [PubMed] [Google Scholar]
- 31.Kulaeva O.I., Zheng G., Olson W.K. Internucleosomal interactions mediated by histone tails allow distant communication in chromatin. J. Biol. Chem. 2012;287:20248–20257. doi: 10.1074/jbc.M111.333104. [DOI] [PMC free article] [PubMed] [Google Scholar]
- 32.Nam G.M., Arya G. Torsional behavior of chromatin is modulated by rotational phasing of nucleosomes. Nucleic Acids Res. 2014;42:9691–9699. doi: 10.1093/nar/gku694. [DOI] [PMC free article] [PubMed] [Google Scholar]
- 33.Olson W.K., Gorin A.A., Zhurkin V.B. DNA sequence-dependent deformability deduced from protein-DNA crystal complexes. Proc. Natl. Acad. Sci. USA. 1998;95:11163–11168. doi: 10.1073/pnas.95.19.11163. [DOI] [PMC free article] [PubMed] [Google Scholar]
- 34.Fuller F.B. Decomposition of the linking number of a closed ribbon: a problem from molecular biology. Proc. Natl. Acad. Sci. USA. 1978;75:3557–3561. doi: 10.1073/pnas.75.8.3557. [DOI] [PMC free article] [PubMed] [Google Scholar]
- 35.Crick F.H. Linking numbers and nucleosomes. Proc. Natl. Acad. Sci. USA. 1976;73:2639–2643. doi: 10.1073/pnas.73.8.2639. [DOI] [PMC free article] [PubMed] [Google Scholar]
- 36.Prunell A. A topological approach to nucleosome structure and dynamics: the linking number paradox and other issues. Biophys. J. 1998;74:2531–2544. doi: 10.1016/S0006-3495(98)77961-5. [DOI] [PMC free article] [PubMed] [Google Scholar]
- 37.Levitt M. Protein folding by restrained energy minimization and molecular dynamics. J. Mol. Biol. 1983;170:723–764. doi: 10.1016/s0022-2836(83)80129-6. [DOI] [PubMed] [Google Scholar]
- 38.Klenin K., Langowski J. Computation of writhe in modeling of supercoiled DNA. Biopolymers. 2000;54:307–317. doi: 10.1002/1097-0282(20001015)54:5<307::AID-BIP20>3.0.CO;2-Y. [DOI] [PubMed] [Google Scholar]
- 39.McGhee J.D., Rau D.C., Felsenfeld G. Orientation of the nucleosome within the higher order structure of chromatin. Cell. 1980;22:87–96. doi: 10.1016/0092-8674(80)90157-9. [DOI] [PubMed] [Google Scholar]
- 40.Yabuki H., Dattagupta N., Crothers D.M. Orientation of nucleosomes in the thirty-nanometer chromatin fiber. Biochemistry. 1982;21:5015–5020. doi: 10.1021/bi00263a027. [DOI] [PubMed] [Google Scholar]
- 41.McGhee J.D., Nickol J.M., Rau D.C. Higher order structure of chromatin: orientation of nucleosomes within the 30 nm chromatin solenoid is independent of species and spacer length. Cell. 1983;33:831–841. doi: 10.1016/0092-8674(83)90025-9. [DOI] [PubMed] [Google Scholar]
- 42.Keller W. Determination of the number of superhelical turns in simian virus 40 DNA by gel electrophoresis. Proc. Natl. Acad. Sci. USA. 1975;72:4876–4880. doi: 10.1073/pnas.72.12.4876. [DOI] [PMC free article] [PubMed] [Google Scholar]
- 43.Germond J.E., Hirt B., Chambon P. Folding of the DNA double helix in chromatin-like structures from simian virus 40. Proc. Natl. Acad. Sci. USA. 1975;72:1843–1847. doi: 10.1073/pnas.72.5.1843. [DOI] [PMC free article] [PubMed] [Google Scholar]
- 44.Tolstorukov M.Y., Colasanti A.V., Zhurkin V.B. A novel roll-and-slide mechanism of DNA folding in chromatin: implications for nucleosome positioning. J. Mol. Biol. 2007;371:725–738. doi: 10.1016/j.jmb.2007.05.048. [DOI] [PMC free article] [PubMed] [Google Scholar]
- 45.Humphrey W., Dalke A., Schulten K. VMD: visual molecular dynamics. J. Mol. Graph. 1996;14:33–38. doi: 10.1016/0263-7855(96)00018-5. [DOI] [PubMed] [Google Scholar]
- 46.Pettersen E.F., Goddard T.D., Ferrin T.E. UCSF Chimera—a visualization system for exploratory research and analysis. J. Comput. Chem. 2004;25:1605–1612. doi: 10.1002/jcc.20084. [DOI] [PubMed] [Google Scholar]
- 47.Bauer W.R. Structure and reactions of closed duplex DNA. Annu. Rev. Biophys. Bioeng. 1978;7:287–313. doi: 10.1146/annurev.bb.07.060178.001443. [DOI] [PubMed] [Google Scholar]
- 48.Clauvelin N., Lo P., Olson W.K. Nucleosome positioning and composition modulate in silico chromatin flexibility. J. Phys. Condens. Matter. 2015;27:064112. doi: 10.1088/0953-8984/27/6/064112. [DOI] [PMC free article] [PubMed] [Google Scholar]
- 49.Cui Y., Bustamante C. Pulling a single chromatin fiber reveals the forces that maintain its higher-order structure. Proc. Natl. Acad. Sci. USA. 2000;97:127–132. doi: 10.1073/pnas.97.1.127. [DOI] [PMC free article] [PubMed] [Google Scholar]
- 50.Simpson R.T., Thoma F., Brubaker J.M. Chromatin reconstituted from tandemly repeated cloned DNA fragments and core histones: a model system for study of higher order structure. Cell. 1985;42:799–808. doi: 10.1016/0092-8674(85)90276-4. [DOI] [PubMed] [Google Scholar]
- 51.Norton V.G., Imai B.S., Bradbury E.M. Histone acetylation reduces nucleosome core particle linking number change. Cell. 1989;57:449–457. doi: 10.1016/0092-8674(89)90920-3. [DOI] [PubMed] [Google Scholar]
- 52.Cole H.A., Howard B.H., Clark D.J. The centromeric nucleosome of budding yeast is perfectly positioned and covers the entire centromere. Proc. Natl. Acad. Sci. USA. 2011;108:12687–12692. doi: 10.1073/pnas.1104978108. [DOI] [PMC free article] [PubMed] [Google Scholar]
- 53.O’Sullivan J.M., Tan-Wong S.M., Proudfoot N.J. Gene loops juxtapose promoters and terminators in yeast. Nat. Genet. 2004;36:1014–1018. doi: 10.1038/ng1411. [DOI] [PubMed] [Google Scholar]
- 54.Ansari A., Hampsey M. A role for the CPF 3′-end processing machinery in RNAP II-dependent gene looping. Genes Dev. 2005;19:2969–2978. doi: 10.1101/gad.1362305. [DOI] [PMC free article] [PubMed] [Google Scholar]
- 55.Teif V.B., Vainshtein Y., Rippe K. Genome-wide nucleosome positioning during embryonic stem cell development. Nat. Struct. Mol. Biol. 2012;19:1185–1192. doi: 10.1038/nsmb.2419. [DOI] [PubMed] [Google Scholar]
Associated Data
This section collects any data citations, data availability statements, or supplementary materials included in this article.