

Abstract
In a rat model of neuroinflammation induced with a low-dose infusion lipopolysaccharide (5.0 ng/hr, LPS), we reported that brain arachidonic acid (ARA, 20:4 n-6), but not docosahexaenoic acid (DHA, 22:6n-3), metabolism is increased compared to control rats. To further characterize the impact LPS has on the induction of injury in this model, we quantified the dose-dependent activation of neuroglia and the loss of cholinergic cells in rats subjected to increasing doses of LPS. In this study, we found that LPS produced a statistically significant and linear dose-dependent increase in the percentage of activated CD11b-positive microglia ranging from 26% to 82% following exposure to doses ranging between 0.05 and 500 ng/hr, respectively. The percentage of activated GFAP-positive astrocytes also increased linearly and significantly from 35% to 91%. Significant astroglial scaring was evident at the lateral ventricular boarder of rats treated with 50 and 500 ng/hr LPS, but not evident in control treated rats or rats treated with lower doses of LPS. A dose-dependent decrease in the numbers of ChAT-positive cells in the basal forebrain of LPS-treated rats was found at higher doses of LPS (5, 50, and 500 ng/hr) but not at lower doses. The numbers of ChAT-positive cells within individual regions of the basal forebrain (medial septum and diagonal bands) and the composite basal forebrain were similar in their response. These data demonstrate that extremely low doses of LPS are sufficient to induce significant neuroglia activation while moderate doses above 5.0 ng/hr are required to induce cholinergic cell loss.
Keywords: astrocyte, microglia, neuron, cholinergic cells, neuroinflammation, GFAP, CD11b, ChAT
Introduction
The metabolism of brain arachidonic acid (ARA, 20:4n-6) is increased by 40 % in rats subjected to an intracerebral ventricular infusion of bacterial lipopolysaccharide (LPS, 0.5 ng/hr). This results in an increase in the turnover rates of ARA in brain ethanolamine and choline glycerophospholipid but does not alter ARA metabolism in other phospholipid groups[1–3]. The metabolism of brain docosahexaenoic acid (DHA, 22:6n-3) is not altered[4]. Further, LPS at this dosage also increases the activity of both ARA-selective secretory and cytosolic phospholipases A2 activity and the levels of prostaglandins E2 and D2[1]. These data suggest that a continual infusion of LPS results in an ARA-selective inflammatory response in the brain.
Because LPS is highly immunogenic and amongst the most potent inflammation-inducing agents known[5–7] understanding how inflammatory events in the brain respond to increasing doses of LPS is important to begin to understand the impact that the selective increase in ARA metabolism has in injury progression. In this model, LPS-induced neuroinflammation is associated with distinct functional and morphological changes by microglia within the central nervous system[8, 9], which result ultimately in cholinergic cell loss in the basal forebrain and brain atrophy following prolonged exposure[10]. However, a wide range of doses of LPS have been used to induce the neuroinflammatory response in this model. Some studies have used low doses (0.5–5 ng/hr) of LPS[1–3, 11], whereas others have used very high doses of LPS (150–5000 ng/hr)[10, 12–17]. Because it is known that high concentrations of LPS can alter the blood brain barrier (BBB) permeability[18–21] and result in focal necrotic lesions outside the ventricular zone[22] characterizing the dose-dependent effect of LPS on neuroglia reactivity and ChAT-cell loss in this model is important to understand it effect on injury progression.
In this regard, inflammatory processes in the brain are characterized by biochemical and morphological changes in microglia and astrocytes. Microglia cells within the central nervous system are central mediators of the neuroinflammatory response. Naïve microglia demonstrates a ramified morphology characterized by a small cell body and numerous processes. Upon stimulation by binding of LPS to toll-like receptor 4 (TLR4) receptor complex the morphology of the microglial cells change from ramified to amoeboid as they assume a phagocytic role within the central nervous system. This biochemical and morphological shift provides multiple beneficial roles that include removing antigen and cellular debris as well as boosting the autotrophic secretion of different factors that support neuronal survival. Persistent activation of microglia on the other hand can increase the release of pro-inflammatory cytokines, induce astroglial activation, stimulate bystander lysis, and increase the permeability of the BBB which allows the infiltration of peripheral macrophages[18,20,21]. In comparison astrocytes undergo varying molecular and morphological changes in response to pro-inflammatory signals in a process known as reactive astrogliosis. Reactive astrogliosis occurs in response to inflammatory signals produced during infection and injury. Reactive astrocytes produce multiple signaling molecules and maintain a characteristic hypertrophied morphology. Mild to moderate reactive astrogliosis is thought to be potentially reversible, while prolonged reactive astrogliosis can result in astroglial scar formation[23]. Astroglial scars can function opposite to prolonged microgliosis by forming astroglial barriers that potentially reduce BBB permeability altering injury resolution[24, 25]. Therefore, characterizing the complex interplay between microgliosis and reactive astrogliosis in this model of inflammation will allow us to better understand injury progression during neuroinflammatory insults.
The purpose of this study was to characterize the dose-dependent increase in neuroglia reactivity and to determine the doses necessary to induce significant cholinergic cell loss in rats subjected to a continual 28-day intracerebral ventricular infusion of LPS. The hypothesis being that extremely low doses of LPS are sufficient to induce neuroglia reactivity while greater concentrations are necessary to induce cholinergic cell loss. These studies show that LPS infusion resulted in a linear and dose-dependent increase in the percentage of reactive neuroglia within the brain and that moderate to high doses of LPS (5.0–500 ng/hr) were necessary to decrease the number of ChAT-positive cells in the basal forebrain. These results suggest that the selective increase in the metabolism of brain ARA using a low dose rate of LPS reflects primarily neuroglia activation, which is consistent with regional increases in ARA incorporation as determined by autoradiographic analysis[2].
Materials and Methods
Reagents
All reagents were purchased from Sigma Chemicals (St. Louis, MO), Permount™ was obtained from Fisher Scientific (Pittsburgh, PA), and absolute ethanol was purchased from Pharmco (Brookfield, CT). Normal horse serum, normal goat serum, biotinylated horse anti-mouse immunoglobulin G and Vectastain kits were obtained from Vector Laboratories (Burlingame, CA). Antibodies were purchased from AbD Serotec (Raleigh, NC, CD11b), and Millipore (Temecula, CA, GFAP, ChAT, rat biotinylated goat anti-rabbit immunoglobulin G, and 3,3′-diaminobenzidine tetrahydrochloride (DAB)).
Animal Care/Surgery
Surgery was performed following the Guide for the Care and Use of Laboratory Animals (NIH publication number 80–23) as approved by the University of North Dakota Animal Care and Use Committee (Protocol #0706-7). The surgical placement of Alzet osmotic mini-pumps (Model 2004; 0.25 μL/hr, Durect Corp. Cupertino, CA) connected to chronic indwelling cannula (Model 3280PM, Plastics One, Roanoke, VA) to deliver either artificial cerebral spinal fluid (aCSF, Harvard Apparatus, Holliston, MA) or LPS (Escherichia coli serotype 055:B5, Sigma, St. Louis, MO) dissolved in aCSF was performed on male Sprague Dawley rats weighing between 160–180 g (Charles River Laboratories, Portage, MI) as previously described[26]. Rats were subjected to doses of LPS ranging from zero (control-treated) to 0.05, 0.5, 5.0, 50, and 500 ng/hr.
Fixation and Sectioning
Anesthetized rats (sodium pentobarbital, 50 mg/kg, i.p.) were subjected to a cardiac perfusion using 0.9% saline containing 1000 units/L sodium heparin (Baxter, Deerfield, IL). Brain fixation was performed with a periodate-lysine-paraformaldehyde (PLP) solution containing 4% formaldehyde, 0.01 M sodium periodate, and 0.1 M lysine dissolved in 0.05 M phosphate buffer (pH 7.4)[26]. A cryostat (IEC, Needham Hts., MA) was used to cut 20 μm serial coronal brain sections, that were mounted on gelatin-coated glass slides and stored at room temperature until use.
Immunohistochemistry
Tissue sections were rehydrated in 0.1 M Tris-buffered saline, pH 7.6 (TBS), subjected to a modified antigen retrieval procedure[26–28]. Prior to use, the endogenous peroxidase activity was blocked using 0.3% H202 in TBS[26]. Activated microglial cells were visualized using a CD11b antibody and cholinergic cells were visualized using a ChAT antibody both diluted to a final concentration of 1:1000. Astrocytes were visualized using a GFAP antibody diluted to a final concentration of 1:400. Sections used to identify CD11b and GFAP immunoreactivity were incubated for 1 hr in a blocking solution containing 1% bovine serum albumin, 0.1% Triton™ X-100 and 2% horse serum in TBS and sections used to identify ChAT immunoreactivity were blocked using 10% normal goat serum in TBS prior to the addition of the primary antibodies. The sections were exposed to primary antibody for 72 hr (CD11b), 48 hr (ChAT), or 24 hr (GFAP) at 4° C in hydration chambers[26]. Sections used to quantify ChAT immunoreactivity were incubated for 2 hr in a 1:500 solution of rat-adsorbed, goat anti-rabbit biotinylated secondary antibody and sections used to identify CD11b or GFAP immunoreactivity were incubated for 2 hr in a 1:200 solution of rat-adsorbed, horse anti-mouse biotinylated secondary antibody dissolved in the appropriate blocking solutions described above. Immunoreactivity towards the individual antibodies, experiments to determine non-specific antibody binding, and subsequent manipulation of the slides were performed as described previously[26]. An Olympus microscope (Model BX50) equipped with Spot™ Model 2.3.1 camera and imaging software (version 3.4.5, Leeds, Minneapolis, MN) was used to capture images and the images were analyzed using MCID analysis software (InterFocus Imaging LTD., Linton, UK, Ver. 7.0).
Cell counting
A quantitative cell count analysis was performed in triplicate using 10 parallel sections from the differing treatment groups (n = 6) that encompassed a 200 μm region of the basal forebrain[26]. Anatomical landmarks were used to identify the location of counting frames[29] and quantitation was performed by counting all immune-positive cells located in the left and right hemispheric regions[26]. The procedures describing field identification, morphological image analysis[25, 30–33], and calculations made to quantify neuroglial activation and cholinergic cell density were performed as defined[26].
Statistical Analysis
Statistical analysis was performed comparing controls to LPS-treated rats using a One-way ANOVA with Tukey’s posttest (GraphPad InStat®, Ver. 3.06 for Windows, GraphPad Software, San Diego CA). Data are presented as mean ± SEM with a statistical significance threshold set at p < 0.05.
Results
Morphological analysis of increasing doses of LPS on CD11b-positive microglia
Composite results of blinded counts of CD11b-positive activated microglia from serial sections throughout the MS, HBB, cortex, and striatum of the basal forebrain from rats treated with dose rates 0, 0.05, 0.5, 5.0, 50, or 500 ng/hr LPS are outlined in Figure 1.
Figure 1. Quantification of ramified and activated microglia in control rats and rats treated with increasing doses of LPS.
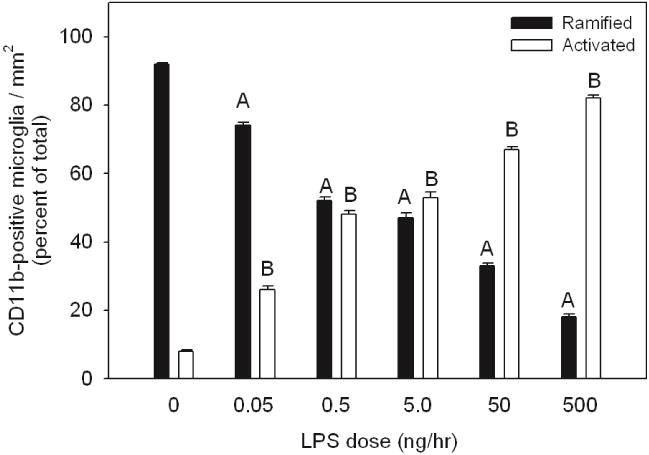
Values represent the averaged percent of total ramified (black bars) and activated CD11b-positive microglia (open bars) from three independent measurements.Statistical analysis was performed comparing the percentage change of ramified microglia in LPS-treated rats to control treated rats (A, p < 0.05) and comparing the percentage change of activated microglia in LPS-treated rats to control treated rats (B, p < 0.05). All values represent the means ± SEM with an n=6 samples per group.
In rats treated at does rates of 0.05, 0.5, 5.0, 50, or 500 ng/hr of LPS we found a statistically significant and linear dose-dependent increase in the proportion of activated microglia (p-value < 0.05), with an average of 26±0.4, 48±1, 53±1, 67±0.8, or 82±1 percent of the total number of labeled cells demonstrating an activated morphology, respectively. In control aCSF-treated rats, numerous CD11b-positive microglia with ramified morphology were observed (Figure 2a) however on average 8 percent of the total number of CD11b-positive labeled cells demonstrated an activated morphology. In LPS-treated rats, microglial morphology was altered ranging from the ramified form typical of the resting state to amoeboid shape with thicker proximal processes and loss of distal ramification. From 0.05 to 500 ng/hr of LPS infusion the CD11b-positive cells demonstrated a gradual increase of activated CD11b-positive microglia with marked reduction of ramified CD11b-positive microglia (Figure 2b, c, d, e, and f). At 500 ng/hr of LPS infusion, the dramatic change in the morphology of CD11b-positive microglia resem-bled fully activated microglia with amoeboid and condensed or phagocytic morphology (Figure 2f) with very few naïve ramified microglia.
Figure 2. Morphological assessment of CD11b-positive microglia in control rats and rats treated with increasing doses of LPS.
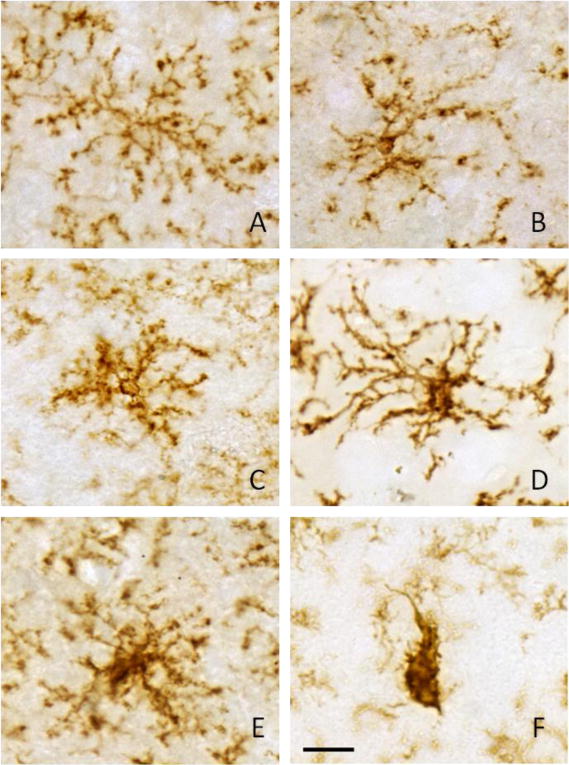
Representative pictures are shown to describe the morphological criterion used to distinguish between ramified microglia (control, panel A) and activated microglia found in rats treated with 0.05, 0.5, 5.0, 50, and 500 ng/hr LPS (panels B–F, respectively). Activated microglia (B–E) displayed varying degrees of larger more densely stained cell bodies with shorter and thicker processes to an amoeboid morphology (panel F). Scale bar (panel F) represents 20 μm.
Morphological analysis of increasing doses of LPS on GFAP-positive astrocytes
Figure 3 shows the results of blinded counts of GFAP-positive astrocytes from serial sections throughout the MS, DBB, cortex, and striatum of the basal forebrain of rats treated with 0.05, 0.5, 5.0, 50, or 500 ng/hr of LPS compared to control treated rats. A significant increase in the percentage of GFAP-positive astrocyte demonstrating an activated morphology was observed in rats treated with increasing dose rate of LPS (35±3.9%, 52±7.9%, 61±4.5%, 74±2.5%, and 91±2.1%, respectively) compared with control rats. In control aCSF-treated rats, numbers of astrocytes expressed GFAP immunoreactivity in their processes however little GFAP immunoreactivity was observed in the cell bodies (Figure 4a). The morphological changes in GFAP expression and increases in the intensity of GFAP staining were evident from 0.05 to 500 ng/hr of LPS-treated rats (Figure 4 b, c, d, e, and f). The morphology of the astrocytes on high dose of LPS infusion displayed obvious hypertrophy, and GFAP expression was noted in the cytoplasm as well as in the processes. At dosing rates of 50 or 500 ng/hr LPS significant increases in the amount of GFAP staining was evident along the ventricular boarders suggestive of astroglial scaring at these concentrations (Figure 5 e and f). Concentration of GFAP staining at the ventricular boarders was not evident at lower infusion doses (Figure 5 a–d).
Figure 3. Quantification of activated astrocytes in control rats and rats treated with increasing doses of LPS.
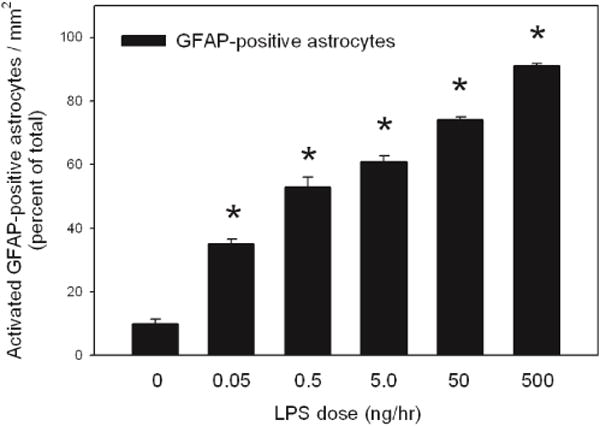
Values represent the averaged percent of activated GFAP-positive astrocytes from three independent measurements. Statistical analysis was performed comparing the percentage change of GFAP-positive activated astrocytes from rats treated with increasing does of LPS to percent of activated GFAP-positive astrocytes from control treated rats (*, p < 0.05). All values represent the means ± SEM with an n=6 samples per group.
Figure 4. Morphological assessment of GFAP-positive astrocytes in control rats and rats treated with increasing doses of LPS.
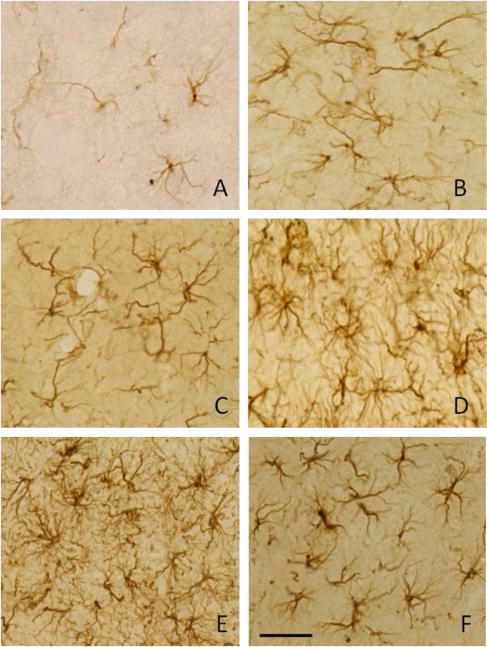
Representative pictures are shown to describe the morphological criterion used to distinguish between naïve astrocytes (control, panel A) and activated astrocytes found in rats treated with 0.05, 0.5, 5.0, 50, and 500 ng/hr LPS (panels B–F, respectively). Activated astrocytes (B–f) displayed varying degrees of larger more densely stained cell bodies with thicker processes. Scale bar (panel F) represents 40 μm.
Figure 5. GFAP staining at the ventricular border in control rats and rats treated with increasing doses of LPS.
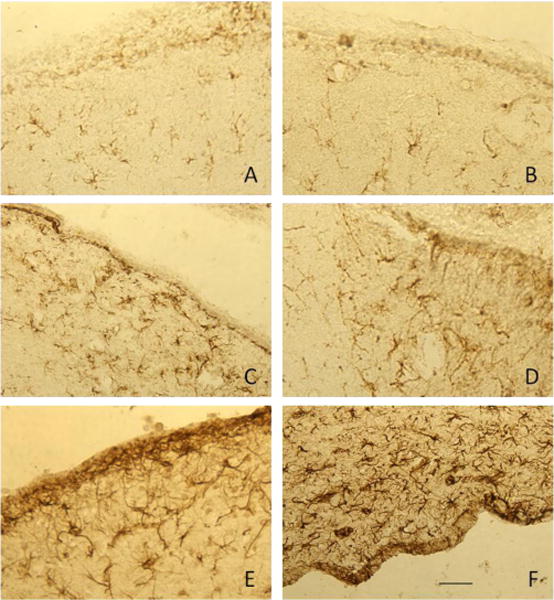
Representative pictures are shown to describe the characteristic GFAP staining at the ventricular border of control rats (panel A) and rats treated with 0.05, 0.5, 5.0, 50, and 500 ng/hr LPS (panels B–F, respectively). Dense GFAP staining was evident at the ventricular border of rats treated with 50 (panel E) and 500 ng/hr LPS (panel F) that was not present in controls or rats treated with lower doses of LPS. Scale bar (panel F) represents 100 μm.
Effects of different dosing rates of LPS on ChAT-positive cells within basal forebrain
Figure 6 shows the dose-dependent decline in ChAT-positive cells in the left and right diagonal band of Broca (DBB), medial septum and composite basal forebrain compared to control aCSF-treated rats. A significant loss of cholinergic cells (p < 0.05) was observed in the DBB of rats treated with 50 and 500 ng/hr of LPS (Figure 6a) and at dosing concentrations of 0.5, 50, and 500 ng/hr LPS (Figure 6b) in the medial septum. Composite counts from the basal forebrain demonstrated a dose-dependent decrease in the number of ChAT-positive cells ranging from 49.2±3.2%, 49.9±2.8%, and 59.1±1.3%, respecttively). The percentage loss in the numbers of ChAT-positive cells between 5 and 500 ng/hr were linear as determined by statistical analysis.
Figure 6. ChAT-positive cells within the basal forebrain with increasing doses of LPS.
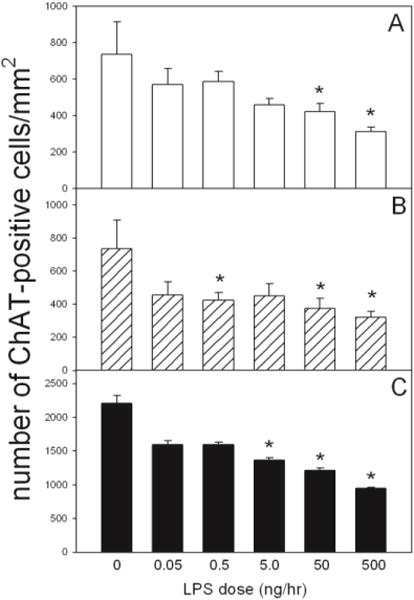
Quantification of the number of ChAT-positive cells per unit area in the Lt. and Rt. diagonal band of broca (panel A), medial septum (panel B), and composite basal forebrain (panel C) in control and LPS-treated rat brains. Values represent the averaged numbers of ChAT-positive cells from three independent measurements. Statistical analysis was performed comparing the number of ChAT-positive cells from rats treated with increasing does of LPS to the number cells found in control treated rats (*, p < 0.05). All values represent the means ± SEM with an n=6 samples per group.
Discussion
The focus of this study was to characterize the morphological changes of neuroglial and quantify cholinergic cell loss in response to a very wide range of endotoxin doses. We found that a chronic infusion of LPS at doses of 0, 0.05, 0.5, 5.0, 50, or 500 ng/hr for 28 days produced a linear and dose dependent increase in the proportion of activated neuroglia. The effects on microglial activation are consistent with previous studies on the effects of chronic LPS administration into fourth ventricle of rat brains. Interestingly, we found that microglial activation can be observed even in a very low dose of LPS (0.05 ng/hr). These findings agree with that of others demonstrating LPS is a potent stimulus for microglia[34, 35] and that a low dose of LPS is sufficient to induce significant increases in the metabolism of ARA and induction of phospholipases involved in inflammatory cascades in this model[1–3, 11].
Following CNS injury, astrocytes undergo transformation to a reactive state that have the morphologic characteristics of cellular hypertrophy and hyperplasia, cytoplasmic enlargement, and elongated cytoplasmic processes[32, 33]. The transformation to a reactive morphology is associated with an increased immunoreactivity towards GFAP, which is the principal intermediate filament of the astrocytic cytoskeleton and is unique to astrocytes[25]. This study demonstrated that enlargement of the astrocytic cytoplasm as well as thickened processes are detected throughout the brain at doses as low as 0.05 ng/hr LPS. The induction of GFAP immunoreactivity was consistent with the increase in the number of activated microglia[36, 37]. Concurrently, the number of activated astrocytes increased linearly and significantly with increasing doses of LPS. Taken together, these data suggest that the magnitude of the microgliosis and reactive astrogliosis as demonstrated by CD11b and GFAP immunoreactivity can also indicate the degree of severity of an inflammatory response in this model.
Microglia respond rapidly bacterial endotoxin and is consistent with their role of being “sensors to pathological events in the CNS”[38]. Our results show that ramified microglia were evenly distributed throughout the brain in control treated rats with on average 8% of the total having an activated morphology. Following treatment with increasing doses of LPS the transformation from ramified to an activated state demonstrated a dose-dependent response. Interestingly, as the dose of LPS was increased a greater proportion of the total microglia demonstrated an activated morphology. Following high doses of LPS (50–500 ng/hr), some activated microglia further transform into large, round cells with short, stout processes or no processes consistent with brain macrophages[36, 39] or ameboid microglial cells[40]. This type of morphology was found only at the higher LPS doses used in or around the basal forebrain area. Because microglia in this study demonstrated a graded dose-dependent response to LPS, these data indicate that microglial response to inflammatory stimuli can be used as an indicator of the degree of severity of an inflammatory response[37]. An intense recruitment of phagocytically active brain macrophages induced by the high-dose infusion of LPS may cause bystander lysis[9] through release of secretory products that damage healthy neurons[41] suggesting a causative role in the pathogenesis of neurologic disease and injury[42, 43].
Chronic infusion of differing levels of high doses of LPS produced a significant loss of ChAT positive cells within the basal forebrain[12,13], suggesting that the cytotoxic effects of chronic neuroinflammation induced by LPS within the basal forebrain are dose-independent. Results, measuring a wider range of LPS doses, suggest that low doses of LPS ranging between 0.05 and 0.5 ng/hr do not result in a significant loss of ChAT positive cells despite significant increases in microglia and astroglial activation. These results lead us to believe that mechanisms other than LPS induced glial-mediated inflammatory reactions may be involved in the loss of ChAT-positive cells found following high-dose treatment. A possible mechanism may include disruption in BBB permeability follow a chronic high-dose infusion of LPS. In this regard, it is know that LPS disrupts BBB permeability in a concentration and time-dependent manne[18, 20, 21, 44]. Our data showing increases in GFAP immunoreactivity along the ventricular borders suggests that higher doses of LPS do result in possible astroglial scarring which can alter BBB permeability and result in microenvironment changes that can alter neuronal survival[23]. In this regard, a chronic infusion of low dose LPS for 16 days produced a dose-dependent increase in lesion volume and abscess formation accompanied by pronounced astrogliosis without neuronal loss[22]. They concluded that neurons were apparently capable of surviving in this milieu of inflammation and significant neuronal loss may not be an immediate consequence. Another possible mechanism is that reactive microglia and astrocytes express molecules that could promote neuronal survival[45]. Although most studies suggest that activated neuroglia harm the brain, moderate microglial and astrocyte activation is thought to be beneficial[38, 46]. Thus, in the absence of astroglial scarring, neuroglial activation may be involved in maintaining homeostasis by isolating and protecting the still intact neuron from bystander lysis[25, 47]. Therefore, the cholinergic neuronal death observed in chronic high dose of LPS infusion may be an indirect result of astroglial scarring.
In conclusion, this study shows that LPS, when infused directly into the 4th ventricle of the rat brain, results in a dose-dependent response of activated microglia and astrocyte and that moderate to high concentration of LPS are required to induce significant loss of ChAT-positive cells in the basal forebrain. Thus, the inflammatory reaction following long-term, low-dose LPS infusion could be more valuable for inducing glial-mediated inflammatory response than high-dose of LPS infusion.
Acknowledgments
This publication was made possible by grants from the NIH/NIGMS (P30GM103329), the North Dakota EPSCoR through the NSF (# EPS-0447679), and a University of North Dakota School of Medicine and Health Sciences seed grant awarded to TAR.
Abbreviations
- LPS
bacterial lipopolysaccharide
- GFAP
glial fibrillary acidic protein
- CD11b
integrin alpha M chain
- ChAT
choline acetyltransferase
- aCSF
artificial cerebrospinal fluid
- PLP
periodate-lysine-paraformaldehyde
- DBB
the diagonal band of Broca
- vDBB
vertical limbs of the diagonal band of Broca
- hDBB
horizontal limbs of the diagonal band of Broca
Footnotes
Conflict of interests
The authors declare that they have no conflict of interests.
References
- 1.Rosenberger TA, Villacreses NE, Hovda JT, Bosetti F, Weerasinghe G, Wine RN, et al. Rat brain arachidonic acid metabolism is increased by a six-day intracerebral ventricular infusion of bacterial lipopolysaccharide. J Neurochem. 2004;88:1168–1178. doi: 10.1046/j.1471-4159.2003.02246.x. http://dx.doi.org/10.1046/j.1471-4159.2003.02246.x. [DOI] [PubMed] [Google Scholar]
- 2.Lee H, Villacreses NE, Rapoport SI, Rosenberger TA. In vivo imaging detects a transient increase in brain arachidonic acid metabolism: A potential marker of neuroinflammation. J Neurochem. 2004;91:936–945. doi: 10.1111/j.1471-4159.2004.02786.x. http://dx.doi.org/10.1111/j.1471-4159.2004.02786.x. [DOI] [PubMed] [Google Scholar]
- 3.Basselin M, Chang L, Seemann R, Bell JM, Rapoport SI. Chronic lithium administration potentiates brain arachidonic acid signaling at rest and during cholinergic activation in awake rats. J Neurochem. 2003;85:1553–1562. doi: 10.1046/j.1471-4159.2003.01811.x. http://dx.doi.org/10.1046/j.1471-4159.2003.01811.x. [DOI] [PubMed] [Google Scholar]
- 4.Rosenberger TA, Villacreses NE, Weis MT, Rapoport SI. Rat brain docosahexaenoic acid metabolism is not altered by a 6-day intracerebral ventricular infusion of bacterial lipopolysaccharide. Neurochem Int. 2010;56:501–507. doi: 10.1016/j.neuint.2009.12.010. http://dx.doi.org/10.1016/j.neuint.2009.12.010. [DOI] [PMC free article] [PubMed] [Google Scholar]
- 5.Watson RW, Redmond HP, Bouchier-Hayes D. Role of endotoxin in mononuclear phagocyte-mediated inflammatory responses. J Leukoc Biol. 1994;56:95–103. doi: 10.1002/jlb.56.1.95. [DOI] [PubMed] [Google Scholar]
- 6.Burrell R. Immunomodulation by bacterial endotoxin. Crit Rev Microbiol. 1990;17:189–208. doi: 10.3109/10408419009105725. http://dx.doi.org/10.3109/10408419009105725. [DOI] [PubMed] [Google Scholar]
- 7.Rietschel ET, Kirikae T, Schade FU, Mamat U, Schmidt G, Loppnow H, et al. Bacterial endotoxin: molecular relationships of structure to activity and function. FASEB J. 1994;8:217–225. doi: 10.1096/fasebj.8.2.8119492. [DOI] [PubMed] [Google Scholar]
- 8.Chiang CS, Stalder A, Samimi A, Campbell IL. Reactive gliosis as a consequence of interleukin-6 expression in the brain: studies in transgenic mice. Dev Neurosci. 1994;16:212–221. doi: 10.1159/000112109. http://dx.doi.org/10.1159/000112109. [DOI] [PubMed] [Google Scholar]
- 9.McGeer PL, McGeer EG. The inflammatory response system of brain: implications for therapy of Alzheimer and other neurodegenerative diseases. Brain Res Brain Res Rev. 1995;21:195–218. doi: 10.1016/0165-0173(95)00011-9. http://dx.doi.org/10.1016/0165-0173(95)00011-9. [DOI] [PubMed] [Google Scholar]
- 10.Willard LB, Hauss-Wegrzyniak B, Danysz W, Wenk GL. The cytotoxicity of chronic neuroinflammation upon basal forebrain cholinergic neurons of rats can be attenuated by glutamatergic antagonism or cyclooxygenase-2 inhibition. Exp Brain Res. 2000;134:58–65. doi: 10.1007/s002210000446. http://dx.doi.org/10.1007/s002210000446. [DOI] [PubMed] [Google Scholar]
- 11.Richardson RL, Kim EM, Gardiner T, O’Hare E. Chronic intracerebroventricular infusion of lipopolysaccharide: effects of ibuprofen treatment and behavioural and histopathological correlates. Behav Pharmacol. 2005;16:531–541. doi: 10.1097/01.fbp.0000179278.03868.96. http://dx.doi.org/10.1097/01.fbp.0000179278.03868.96. [DOI] [PubMed] [Google Scholar]
- 12.Hauss-Wegrzyniak B, Dobrzanski P, Stoehr JD, Wenk GL. Chronic neuroinflammation in rats reproduces components of the neurobiology of Alzheimer’s disease. Brain Res. 1998;780:294–303. doi: 10.1016/s0006-8993(97)01215-8. http://dx.doi.org/10.1016/S0006-8993(97)01215-8. [DOI] [PubMed] [Google Scholar]
- 13.Willard LB, Hauss-Wegrzyniak B, Wenk GL. Pathological and biochemical consequences of acute and chronic neuroinflammation within the basal forebrain cholinergic system of rats. Neuroscience. 1999;88:193–200. doi: 10.1016/s0306-4522(98)00216-4. http://dx.doi.org/10.1016/S0306-4522(98)00216-4. [DOI] [PubMed] [Google Scholar]
- 14.Hauss-Wegrzyniak B, Galons JP, Wenk GL. Quantitative volumetric analyses of brain magnetic resonance imaging from rat with chronic neuroinflammation. Exp Neurol. 2000;165:347–354. doi: 10.1006/exnr.2000.7469. http://dx.doi.org/10.1006/exnr.2000.7469. [DOI] [PubMed] [Google Scholar]
- 15.Hauss-Wegrzyniak B, Vannucchi MG, Wenk GL. Behavioral and ultrastructural changes induced by chronic neuroinflammation in young rats. Brain Res. 2000;859:157–166. doi: 10.1016/s0006-8993(00)01999-5. http://dx.doi.org/10.1016/S0006-8993(00)01999-5. [DOI] [PubMed] [Google Scholar]
- 16.Jin DQ, Sung JY, Hwang YK, Kwon KJ, Han SH, Min SS, et al. Dexibuprofen (S(+)-isomer ibuprofen) reduces microglial activation and impairments of spatial working memory induced by chronic lipopolysaccharide infusion. Pharmacol Biochem Behav. 2008;89:404–411. doi: 10.1016/j.pbb.2008.01.016. http://dx.doi.org/10.1016/j.pbb.2008.01.016. [DOI] [PubMed] [Google Scholar]
- 17.Rosi S, Ramirez-Amaya V, Hauss-Wegrzyniak B, Wenk GL. Chronic brain inflammation leads to a decline in hippocampal NMDA-R1 receptors. J Neuroinflammation. 2004;1:12. doi: 10.1186/1742-2094-1-12. http://dx.doi.org/10.1186/1742-2094-1-12. [DOI] [PMC free article] [PubMed] [Google Scholar]
- 18.Wispelwey B, Lesse AJ, Hansen EJ, Scheld WM. Haemophilus influenzae lipopolysaccharide-induced blood brain barrier permeability during experimental meningitis in the rat. J Clin Invest. 1988;82:1339–1346. doi: 10.1172/JCI113736. http://dx.doi.org/10.1172/JCI113736. [DOI] [PMC free article] [PubMed] [Google Scholar]
- 19.Jaeger LB, Dohgu S, Sultana R, Lynch JL, Owen JB, Erickson MA, et al. Lipopolysaccharide alters the blood-brain barrier transport of amyloid beta protein: a mechanism for inflammation in the progression of Alzheimer’s disease. Brain Behav Immun. 2009;23:507–517. doi: 10.1016/j.bbi.2009.01.017. http://dx.doi.org/10.1016/j.bbi.2009.01.017. [DOI] [PMC free article] [PubMed] [Google Scholar]
- 20.Gaillard PJ, de Boer AB, Breimer DD. Pharmacological investigations on lipopolysaccharide-induced permeability changes in the blood-brain barrier in vitro. Microvasc Res. 2003;65:24–31. doi: 10.1016/s0026-2862(02)00009-2. http://dx.doi.org/10.1016/S0026-2862(02)00009-2. [DOI] [PubMed] [Google Scholar]
- 21.Boje KM. Cerebrovascular permeability changes during experimental meningitis in the rat. J Pharmacol Exp Ther. 1995;274:1199–1203. [PubMed] [Google Scholar]
- 22.Szczepanik AM, Fishkin RJ, Rush DK, Wilmot CA. Effects of chronic intrahippocampal infusion of lipopolysa-ccharide in the rat. Neuroscience. 1996;70:57–65. doi: 10.1016/0306-4522(95)00296-u. http://dx.doi.org/10.1016/0306-4522(95)00296-U. [DOI] [PubMed] [Google Scholar]
- 23.Sofroniew MV. Molecular dissection of reactive astrogliosis and glial scar formation. Trends Neurosci. 2009;32:638–647. doi: 10.1016/j.tins.2009.08.002. http://dx.doi.org/10.1016/j.tins.2009.08.002. [DOI] [PMC free article] [PubMed] [Google Scholar]
- 24.Herrmann JE, Imura T, Song B, Qi J, Ao Y, Nguyen TK, et al. STAT3 is a critical regulator of astrogliosis and scar formation after spinal cord injury. J Neurosci. 2008;28:7231–7243. doi: 10.1523/JNEUROSCI.1709-08.2008. http://dx.doi.org/10.1523/JNEUROSCI.1709-08.2008. [DOI] [PMC free article] [PubMed] [Google Scholar]
- 25.Ridet JL, Malhotra SK, Privat A, Gage FH. Reactive astrocytes: cellular and molecular cues to biological function. Trends Neurosci. 1997;20:570–577. doi: 10.1016/s0166-2236(97)01139-9. http://dx.doi.org/10.1016/S0166-2236(97)01139-9. [DOI] [PubMed] [Google Scholar]
- 26.Costa PP, Jacobsson B, Collins VP, Biberfeld P. Unmasking antigen determinants in amyloid. J Histochem Cytochem. 1986;34:1683–1685. doi: 10.1177/34.12.2431032. http://dx.doi.org/10.1177/34.12.2431032. [DOI] [PubMed] [Google Scholar]
- 27.Shi SR, Key ME, Kalra KL. Antigen retrieval in formalin-fixed, paraffin-embedded tissues: an enhancement method for immunohistochemical staining based on microwave oven heating of tissue sections. J Histochem Cytochem. 1991;39:741–748. doi: 10.1177/39.6.1709656. http://dx.doi.org/10.1177/39.6.1709656. [DOI] [PubMed] [Google Scholar]
- 28.Gehrmann J, Bonnekoh P, Miyazawa T, Hossmann KA, Kreutzberg GW. Immunocytochemical study of an early microglial activation in ischemia. J Cereb Blood Flow Metab. 1992;12:257–269. doi: 10.1038/jcbfm.1992.36. http://dx.doi.org/10.1038/jcbfm.1992.36. [DOI] [PubMed] [Google Scholar]
- 29.Traissard N, Herbeaux K, Cosquer B, Jeltsch H, Ferry B, Galani R, et al. Combined damage to entorhinal cortex and cholinergic basal forebrain neurons, two early neurodegenerative features accompanying Alzheimer’s disease: effects on locomotor activity and memory functions in rats. Neuropsychopharmacology. 2007;32:851–871. doi: 10.1038/sj.npp.1301116. http://dx.doi.org/10.1038/sj.npp.1301116. [DOI] [PubMed] [Google Scholar]
- 30.Davis EJ, Foster TD, Thomas WE. Cellular forms and functions of brain microglia. Brain Res Bull. 1994;34:73–78. doi: 10.1016/0361-9230(94)90189-9. http://dx.doi.org/10.1016/0361-9230(94)90189-9. [DOI] [PubMed] [Google Scholar]
- 31.Ayoub AE, Salm AK. Increased morphological diversity of microglia in the activated hypothalamic supraoptic nucleus. J Neurosci. 2003;23:7759–7766. doi: 10.1523/JNEUROSCI.23-21-07759.2003. [DOI] [PMC free article] [PubMed] [Google Scholar]
- 32.Baldwin SA, Scheff SW. Intermediate filament change in astrocytes following mild cortical contusion. Glia. 1996;16:266–275. doi: 10.1002/(SICI)1098-1136(199603)16:3<266::AID-GLIA9>3.0.CO;2-#. http://dx.doi.org/10.1002/(SICI)1098-1136(199603)16:3<266::AID-GLIA9>3.0.CO;2-# http://dx.doi.org/10.1002/(SICI)1098-1136(199603)16:3<266::AID-GLIA9>3.3.CO;2-O. [DOI] [PubMed] [Google Scholar]
- 33.Amaducci L, Forno KI, Eng LF. Glial fibrillary acidic protein in cryogenic lesions of the rat brain. Neurosci Lett. 1981;21:27–32. doi: 10.1016/0304-3940(81)90052-5. http://dx.doi.org/10.1016/0304-3940(81)90052-5. [DOI] [PubMed] [Google Scholar]
- 34.Lee SC, Liu W, Dickson DW, Brosnan CF, Berman JW. Cytokine production by human fetal microglia and astrocytes. Differential induction by lipopolysaccharide and IL-1 beta. J Immunol. 1993;150:2659–2667. [PubMed] [Google Scholar]
- 35.van Dam AM, Brouns M, Louisse S, Berkenbosch F. Appearance of interleukin-1 in macrophages and in ramified microglia in the brain of endotoxin-treated rats: a pathway for the induction of non-specific symptoms of sickness. Brain Res. 1992;588:291–296. doi: 10.1016/0006-8993(92)91588-6. http://dx.doi.org/10.1016/0006-8993(92)91588-6. [DOI] [PubMed] [Google Scholar]
- 36.Perry VH, Bell MD, Brown HC, Matyszak MK. Inflammation in the nervous system. Curr Opin Neurobiol. 1995;5:636–641. doi: 10.1016/0959-4388(95)80069-7. http://dx.doi.org/10.1016/0959-4388(95)80069-7. [DOI] [PubMed] [Google Scholar]
- 37.Montero-Menei CN, Sindji L, Garcion E, Mege M, Couez D, Gamelin E, et al. Early events of the inflammatory reaction induced in rat brain by lipopolysaccharide intracerebral injection: relative contribution of peripheral monocytes and activated microglia. Brain Res. 1996;724:55–66. doi: 10.1016/0006-8993(96)00268-5. http://dx.doi.org/10.1016/0006-8993(96)00268-5. [DOI] [PubMed] [Google Scholar]
- 38.Kreutzberg GW. Microglia: a sensor for pathological events in the CNS. Trends Neurosci. 1996;19:312–318. doi: 10.1016/0166-2236(96)10049-7. http://dx.doi.org/10.1016/0166-2236(96)10049-7. [DOI] [PubMed] [Google Scholar]
- 39.Milligan CE, Cunningham TJ, Levitt P. Differential immunochemical markers reveal the normal distribution of brain macrophages and microglia in the developing rat brain. J Comp Neurol. 1991;314:125–135. doi: 10.1002/cne.903140112. http://dx.doi.org/10.1002/cne.903140112. [DOI] [PubMed] [Google Scholar]
- 40.Wu CH, Wen CY, Shieh JY, Ling EA. A quantitative and morphometric study of the transformation of amoeboid microglia into ramified microglia in the developing corpus callosum in rats. J Anat. 1992;181:423–430. [PMC free article] [PubMed] [Google Scholar]
- 41.Giulian D, Corpuz M. Microglial secretion products and their impact on the nervous system. Adv Neurol. 1993;59:315–320. [PubMed] [Google Scholar]
- 42.Nakajima K, Kohsaka S. Functional roles of microglia in the brain. Neurosci Res. 1993;17:187–203. doi: 10.1016/0168-0102(93)90047-t. http://dx.doi.org/10.1016/0168-0102(93)90047-T. [DOI] [PubMed] [Google Scholar]
- 43.Lees GJ. The possible contribution of microglia and macrophages to delayed neuronal death after ischemia. J Neurol Sci. 1993;114:119–122. doi: 10.1016/0022-510x(93)90285-7. http://dx.doi.org/10.1016/0022-510X(93)90285-7. [DOI] [PubMed] [Google Scholar]
- 44.West MA, Heagy W. Endotoxin tolerance: A review. Crit Care Med. 2002;30:S64–S73. http://dx.doi.org/10.1097/00003246-200201001-00009. [PubMed] [Google Scholar]
- 45.Soriano MA, Planas AM, Rodriguez-Farre E, Ferrer I. Early 72-kDa heat shock protein induction in microglial cells following focal ischemia in the rat brain. Neurosci Lett. 1994;182:205–207. doi: 10.1016/0304-3940(94)90798-6. http://dx.doi.org/10.1016/0304-3940(94)90798-6. [DOI] [PubMed] [Google Scholar]
- 46.Liu J, Bartels M, Lu A, Sharp FR. Microglia/macrophages proliferate in striatum and neocortex but not in hippocampus after brief global ischemia that produces ischemic tolerance in gerbil brain. J Cereb Blood Flow Metab. 2001;21:361–373. doi: 10.1097/00004647-200104000-00005. http://dx.doi.org/10.1097/00004647-200104000-00005. [DOI] [PubMed] [Google Scholar]
- 47.Anderson MF, Blomstrand F, Blomstrand C, Eriksson PS, Nilsson M. Astrocytes and stroke: networking for survival. Neurochem Res. 2003;28:293–305. doi: 10.1023/a:1022385402197. http://dx.doi.org/10.1023/A:1022385402197. [DOI] [PubMed] [Google Scholar]