

Abstract
In schizophrenia, hippocampal perfusion is increased and declarative memory function is degraded. Based on a model of hippocampal dysfunction in schizophrenic psychosis, we postulated increased NMDA receptor signaling in CA3. Here we demonstrate that the GluN2B-containing NMDA receptors (GluN2B/GluN1) and its associated postsynaptic membrane protein PSD95 are both increased in human hippocampal CA3 from schizophrenia cases, but not in CA1 tissue. Quantitative analyses of Golgi-stained hippocampal neurons show an increase in spine density on CA3 pyramidal cell apical dendrites (stratum radiatum) and an increase in the number of thorny excrescences. AMPA receptor subunit proteins are not altered in CA3 or CA1 subfields, nor are several additional related signaling proteins. These hippocampal data are consistent with increased excitatory signaling in CA3 and/or with an elevation in silent synapses in CA3, a state which may contribute to development of long term potentiation with subsequent stimulation and ‘un-silencing’. These changes are plausibly associated with increased associational activity in CA3, degraded declarative memory function and with psychotic manifestations in schizophrenia. The influence of these hyperactive hippocampal projections onto targets in limbic neocortex could contribute to components of schizophrenia manifestations in other cerebral regions.
Keywords: Hippocampal subfields, Psychosis, Golgi staining, spines, dendritic length, GluN2B subunits, PSD95 protein, activity-dependent signaling
INTRODUCTION
The molecular and cellular underpinnings of psychosis in diseases like schizophrenia are unknown yet remain essential knowledge for rational treatment development. The hippocampus has been implicated in schizophrenia, and the repeated demonstration of changes in its structure and function have grown convincing. Studies show reduced hippocampal volume 1, abnormal in vivo function 2–4 and replicable molecular pathology 5 reliably across laboratories. Declarative memory, known to depend on the conjunctive memory function of hippocampus, is one of the most consistently impaired cognitive functions in schizophrenia 6–9. In vivo biomarkers of hippocampal dysfunction in schizophrenia characteristically correlate with the psychotic symptomatology in subjects who are medication free 10;11.
The study of hippocampal subfield function in schizophrenia has already proven generative 12. The subfields themselves [dentate gyrus, cornu ammonis (CA3, CA2 CA1), and subiculum] have distinct and sequential functions in declarative memory formation 13 and are differentially affected in the illness 14. Excitatory projections connecting subfields have a low firing threshold, creating a unique hippocampal capacity for plasticity that advantages learning and memory 15, but under pathological circumstances, such as in psychosis, can be a liability. CA3 contains an extensive network of recurrent collateral connections that represent the anatomic substrate of conjunctive encoding and pattern completion processes, and creates the basis for declarative memory performance 16, as well as an opportunity for pathological hyperassociation as postulated in psychosis. In contrast, CA1 receives its strongest afferent stimulus from CA3 and shows a slower plasticity than CA3 for stabilizing place coding, while tuning multiple inputs dynamically from CA3 and entorhinal cortex 17.
Here, we examined CA3 tissue pathology in schizophrenia, contrasting the molecular changes in CA3 with those in CA1, postulating an increase in specific molecular and cellular biomarkers of activity-dependent signaling in CA3. We have previously articulated a model of psychosis in schizophrenia based on evidence of increased neuronal excitability in hippocampus and of a reduction in afferent stimulation to CA3 from dentate gyrus 18, a state we postulated was mediated by increased long term potentiation in CA3 and resulted in neuronal hyperactivity downstream. The characteristic molecular determinants of increased long term potentiation are well described in basic laboratory studies as being increases in the ‘immature’ GluN2B-containing NMDA receptor and in PSD95 or SAP102, both accompanied by synaptic remodeling (increased spine number) representing synaptic strengthening 18. Specifically, based on this hippocampal psychosis model and testing the hypothesis of increased long term potentiation in CA3, we postulated that GluN2B-containing NMDA receptors would be increased in CA3 in schizophrenia postmortem tissue with increased PSD-95 protein, representing new synapses, along with anatomic evidence of spine proliferation, but that these would not be present in CA1, even though the increased neuronal activity generated in CA3 would be transmitted ‘downstream’ to CA1. This hypothesis, if supported, would suggest increased long term potentiation in CA3, supported molecularly and anatomically that could plausibly be associated with hippocampal hyperactivity, mistakes of memory and false memories with psychotic content in schizophrenia. These observations would support the concept of psychosis as a pathological alteration of hippocampal neuroplasticity resulting in alterations of normal learning and memory processes 19;20.
EXPERIMENTAL METHODS
(1) Human postmortem tissue
Human brain tissue was collected by collaboration between the UTSW Department of Psychiatry and the Dallas County Medical Examiner’s office with the UTSW Tissue Transplant Service; the cases and their characterization form the Dallas Brain Collection. Cases within 24 hrs of death, with schizophrenia or healthy diagnoses, without agonal duress or any other primary brain disorder diagnosis, were collected, with next of kin permission. A cohort of high tissue quality hippocampal cases with CA1 and CA3 enriched samples was created including schizophrenia (N=21; N=10 cases on antipsychotic medication at death and N=11 schizophrenia cases off medication at death) and matched healthy control (HC) cases (n=21; none on CNS medications) 21. ‘Off medication at death’ was confirmed by negative plasma and vitreous antipsychotic drug levels at autopsy and confirmed by family history of no recent medication use (estimated, within 2 weeks) and/or pharmacy records whenever available. Schizophrenia and healthy cases were matched based on RIN, pH, age, race and sex (in this order) as closely as possible (Table 1, Suppl); tissue from matched pairs were run together on Western blots with the within-pair identity masked until statistical analysis. Tissue methods and characteristics are detailed in the Supplement. We sought cases with a schizophrenia diagnosis, off medication, as well as in the more standard on-medication condition, in order to test disease (schizophrenia vs healthy) and medication (on- vs off-medication schizophrenia cases) effects of target protein changes in the SZ vs HC cohort.
(2) Western blotting
Proteins were analyzed using usual protein blotting techniques 22. Methods are detailed in the Supplement.
(3) Golgi processing and analysis
Blocks measuring approximately 1 cm2 on face and no more than 0.5 cm thick of medial temporal lobe containing the hippocampal formation were dissected from a new cohort of fresh brain tissue from 7 SZ and 5 HC. Blocks were placed in 4% paraformaldehyde in phosphate buffered saline for 3 hrs and then transferred to a solution of Rapid Golgi fixative (0.2% tetroxide and 2.33% potassium dichromate) at room temperature in the dark. The blocks were shipped to Yale University for further processing. After five days in Rapid Golgi fixative, blocks were washed several times with 0.75% silver nitrate and reacted in this same solution for 24–48 hrs in the dark. The blocks were then dehydrated through increasing concentrations of ethanol, embedded in celloidin, and sectioned at 120 μm. Sections were mounted on slides with Permount, coverslipped, and air-dried on a flat surface. The slides were coded such that analysis was performed blind to diagnosis.
In each case, ten neurons in the CA3 region of the hippocampus were selected for analysis of spine density on the apical dendritic trunk (stratum radiatum). All selected neurons had apical dendrites that extended at least 250 μm from the soma. Spine density was measured at three locations on the apical dendritic trunk: 50 μm proximal to peak density, peak density, and 50 μm distal to peak density, as described in detail in 23. The number of thorny excrescences, which are large outcroppings of the apical dendritic trunk thought to be the receptive zones for mossy fiber synapses, was counted along the entire length of the apical dendritic trunk. In addition, in 5 neurons in each case that had at least one complete basal dendritic branch, this branch was analyzed for spine density and dendritic length on branch orders 1–4 (stratum oriens). All analyses were performed on Zeiss Axiophot microscope equipped with a Neurolucivid system (MicroBrightfield, Williston, VT) for computer aided analysis of dendritic morphology using Neurolucida software (v. 9.0).
(4) Statistical analysis
Based on our hippocampal psychosis model and preliminary data, we hypothesized a priori that GluN2B/GluN1 would be increased in CA3, as well as concentrations of the related postsynaptic protein, PSD95. We tested the hypothesized outcomes in CA3 using paired and unpaired statistics and found the changes significant in both contrasts; the outcomes of the paired statistics are given in the text, given that the cases were not only matched by demographics but also run together on the same blots throughout analyses. These same proteins were assessed in CA1 with no a priori hypothesis, to test the extent of the CA3 changes. Still other proteins were tested in an exploratory fashion in CA3 and CA1 (GluN1, GluN2A, GluA1, GluA2, CREB, pCREB, SAP102, Rac1, ERK 1,2, cofilin) to detect any indication of the intracellular pathways that might be mediating changes in signaling for future study. The comparison of each hypothesized CA3 protein between SZ cases and their matched HC cases were tested in paired two-tailed t-tests with level of significance set at p ≤ 0.05. The additional exploratory measures were analyzed with paired t-tests and corrected for multiple comparisons using the Bonferroni correction, whenever significant by t-test. Moreover, we contrasted the SZ cases on antipsychotic medication with SZ cases off medication, to obtain any indication that the protein change might be associated with antipsychotic medication administration. Measures of dendritic spine density and length were also compared using two-tailed t–tests, equal variances not assumed. In order to control for multiple comparisons in these anatomic analyses, we used a false discovery rate (FDR) analysis with q set at 0.10 24.
RESULTS
Hippocampal CA3 plasticity-related proteins in schizophrenia
Human CA3 subfield tissue was blotted for the postulated proteins, with each SZ case and its control run on the same blot. The analyses showed increased concentrations of GluN2B-containing NMDA receptors (GluN2B/GluN1) in SZ compared with matched HC cases [t(20)=2.56, p=0.018] (Fig 1a) with GluN1 unchanged in SZ CA3 (Fig 2a). No differences in GluN2B-containing NMDA receptors were detected between SZ cases on-medication vs SZ cases off-medication (t(19)=1.06; p=0.30) (Table 1), indicating that the detected increase is not a medication effect. Also, PSD95 in CA3 was increased in the SZ cohort [t(20)=2.53, p=0.02] (Fig 1b); and, no differences were detected in PSD95 protein levels between SZ cases on- and off-medication (t(19)=1.20; p=0.24), again suggesting no influence of treatment on this protein (Table 1). No changes in GAD67 protein were detected in schizophrenia CA3 in the total case cohort [t(20)=0.47; p=0.64] (Fig 1c) nor between SZ cases on- and off-medication (t(18)=1.21; p=0.24) (Table1).
Figure 1.


FIGURE 1a. GluN2B-containing NMDAR (GluN2B/GluN1) in CA3 Hippocampal Tissue.
In CA3 tissue, GluN2B-containing NMDA receptors (GluN2B/GluN1) are significantly increased in the schizophrenia cases (filled circles, SZ cases on medication; half-filled circles, SZ cases off medication) compared to healthy controls (open circles) in the whole tissue cohort, p=0.018. Bar represents the group average. The GluN2B and GluN1 proteins are quantified by the ratio of protein immunoreactivity/B-tubulin immunoreactivity.
*p<0.05
FIGURE 1b. CA3: PSD95 protein in CA3 Hippocampal Tissue
In CA3 tissue, PSD95 protein is significantly increased in the schizophrenia cases (filled circles, SZ cases on medication; half-filled circles, SZ cases off medication)) compared to the healthy control (open circles) cases in the whole tissue cohort (All). P=0.020. The bar represents group average. Protein is quantified by the ratio of PSD95 immunoreactivity/B-tubulin immunoreactivity. *p<0.05
FIGURE 1c. GAD67 protein in CA3 Hippocampal Tissue
In CA3 tissue, GAD67 did not differ in schizophrenia (filled circles, SZ cases on medication; half-filled circles, SZ cases off medication) from the healthy controls (open circles) in the whole group, even at a trend level, p=0.640. Bar represents the group average. Protein is quantified by the ratio of GAD67 immunoreactivity/B-tublulin immunoreactivity.
Figure 2.


(a) Exploratory Proteins in CA3 subfield. (b) Exploratory Proteins in CA1 subfield. (Open bars, HC; Filled bars, SZ tissue) Group average +/− standard error of the mean
In CA3 tissue, several proteins related to NMDA receptor signaling were tested in an exploratory manner. These included GluN1, GluN2A, GluA1, GluA2, pCREB/CREB, SAP102, Rac1, Cofilin, ERK1, and ERK2. Bars represent group average with standard error of the mean. No protein was different in SZ with Bonferroni correction for multiple testing. Proteins were quantified by the ratio of their immunoreactivity/B-tubulin immunoreactivity.
In CA1 tissue, the same several NMDA-related proteins were tested in an exploratory manner. These proteins included the same constructs listed in Fig 2a. No protein was significantly different in SZ with Bonferroni correction for multiple testing. Proteins were quantified by the ratio of the target protein immunoreactivity to B-tubulin reactivity. (mean +/− standard error of the mean)
Table 1.
Concentrations of the hypothesized proteins in CA3, contrasting SZ cases on (N=10) and off (N=11) medication. Group average +/− standard error of the mean
The concentrations of the hypothesized proteins, which were significantly increased for healthy controls in CA3 SZ tissue, were not different from each other in the SZ cases on and off medication. The primary comparisons were not significant in these contrasts with bonferroni correction. Group average +/− standard error of the mean.
| PROTEIN | SZ(on) | SEM (±) | SZ(off) | SEM (±) | p |
|---|---|---|---|---|---|
| GluN2B/GluN1 | 0.47 | 0.05 | 0.39 | 0.05 | 0.302 |
| PSD95 | 1.09 | 0.13 | 0.92 | 0.05 | 0.243 |
| GAD67 | 0.52 | 0.02 | 0.48 | 0.02 | 0.242 |
Several other related proteins found within glutamatergic synapses were quantified in CA3 in an exploratory manner contrasting SZ with HCs, including GluN2A, GluA1, GluA2 and synaptic remodeling proteins (Fig 2a). No changes were detected between SZ and HC in any of the key proteins related to glutamate receptors subunits, including GluN1, GluN2a, GluA1 or GluA2. In other signaling proteins, no changes could be detected in the concentrations in CA3 tissue in the SZ cohort, including pCREB/CREB, SAP102, Rac1, ERK1,2 and cofillin.
Hippocampal CA1 plasticity-related proteins in schizophrenia
In order to establish whether these molecular changes were confined to CA3, we examined the same proteins in CA1. In CA1, no increase in the GluN2B-containing NMDA receptor (GluN2B/GluN1) protein could be detected in total SZ cases [t(20)=<1, p=0.34] (Table 2), with GluN1 not different from HC in SZ CA1 (Fig 2b); neither were any differences detected in the GluN2B-containing NMDA receptors between the SZ cases on- and off-medication (t(19)=−0.15; p=0.88). PSD95 in CA1 showed a trend toward an increase in the total SZ group [t(20)=1.82, p=0.084] (Table 2), but the effect was not maintained when comparing the matched cases between SZ cases off-medication and HC [t(10)=<1, p=0.723]. Compared to matched HC, no change in GAD67could be detected in CA1 in the total SZ group [t(20)=0.39; p=0.698] (Table 2) nor in the comparison of SZ cases on and off medication (t(19)=−1.05; p=0.31).
Table 2.
CA1 concentrations of GluN2B-containing NMDA receptor, PSD95 and GAD protein. Group average +/− standard error of the mean
The CA1 concentrations of the three target proteins altered in CA3. In CA1 tissue, GluN2B-containing NMDA receptor, PSD95, or GAD67 were not altered in SZ, in either the whole cohort or in the off medication SZ cohort subgroup; primary comparisons were not significant with the bonferroni correction.
| PROTEIN | HC(all) | SEM(±) | SZ(all) | SEM(±) | p | HC(*) | SEM(±) | SZ(OFF) | SEM(±) | p |
|---|---|---|---|---|---|---|---|---|---|---|
| GluN2B/GluN1 | 0.56 | 0.08 | 0.65 | 0.09 | 0.34 | 0.64 | 0.11 | 0.64 | 0.08 | 0.99 |
| PSD95 | 1.46 | 0.23 | 2.05 | 0.16 | 0.084 | 1.75 | 0.37 | 1.91 | 0.22 | 0.72 |
| GAD67 | 0.86 | 0.04 | 0.83 | 0.04 | 0.70 | 0.88 | 0.05 | 0.79 | 0.08 | 0.31 |
these HC are the subgroup of HC paired with the SZ off medication cases.
HC(all), N= 21; SZ(all), N=21; HC(*), N=11; SZ(off), N=11
The same group of postsynaptic candidate signaling proteins was tested in the CA1 tissue. In CA1 subfield in HC vs. SZ tissue, no differences could be detected in any of the key proteins related to glutamate receptor subunits, including GluA1, GluA2, and GluN1; neither were any changes detected in other related signaling and structural proteins, including SAP102, Rac1, Cofilin, ERK1,2 (Fig 2b)
Hippocampal spine analysis in CA3 in schizophrenia
Based on the CA3-selective increases in known markers of synaptic strength, CA3 tissue from SZ and HC cases was collected and stained using a Rapid Golgi method to determine whether the suggestive molecular changes in CA3 were accompanied by morphologic changes in the number of excitatory synapses. Spine density was significantly elevated in the SZ cases in comparison to HC cases at the three locations (proximal, peak and distal) measured on the apical dendritic trunk of CA3 pyramidal neurons in stratum radiatum: specifically, ‘peak density’ [t(8)=4.656; p=0.001], ‘50 μm distal to peak’ [t(10)=3.506; p=0.006] and ‘50 μm proximal to peak’ [t(10)= 2.951, p = 0.015] were elevated in the SZ tissue compared to HC (Figs 3 & 4). The number of thorny excrescences were more numerous in the SZ cases as well [t(9)=2.976; p=0.016] (Table 3). Using the FDR statistic to correct for multiple comparisons (q=0.10), all of the above contrasts remained significant. For comparison with the morphometric alterations observed on the apical dendrite (stratum radiatum), we assessed spine density and dendritic length on the basal dendrites of CA3 pyramids (stratum oriens) and found several anatomic measures possibly indicating increased synaptic strength unchanged between SZ and HC cases in CA3. Spine density on 1st – 4th order dendrites was not different between groups (all, p>0.25) nor were differences in basal dendritic length detected at any branch order or overall (all p > 0.43) (Fig 3; Table 3).
Figure 3.

Photomicrographs illustrating CA3 pyramidal neuron morphology.
Montages of representative CA3 pyramidal neurons from a (A) healthy control case and (B) a case with schizophrenia further illustrate the increased spine density on the apical dendrite in schizophrenia. Boxes indicate enlarged sections of apical and basal dendrites, shown below from a healthy control (C, control, apical dendrite; D, control, basal dendrite) and a schizophrenia case (E, schizophrenia, apical dendrite; F, schizophrenia, basal dendrite), respectively. Scale bars for A, B = 50 μm; scale bars for C–F = 10 μm.
FIGURE 4.
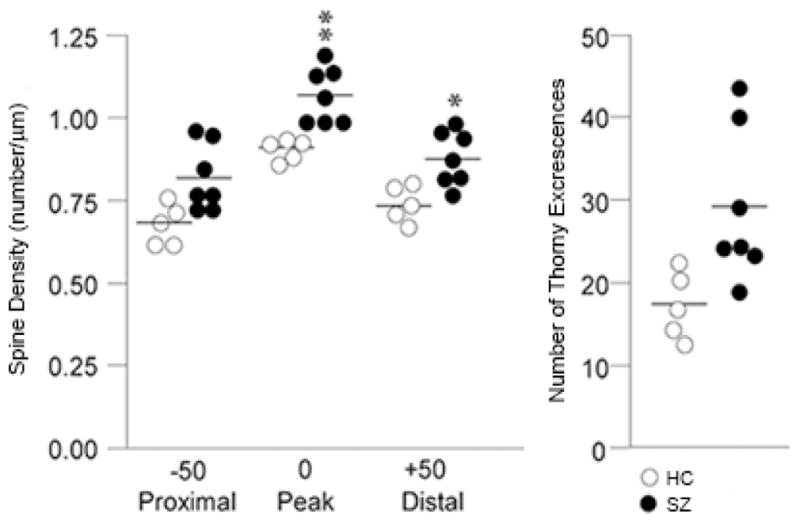
Spine Density along the apical dendrite in CA3 in SZ and HC.
Graph of individual data points for normal controls (open circles) and medicated schizophrenia cases (filled circles: SZ cases on medication). Spine density along the apical dendrite (stratum radiatum) is significantly higher at three locations: the point of peak spine density and 50 μm distal and proximal to the peak. The number of thorny excrescences also shows a significant elevation in the SZ cohort. * = p< 0.01; ** = p < 0.005.
Table 3.
Spine Density and Dendritic Length in CA3*
Histological examination of spine density show significant increases in spines in SZ at all three locations examined on the CA3 apical dentrite in stratum radiatum. Thorny excresences also are increased in number in SZ.
| HC | SEM | SZ | SEM | P value | |
|---|---|---|---|---|---|
| Spine Density (spines/μm) | |||||
| Stratum Radiatum | |||||
| Proximal | 0.68 | 0.03 | 0.82 | 0.04 | 0.015 |
| Peak | 0.91 | 0.02 | 1.07 | 0.03 | 0.001 |
| Distal | 0.74 | 0.02 | 0.88 | 0.03 | 0.006 |
| TEs | 17.3 | 1.8 | 29.2 | 3.5 | 0.016 |
| Stratum Oriens | |||||
| 1st Order | 0.37 | 0.03 | 0.38 | 0.03 | 0.73 |
| 2nd Order | 0.49 | 0.05 | 0.45 | 0.01 | 0.51 |
| 3rd Order | 0.54 | 0.04 | 0.56 | 0.02 | 0.66 |
| 4th Order | 0.56 | 0.04 | 0.61 | 0.03 | 0.30 |
| Dendritic Length (μm) | |||||
| Stratum Oriens | |||||
| 1st Order | 29.3 | 4.2 | 28.5 | 3.2 | 0.88 |
| 2nd Order | 96.0 | 11.7 | 90.9 | 10.1 | 0.75 |
| 3rd Order | 163.5 | 21.2 | 172.3 | 27.8 | 0.81 |
| 4th Order | 87.5 | 37.9 | 126.0 | 28.1 | 0.44 |
| Total Length | 449.5 | 61.3 | 473.0 | 44.9 | 0.77 |
Mean ± SE, BOLD font = significant finding; SZ-ON = schizophrenia on medication at death; TE = number of thorny excrescences
DISCUSSION
In this experiment, human tissue from healthy and schizophrenia cases was contrasted on molecular and anatomic markers of synaptic plasticity within the CA3 hippocampal subfield, and showed evidence of altered plasticity in CA3 characterized by an increase in GluN2B-containing NMDA receptors and PSD95 protein and an increase in spine density. Changes in these cellular and molecular markers were not observed in CA1. The increases in GluN2B-containing receptors, the early developmental variant of the NMDA receptor, and in PSD95 protein, occur without indication of AMPA receptor subunit alterations. The GluN2B/GluN1 increase in CA3 was present in the entire schizophrenia cohort, without any difference between cases on- and off-antipsychotic medication, indicating that this is a disease effect and not a chronic medication effect. These data are consistent with our previous report of increased BDNF mRNA in CA3 in schizophrenia that also points to an increase in excitatory signaling in CA3 20. The mossy fiber innervations in CA3 contact both the excitatory pyramidal neurons at thorny excrescences and inhibitory interneurons by way of en passant (‘passing through’) synapses, and these innervations have inverse effects on CA3 excitation 25. Thus, strengthened transmission at the pyramidal cell and reduced inhibitory control onto local interneurons occur together, augmenting CA3 pyramidal cell excitation from two sites, advantaging feed-forward excitation 26. Uncontrolled feed-forward excitation might be the cerebral process which fuels hyperassociation, false memories and psychotic mental events.
Golgi staining was used to examine the morphologic correlates of these molecular changes on pyramidal cell architecture. Two distinct cellular regions of the CA3 pyramidal dendritic tree were examined: the proximal apical and basal dendrites corresponding to the CA3 stratum radiatum and CA3 stratum oriens substrata, respectively. The anatomic changes document a clear increase in spine density limited to stratum radiatum, at the apical trunk of pyramidal CA3 neurons, but not in stratum oriens at the insertions of the recurrent collaterals. An increase was detected in the number of mossy fiber receptive sites, the thorny excrescences, in the stratum radiatum. The presence of greater spine density in stratum radiatum is consistent with and could represent the morphologic manifestation of increased GluN2B-containing NMDA receptors in CA3 in SZ, particularly as the GluN2B subunit advantages long term potentiation 27;28. Increased spine density in CA3 is also compatible with the molecular findings of elevated PSD95, as overexpression of this protein has been shown to elevate spine density in hippocampal cultures 29. Increased spine number is regularly observed following long term potentiation-mediated increases in synaptic strength at excitatory synapses 30;31. These changes are compatible with evidence from the electron microscopy study of Kolomeets et. al. 32 showing that the specific number of mossy fiber/CA3 synapses are reduced, an effect that would lead to an increase in excitability and synaptic strength in CA3 itself through metaplasticity mechanisms. The specificity of morphometric abnormalities to sub-layer components of the dendritic tree is intriguing and suggests that there may be a complex pattern of pathology in hippocampal subfields and their sublayers that could be related to afferent input patterning. Future studies may target morphometric features of the distal apical dendrites, which receive perforant path afferent input from the entorhinal cortex to further address sub-layer specificity as well as extend the morphologic studies to substrata of the CA1 region.
These outcomes, including the increase in spines, an increase in PSD95, and the increase in GluN2B-containing NMDA receptors in CA3 are consistent with alterations in excitatory signaling in hippocampus in CA3. This could represent an increase in neuronal excitability and long term potentiation within CA3; moreover, we have previously suggested this as a model of altered metaplasticity dynamics in CA3, based on reduced afferent stimulation from dentate gyrus, elevated sensitivity and increased direct stimulation from entorhinal cortex18. Alternatively or in addition, there could be an increase in silent synapses within CA3, the latter being a condition which would prime the synapse for an increase in experience-dependent plasticity with synaptic ‘un-silencing’. Silent synapses are identified in laboratory preparations as synapses which exhibit NMDA receptor-mediated electrical responses but no evidence of AMPA-receptor-mediated transmission; silent synapses are important during development 33–35. Recent studies have identified the generation of silent synapses in mature brain during salient in vivo experiences 36. It is thought that strong in vivo experiences—we would suggest that this might be acute psychotic experiences in the context of schizophrenia--could selectively sensitize a neural circuit by generating silent synapses as a basis for robust increases in synaptic plasticity with relevant subsequent experience 36. This latter interpretation is consistent with the presentation of psychosis in humans, in that most SZ individuals with schizophrenic psychosis retain a psychosis propensity after an initial psychotic episode and many show a cyclic recurrence of psychotic manifestations. The alteration in CA3 plasticity conditions with an initial psychotic episode could create a vulnerability to new excitatory input within CA3 after a florid psychosis, which could generate ‘run away’ activity within the recurrent collateral that would diminish prediction error mechanisms, increase associations and allow false memories formation with psychotic content. Both of these interpretations are consistent with emerging schizophrenia genetics which converge not only on strong risk genes like NRG1 (which shows an altered NRG1 fragment in hippocampus 37, DISC1 and CHRNA7 38, but also on functional gene networks, including those modifying glutamate, synaptic function and neuronal plasticity. The 15q13-14 loci which is implicated in schizophrenia, includes the alpha7 nicotinic receptor promotor 38; because cholinergic innervation is differentially directed to CA3 within human hippocampus 39 and largely localized to CA3 interneurons 40, a loss of cholinergic capacity and subsequent failure of interneuronal inhibition could support CA3 hyperactivity. Also, a genetically manipulated mouse based on the 22q11.2 schizophrenia risk deletion, shows an increase in hippocampal high frequency synaptic transmission, increased long term plasticity and exaggerated dendritic spines 41, suggesting these as disease elements in schizophrenia.
The CA3 subfield changes in schizophrenia tissue described here may provide the molecular and cellular substrate supporting hippocampal hyperactivity in vivo, hyperactivity represented by increased hippocampal cerebral blood flow 3;42 and blood volume 12 well described in schizophrenia patients. These molecular alterations were not seen in CA1, suggesting that the in vivo hippocampal hyperactivity which has been reported in CA1 is propagated downstream from CA3 12. The dynamic characteristics of NMDA receptor membrane insertion, removal and translocation within neural synapses allow for their involvement in alterations of synaptic strength 43;44, recognizing that the regulation of synaptic strength at the mossy fiber-CA3 pyramidal cell synapse is unique and complex 26;33. This change could contribute to psychosis manifestations through pathological ‘pattern separation’ 45 and/or ‘pattern completion’ computations 46–48.
This study examined NMDA receptor subunits only in hippocampal subfields. A large literature exists on these subunits in other schizophrenia brain regions 49 and in whole hippocampus 50, prefrontal cortex 51, thalamus 52, cerebellum 53 and substantia nigra 54. Changes, especially in prefrontal cortex, are variable across studies 55–57. The relationship between the molecular changes reported here in hippocampal subfields and the neocortical anatomic and molecular neuropathology of schizophrenia reported elsewhere 58;59 is not clear. These changes could be independent, correlated or interdependent, a question important for future investigation. The coexistence of both hippocampal hyperactivity (plausibly associated with psychosis) with prefrontal cortical hypoactivity (plausibly associated with cognitive impairment) could be functionally linked if the hyper-excitatory efferents from hippocampus to prefrontal cortical targets fell primarily onto the affected populations of cortical inhibitory interneurons, contributing to the dysregulation of GABA inhibitory control of prefrontal pyramidal neurons.
A classic hypothesis for hippocampal hyperactivity in schizophrenia has been disinhibition of hippocampal pyramidal cells by a reduction in the inhibitory GABA-mediated modulation of pyramidal cell firing 60. Cell counting studies in hippocampus contrasting schizophrenia and bipolar disorder with controls report metabolic 61 and molecular 2 alterations in bipolar disorder, largely sparing schizophrenia hippocampus; although previous studies found inhibitory deficits in schizophrenia hippocampus 62;63. Yet, in our hands, in neither CA3 nor CA1 SZ tissue, have we detected outcomes showing a reduction in GAD67 protein. Further research is clearly needed to examine subtle effects of changes in inhibitory GABA modulation in CA3.
In summary, these data show changes in the GluN2B-containing NMDA receptor in CA3 of hippocampus and not in CA1, along with consistent increases in PSD95 and in pyramidal cell spine number. These findings are consistent with increased neuronal excitability in CA3 and/or with an increase in silent synapses in CA3 in schizophrenia, conditions which could plausibly underlie manifestations of psychosis in the illness. The findings have implications for potential molecular markers in the illness, for novel medication targeting with further confirmation and for use in modeling schizophrenia psychosis in animal paradigms.
Supplementary Material
Acknowledgments
This work was supported by a Brain and Behavior Foundation (NARSAD) Established Investigator Grant to CAT; and by a National Institute of Mental Health grant to CAT, MH062236.
Footnotes
This work was presented in poster format at the Society for Neuroscience, November 9–13, 2013, San Diego CA.
Disclosures:
Carol Tamminga is a Deputy Editor at the American Journal of Psychiatry; she is an ad hoc consultant for Astellas, Lilly Pharmaceuticals, Lundbeck, and PureTech Ventures and is an Advisory Board member for Intra-Cellular Therapies.
None of the other authors have affiliations to disclosure.
Reference List
- 1.Honea R, Crow TJ, Passingham D, Mackay CE. Regional deficits in brain volume in schizophrenia: a meta-analysis of voxel-based morphometry studies. Am J Psychiatry. 2005;162(12):2233–2245. doi: 10.1176/appi.ajp.162.12.2233. [DOI] [PubMed] [Google Scholar]
- 2.Heckers S, Rauch SL, Goff D, et al. Impaired recruitment of the hippocampus during conscious recollection in schizophrenia. Nature. 1998;1(4):318–323. doi: 10.1038/1137. [DOI] [PubMed] [Google Scholar]
- 3.Medoff DR, Holcomb HH, Lahti AC, Tamminga CA. Probing the human hippocampus using rCBF: contrasts in schizophrenia. Hippocampus. 2001;(11):543–550. doi: 10.1002/hipo.1070. [DOI] [PubMed] [Google Scholar]
- 4.Tregellas JR, Smucny J, Harris JG, et al. Intrinsic Hippocampal Activity as a Biomarker for Cognition and Symptoms in Schizophrenia. Am J Psychiatry. 2014 doi: 10.1176/appi.ajp.2013.13070981. [DOI] [PMC free article] [PubMed] [Google Scholar]
- 5.Harrison PJ. The hippocampus in schizophrenia: a review of the neuropathological evidence and its pathophysiological implications. Psychopharmacology. 2004 doi: 10.1007/s00213-003-1761-y. [DOI] [PubMed] [Google Scholar]
- 6.Ramirez S, Liu X, Lin PA, et al. Creating a false memory in the hippocampus. Science. 2013;341(6144):387–391. doi: 10.1126/science.1239073. [DOI] [PubMed] [Google Scholar]
- 7.Ranganath C, Minzenberg MJ, Ragland JD. The cognitive neuroscience of memory function and dysfunction in schizophrenia. Biol Psychiatry. 2008;64(1):18–25. doi: 10.1016/j.biopsych.2008.04.011. [DOI] [PMC free article] [PubMed] [Google Scholar]
- 8.Titone D, Ditman T, Holzman PS, Eichenbaum H, Levy DL. Transitive inference in schizophrenia: impairments in relational memory organization. Schizophr Res. 2004 doi: 10.1016/S0920-9964(03)00152-X. [DOI] [PubMed] [Google Scholar]
- 9.Wagner AD, Schacter DL, Rotte M, et al. Building Memories: Remembering and Forgetting of Verbal Experiences as Predicted by Brain Activity. Science. 1998;281(5380):1188–1191. doi: 10.1126/science.281.5380.1188. [DOI] [PubMed] [Google Scholar]
- 10.Schobel SA, Lewandowski NM, Corcoran CM, et al. Differential targeting of the CA1 subfield of the hippocampal formation by schizophrenia and related psychotic disorders. Arch Gen Psychiatry. 2009;66(9):938–946. doi: 10.1001/archgenpsychiatry.2009.115. [DOI] [PMC free article] [PubMed] [Google Scholar]
- 11.Lahti AC, Weiler MA, Holcomb HH, et al. Correlations between rCBF and symptoms in two independent cohorts of drug-free patients with schizophrenia. Neuropsychopharmacology. 2006;31(1):221–230. doi: 10.1038/sj.npp.1300837. [DOI] [PubMed] [Google Scholar]
- 12.Schobel SA, Chaudhury NH, Khan UA, et al. Imaging patients with psychosis and a mouse model establishes a spreading pattern of hippocampal dysfunction and implicates glutamate as a driver. Neuron. 2013;78(1):81–93. doi: 10.1016/j.neuron.2013.02.011. [DOI] [PMC free article] [PubMed] [Google Scholar]
- 13.Norman KA, O’Reilly RC. Modeling hippocampal and neocortical contributions to recognition memory: A complementary-learning-systems approach. Psychol Rev. 2003;110:611–646. doi: 10.1037/0033-295X.110.4.611. [DOI] [PubMed] [Google Scholar]
- 14.Knable MB, Barci BM, Webster MJ, Meador-Woodruff J, Torrey EF. Molecular abnormalities of the hippocampus in severe psychiatric illness: postmortem findings from the Stanley Neuropathology Consortium. Mol Psychiatry. 2004;9(6):609–20. 544. doi: 10.1038/sj.mp.4001471. [DOI] [PubMed] [Google Scholar]
- 15.McClelland JL, McNaughton BL, O’Reilly RC. Why there are complementary learning systems in the hippocampus and neocortex: insights from the successes and failures of connectionist models of learning and memory. Psychology Review. 1995;102(3):419–457. doi: 10.1037/0033-295X.102.3.419. [DOI] [PubMed] [Google Scholar]
- 16.Leutgeb S, Leutgeb JK. Pattern separation, pattern completion, and new neuronal codes within a continuous CA3 map. Learn Mem. 2007;14(11):745–757. doi: 10.1101/lm.703907. [DOI] [PubMed] [Google Scholar]
- 17.Carr MF, Frank LM. A single microcircuit with multiple functions: state dependent information processing in the hippocampus. Curr Opin Neurobiol. 2012;22(4):704–708. doi: 10.1016/j.conb.2012.03.007. [DOI] [PMC free article] [PubMed] [Google Scholar]
- 18.Tamminga CA, Stan AD, Wagner AD. The hippocampal formation in schizophrenia. Am J Psychiatry. 2010;167(10):1178–1193. doi: 10.1176/appi.ajp.2010.09081187. [DOI] [PubMed] [Google Scholar]
- 19.Corlett PR, Honey GD, Fletcher PC. From prediction error to psychosis: ketamine as a pharmacological model of delusions. J Psychopharmacol. 2007;21(3):238–252. doi: 10.1177/0269881107077716. [DOI] [PubMed] [Google Scholar]
- 20.Tamminga CA, Southcott S, Sacco C, Wagner AD, Ghose S. Glutamate Dysfunction in Hippocampus: Relevance of Dentate Gyrus and CA3 Signaling. Schizophr Bull. 2012 doi: 10.1093/schbul/sbs062. [DOI] [PMC free article] [PubMed] [Google Scholar]
- 21.Stan AD, Ghose S, Gao XM, et al. Human postmortem tissue: What quality markers matter? Brain Res. 2006;1123(1):1–11. doi: 10.1016/j.brainres.2006.09.025. [DOI] [PMC free article] [PubMed] [Google Scholar]
- 22.Ghose S, Winter MK, McCarson KE, Tamminga CA, Enna SJ. The GABA-B receptor as a target for antidepressant drug action. Br J Pharmacol. 2011;162(1):1–17. doi: 10.1111/j.1476-5381.2010.01004.x. [DOI] [PMC free article] [PubMed] [Google Scholar]
- 23.Selemon LD, Begovic A, Goldman-Rakic PS, Castner SA. Amphetamine sensitization alters dendritic morphology in prefrontal cortical pyramidal neurons in the non-human primate. Neuropsychopharmacology. 2007;32(4):919–931. doi: 10.1038/sj.npp.1301179. [DOI] [PubMed] [Google Scholar]
- 24.Genovese CR, Lazar NA, Nichols T. Thresholding of statistical maps in functional neuroimaging using the false discovery rate. Neuroimage. 2002;15(4):870–878. doi: 10.1006/nimg.2001.1037. [DOI] [PubMed] [Google Scholar]
- 25.McBain CJ. Differential mechanisms of transmission and plasticity at mossy fiber synapses. Prog Brain Res. 2008;169:225–240. doi: 10.1016/S0079-6123(07)00013-1. [DOI] [PMC free article] [PubMed] [Google Scholar]
- 26.Lawrence JJ, McBain CJ. Interneuron diversity series: containing the detonation--feedforward inhibition in the CA3 hippocampus. Trends Neurosci. 2003;26(11):631–640. doi: 10.1016/j.tins.2003.09.007. [DOI] [PubMed] [Google Scholar]
- 27.Barria A, Malinow R. NMDA receptor subunit composition controls synaptic plasticity by regulating binding to CaMKII. Neuron. 2005;48(2):289–301. doi: 10.1016/j.neuron.2005.08.034. [DOI] [PubMed] [Google Scholar]
- 28.Zhao JP, Constantine-Paton M. NR2A−/− mice lack long-term potentiation but retain NMDA receptor and L-type Ca2+ channel-dependent long-term depression in the juvenile superior colliculus. J Neurosci. 2007;27(50):13649–13654. doi: 10.1523/JNEUROSCI.3153-07.2007. [DOI] [PMC free article] [PubMed] [Google Scholar]
- 29.El-Husseini AE, Schnell E, Chetkovich DM, Nicoll RA, Bredt DS. PSD-95 involvement in maturation of excitatory synapses. Science. 2000;290(5495):1364–1368. [PubMed] [Google Scholar]
- 30.Maletic-Savatic M, Malinow R, Svoboda K. Rapid dendritic morphogenesis in CA1 hippocampal dendrites induced by synaptic activity. Science. 1999;283(5409):1923–1927. doi: 10.1126/science.283.5409.1923. [DOI] [PubMed] [Google Scholar]
- 31.Engert F, Bonhoeffer T. Dendritic spine changes associated with hippocampal long-term synaptic plasticity. Nature. 1999;399(6731):66–70. doi: 10.1038/19978. [DOI] [PubMed] [Google Scholar]
- 32.Kolomeets NS, Orlovskaya DD, Uranova NA. Decreased numerical density of CA3 hippocampal mossy fiber synapses in schizophrenia. Synapse. 2007;61(8):615–621. doi: 10.1002/syn.20405. [DOI] [PubMed] [Google Scholar]
- 33.Kerchner GA, Nicoll RA. Silent synapses and the emergence of a postsynaptic mechanism for LTP. Nat Rev Neurosci. 2008;9(11):813–825. doi: 10.1038/nrn2501. [DOI] [PMC free article] [PubMed] [Google Scholar]
- 34.Isaac JT, Nicoll RA, Malenka RC. Evidence for silent synapses: implications for the expression of LTP. Neuron. 1995;15(2):427–434. doi: 10.1016/0896-6273(95)90046-2. [DOI] [PubMed] [Google Scholar]
- 35.Malenka RC, Nicoll RA. Silent synapses speak up. Neuron. 1997;19(3):473–476. doi: 10.1016/s0896-6273(00)80362-1. [DOI] [PubMed] [Google Scholar]
- 36.Huang YH, Lin Y, Mu P, et al. In vivo cocaine experience generates silent synapses. Neuron. 2009;63(1):40–47. doi: 10.1016/j.neuron.2009.06.007. [DOI] [PMC free article] [PubMed] [Google Scholar]
- 37.Marballi K, Cruz D, Thompson P, Walss-Bass C. Differential neuregulin 1 cleavage in the prefrontal cortex and hippocampus in schizophrenia and bipolar disorder: preliminary findings. PLoS One. 2012;7(5):e36431. doi: 10.1371/journal.pone.0036431. [DOI] [PMC free article] [PubMed] [Google Scholar]
- 38.Stephens SH, Logel J, Barton A, et al. Association of the 5′-upstream regulatory region of the alpha7 nicotinic acetylcholine receptor subunit gene (CHRNA7) with schizophrenia. Schizophr Res. 2009;109(1–3):102–112. doi: 10.1016/j.schres.2008.12.017. [DOI] [PMC free article] [PubMed] [Google Scholar]
- 39.De LS, Lim C, Sobreviela T, et al. Cholinergic innervation in the human hippocampal formation including the entorhinal cortex. J Comp Neurol. 1994;345(3):321–344. doi: 10.1002/cne.903450302. [DOI] [PubMed] [Google Scholar]
- 40.Pelkey KA, McBain CJ. Target-cell-dependent plasticity within the mossy fibre-CA3 circuit reveals compartmentalized regulation of presynaptic function at divergent release sites. J Physiol. 2008;586(6):1495–1502. doi: 10.1113/jphysiol.2007.148635. [DOI] [PMC free article] [PubMed] [Google Scholar]
- 41.Fenelon K, Xu B, Lai CS, et al. The Pattern of Cortical Dysfunction in a Mouse Model of a Schizophrenia-Related Microdeletion. J Neurosci. 2013;33(37):14825–14839. doi: 10.1523/JNEUROSCI.1611-13.2013. [DOI] [PMC free article] [PubMed] [Google Scholar]
- 42.Heckers S, Stone D, Walsh J, et al. Differential hippocampal expression of glutamic acid decarboxylase 65 and 67 messenger RNA in bipolar disorder and schizophrenia. Arch Gen Psychiatry. 2002;59:521–529. doi: 10.1001/archpsyc.59.6.521. [DOI] [PubMed] [Google Scholar]
- 43.Lau CG, Zukin RS. NMDA receptor trafficking in synaptic plasticity and neuropsychiatric disorders. Nat Rev Neurosci. 2007;8(6):413–426. doi: 10.1038/nrn2153. [DOI] [PubMed] [Google Scholar]
- 44.Ho VM, Lee JA, Martin KC. The cell biology of synaptic plasticity. Science. 2011;334(6056):623–628. doi: 10.1126/science.1209236. [DOI] [PMC free article] [PubMed] [Google Scholar]
- 45.Yassa MA, Stark CE. Pattern separation in the hippocampus. Trends Neurosci. 2011;34(10):515–525. doi: 10.1016/j.tins.2011.06.006. [DOI] [PMC free article] [PubMed] [Google Scholar]
- 46.Lacy JW, Yassa MA, Stark SM, Muftuler LT, Stark CE. Distinct pattern separation related transfer functions in human CA3/dentate and CA1 revealed using high-resolution fMRI and variable mnemonic similarity. Learn Mem. 2011;18(1):15–18. doi: 10.1101/lm.1971111. [DOI] [PMC free article] [PubMed] [Google Scholar]
- 47.Schlesiger MI, Cressey JC, Boublil B, et al. Hippocampal activation during the recall of remote spatial memories in radial maze tasks. Neurobiol Learn Mem. 2013 doi: 10.1016/j.nlm.2013.05.007. [DOI] [PubMed] [Google Scholar]
- 48.Rolls ET. A quantitative theory of the functions of the hippocampal CA3 network in memory. Front Cell Neurosci. 2013;7:98. doi: 10.3389/fncel.2013.00098. [DOI] [PMC free article] [PubMed] [Google Scholar]
- 49.McCullumsmith RE, Kristiansen LV, Beneyto M, et al. Decreased NR1, NR2A, and SAP102 transcript expression in the hippocampus in bipolar disorder. Brain Res. 2007;1127(1):108–118. doi: 10.1016/j.brainres.2006.09.011. [DOI] [PMC free article] [PubMed] [Google Scholar]
- 50.Ohnuma T, Kato H, Arai H, et al. Gene expression of PSD95 in prefrontal cortex and hippocampus in schizophrenia. NeuroReport. 2000;11(14):3133–3137. doi: 10.1097/00001756-200009280-00019. [DOI] [PubMed] [Google Scholar]
- 51.Dracheva S, Marras SA, Elhakem SL, et al. N-methyl-D-aspartic acid receptor expression in the dorsolateral prefrontal cortex of elderly patients with schizophrenia. Am J Psychiatry. 2001;158(9):1400–1410. doi: 10.1176/appi.ajp.158.9.1400. [DOI] [PubMed] [Google Scholar]
- 52.Clinton SM, Haroutunian V, Meador-Woodruff JH. Up-regulation of NMDA receptor subunit and post-synaptic density protein expression in the thalamus of elderly patients with schizophrenia. J Neurochem. 2006;98(4):1114–1125. doi: 10.1111/j.1471-4159.2006.03954.x. [DOI] [PubMed] [Google Scholar]
- 53.Bullock WM, Cardon K, Bustillo J, Roberts RC, Perrone-Bizzozero NI. Altered expression of genes involved in GABAergic transmission and neuromodulation of granule cell activity in the cerebellum of schizophrenia patients. Am J Psychiatry. 2008;165(12):1594–1603. doi: 10.1176/appi.ajp.2008.07121845. [DOI] [PubMed] [Google Scholar]
- 54.Mueller HT, Haroutunian V, Davis KL, Meador-Woodruff JH. Expression of the ionotropic glutamate receptor subunits and NMDA receptor-associated intracellular proteins in the substantia nigra in schizophrenia. Brain Res Mol Brain Res. 2004;121(1–2):60–69. doi: 10.1016/j.molbrainres.2003.11.004. [DOI] [PubMed] [Google Scholar]
- 55.Kristiansen LV, Beneyto M, Haroutunian V, Meador-Woodruff JH. Changes in NMDA receptor subunits and interacting PSD proteins in dorsolateral prefrontal and anterior cingulate cortex indicate abnormal regional expression in schizophrenia. Mol Psychiatry. 2006;11(8):737–47. 705. doi: 10.1038/sj.mp.4001844. [DOI] [PubMed] [Google Scholar]
- 56.Scarr E, Beneyto M, Meador-Woodruff JH, Dean B. Cortical glutamatergic markers in schizophrenia. Neuropsychopharmacology. 2005;30(8):1521–1531. doi: 10.1038/sj.npp.1300758. [DOI] [PubMed] [Google Scholar]
- 57.Beneyto M, Meador-Woodruff JH. Lamina-specific abnormalities of NMDA receptor-associated postsynaptic protein transcripts in the prefrontal cortex in schizophrenia and bipolar disorder. Neuropsychopharmacology. 2008;33(9):2175–2186. doi: 10.1038/sj.npp.1301604. [DOI] [PubMed] [Google Scholar]
- 58.Volk DW, Matsubara T, Li S, et al. Deficits in Transcriptional Regulators of Cortical Parvalbumin Neurons in Schizophrenia. Am J Psychiatry. 2012 doi: 10.1176/appi.ajp.2012.12030305. [DOI] [PMC free article] [PubMed] [Google Scholar]
- 59.Lewis DA, Fish KN, Arion D, Gonzalez-Burgos G. Perisomatic inhibition and cortical circuit dysfunction in schizophrenia. Curr Opin Neurobiol. 2011;21(6):866–872. doi: 10.1016/j.conb.2011.05.013. [DOI] [PMC free article] [PubMed] [Google Scholar]
- 60.Lisman JE, Coyle JT, Green RW, et al. Circuit-based framework for understanding neurotransmitter and risk gene interactions in schizophrenia. Trends Neurosci. 2008 doi: 10.1016/j.tins.2008.02.005. [DOI] [PMC free article] [PubMed] [Google Scholar]
- 61.Konradi C, Eaton M, MacDonald ML, et al. Molecular evidence for mitochondrial dysfunction in bipolar disorder. Arch Gen Psychiatry. 2004;61(3):300–308. doi: 10.1001/archpsyc.61.3.300. [DOI] [PubMed] [Google Scholar]
- 62.Benes FM, Lim B, Matzilevich D, et al. Regulation of the GABA cell phenotype in hippocampus of schizophrenics and bipolars. Proc Natl Acad Sci U S A. 2007;104(24):10164–10169. doi: 10.1073/pnas.0703806104. [DOI] [PMC free article] [PubMed] [Google Scholar]
- 63.Benes FM, Lim B, Matzilevich D, Subburaju S, Walsh JP. Circuitry-based gene expression profiles in GABA cells of the trisynaptic pathway in schizophrenics versus bipolars. Proc Natl Acad Sci U S A. 2008;105(52):20935–20940. doi: 10.1073/pnas.0810153105. [DOI] [PMC free article] [PubMed] [Google Scholar]
Associated Data
This section collects any data citations, data availability statements, or supplementary materials included in this article.