

Abstract
Objective
This study determines effects of elevated body mass index (BMI) on type 2 diabetes mellitus (DM) onset and its complications among U.S. elderly.
Design and Methods
Data came from the Medicare Current Beneficiary Survey (MCBS), 1991-2010. A Cox proportional hazard model was used to assess effects of elevated BMI at the first MCBS interview on DM diagnosis, complications, and insulin dependence onset among Medicare beneficiaries with no prior DM diagnosis and not enrolled in Medicare Advantage (N=14,657).
Results
Among DM-diagnosed individuals, elevated BMIs were associated with progressively higher risk of adverse outcomes. For women, hazard ratio (HR) of insulin dependence ranged from a 1.77 at 25 ≤ BMI ≤ 27.49 to 3.57 at BMI ≥ 40. A similar pattern was observed in risk for cardiovascular (HR=1.34 to HR=2.45), cerebrovascular (HR=1.30 to HR=2.00), renal (HR=1.31 to HR=2.23), and lower extremity complications (HR=1.41 to HR=2.95). In men, increased risks for DM complications occurred at higher BMI (27.5 ≤ BMI ≤ 29.99) levels than in women. Ocular complications occurred at higher BMI levels than other complication types in both genders.
Conclusions
Having even moderately elevated BMI is associated with increased risk of developing DM complications.
INTRODUCTION
Type 2 diabetes mellitus (DM) is a common disease whose prevalence is expected to double by the year 2030 (1). The mean lifetime risk of developing type 2 DM for individuals born in the U.S. in 2000 was 38.5% for men and 32.8% for women (2). In 2006, the U.S. had a crude DM prevalence rate of 12.9% among individuals 20+ years, of whom approximately 40% were undiagnosed (3). The prevalence of DM increases with age and peaks at 60-74. Among elderly aged 60-74, 29.9% have DM, and another 36.85% are considered pre-diabetic, thus yielding a total diabetes and pre-diabetes prevalence rate of 66.7% (3). Currently, diagnosed with type 2 DM, an individual faces a mean duration of disease of 14.9 (men) and 17.0 (women) years, and a reduction in life expectancy of 7.3 (men) and 9.5 (women) years (2).
At the same time, the prevalence of excess body weight has increased dramatically in the U.S. in the past 50 years (4; 5). As of 2010, 69.2 % of the adult U.S population was overweight (body mass index (BMI) 25 ≤ BMI < 30) or obese (BMI ≥ 30) (6). Among adults over age 60 the prevalence of excess weight was even higher, with 76.5% of men and 72.5% of women overweight or obese(6). Adult obesity is forecasted to rise by 33% in the next two decades with severe obesity prevalence rising by 130% (7). Combined with the aging of the baby-boom generation, these projections imply that there will be as many as 65 million more obese adults in 2030 than in 2010, of whom 24 million will be over age 60 (8).
Several studies have reported a strong association between excess weight and increased risk of death, placing the overweight group at a 40% higher and the obese group at up to 300% higher risk of death than individuals whose BMI is normal (18.5 ≤ BMI < 25) (9-11). Excess weight and physical inactivity are also associated with an increased risk of developing various diseases, particularly type 2 diabetes (12-22). Since excess weight is an important predictor of type 2 DM, the term “diabesity” was proposed by Astrup and Finer in 2000 (23). Specifically, In comparison to women with normal BMI, overweight, obese class I and II (30 ≤ BMI < 39.99), and class III (BMI ≥ 40) individuals face increased risks of developing type 2 DM with 7.6%, 20.1% and 38.8% greater risk respectively (24).
Moreover, among adults over age 65, the incidence of DM complications has been rising, except for eye-related complications (25). For example, today the risk of acute myocardial infarction (AMI) for individuals with type 2 DM is as high as that for non-diabetic individuals who have previously had an AMI (26). Individuals with DM are also 17 times more likely to have an amputation due to peripheral vascular disease, and are at an increased risk of developing nephropathy, retinopathy, and coronary heart disease among other adverse outcomes (23).
In this study, we analyzed the association between the excess weight and the time to first diagnosis of type 2 DM and its complications among elderly individuals, using a nationally representative survey of elderly individuals from the Medicare Current Beneficiary Survey (MCBS) conducted in 1991-2010. Our hypothesis is that excess weight is not only associated with an increased risk of type 2 DM, a relationship well documented in the existing literature, but leads to a greater risk of a variety of DM complications.
METHODS AND PROCEDURES
This study used data from the MCBS merged by a unique identifier with Medicare claims data. Conducted by the U. S. Centers for Medicare and Medicaid Services (CMS), the MCBS collects information on a rotating panel of roughly 12,000 Medicare beneficiaries one third of who are replaced annually. Each participant is interviewed for four years or until withdrawal from the survey due to death, being rotated out, or not responding to the survey. The survey is administered at four-month intervals to acquire continuous information on expenditures on personal health care services, payments by insurers for care the beneficiary received, insurance coverage other than Medicare, and respondent characteristics including household income, height, and weight. The data are nationally representative of Medicare-covered persons in the U.S. population.
Medicare claims data came from the inpatient, outpatient, Medicare Part B and durable medical equipment claims provided CMS. Claims data were available for 1991-2010. We obtained claims on each respondent for each year the respondent was enrolled in Medicare, even outside the 4-year window during which the person was interviewed by MCBS. Thus, for example, if the respondent was first interviewed in 2001 and was age 77 in that year, we used all available respondent's claims data from 1991 to 2000 for the look back period to determine whether or not the person had been diagnosed with DM prior to entry into the MCBS (baseline) and from 2001 to 2010 or departure from Medicare for any reason, for the follow-up period. The mean number of years for look back periods was 3.96 (standard deviation (std.) 3.56). For follow-up, the mean number of years was 6.68 (std. 4.05). The hazard model accounted for right-censoring of the data. In the construction of the sample, a condition was counted as a DM complication only if the person had a prior a DM diagnosis.
Beneficiaries in our analysis sample were born between 1926 and 1944, were not enrolled in a Medicare Advantage plan, and did not have a DM diagnosis at the time of their first (baseline) MCBS interview. Data on age, race, sex, educational attainment, smoking status, income strata, and BMI were drawn from the MCBS cost and use and access to care files. Beneficiaries with incomplete information were dropped. After exclusions, our sample size consisted of 14,657 persons. Coding of DM diagnosis and DM complications was based on International Classification of Diseases, 9th Revision Clinical Modification (ICD-9-CM) and Current Procedural Terminology (CPT-4) codes. We identified beneficiaries with a DM diagnosis and a diagnosis of DM complications from Medicare claims data.
We identified the time in 3-month intervals from an individual's first interview to the first DM diagnosis and to each major complication category (Table 1). We focused on common cardiovascular, cerebrovascular, renal, ocular and lower extremity complications. Risks were calculated both for the category as a whole (e.g. any cardiovascular complication) and for specific conditions within each category (e.g., acute myocardial infarction (AMI)).
TABLE 1.
Condition List
| Condition | ICD-9-CM* / CPT-4** CODES |
|---|---|
| Diabetes Mellitus (n=4,542) | 250.xx |
| Insulin Dependence | 250.01, 250.03 |
| Cardiovascular Complication, Any (n=2,194) | |
| Coronary Artery Disease | 411.xx, 413.xx, 414.xx |
| Myocardial Infarction | 410.xx, 412.xx |
| Congestive Heart Failure | 398.91, 402.01, 402.11, 402.91, 404.01, 404.03, 404.11, 404.13, 404.91, 404.93, 428.0-428.4, 428.9 |
| Occlusion or Stenosis | 433.xx, 434.xx |
| Cerebrovascular Complication, Any (n=1,608) | |
| Stroke | 430.xx, 431.xx, 432.xx, 436.xx |
| Transient Ischemic Attack | 435.xx |
| Cerebrovascular Carotid Bruit | 785.9, 75636 |
| Renal Complication, Any (n=1,305) | |
| Proteinuria | 791.xx |
| Chronic Renal Failure | 404.12, 404.13, 404.92, 403.01, 403.11, 585.xx, 586.xx |
| Ocular Complication, Any (n=409) | |
| Diabetic Macular Edema | 362.07, 362.53, 362.83 |
| Background Diabetic Retinopathy | 362.01 |
| Proliferative Diabetic Retinopathy | 362.02 |
| Lower Extremity Complication, Any (n=3,155) | |
| Ulcer | 707.1-707.9 |
| Gangrene | 250.7, 440.24, 785.4, 040.0 |
International Classification of Diseases, 9th Revision Clinical Modification administrative code.
Current Procedural Terminology administrative code.
We calculated the BMI of individuals at the first MCBS interview (baseline).We used a modification of adult overweight (25 ≤ BMI ≤ 29.99) and obesity (BMI ≥ 30) criteria specified by the World Health Organization (27). We classified persons into four BMI categories: BMI between 25 and 27.49; BMI between 27.50 and 29.99; BMI between 30 and 39.99; BMI greater than or equal to 40 adopting additional cut-off criteria from the WHO (27). Normal weight individuals (18.5 ≤ BMI < 25) were use as the reference group. Body mass index was calculated as weight divided by the square of height, based on the self-reported weight and height measures from MCBS. Other control variables included age, income, race, educational attainment (in years), smoking status, hypertension and the year of the baseline interview to account for secular trends in practice and technology use. Results on explanatory variables other than BMI are not reported to conserve space. We conducted separate analysis for males and females to measure gender-specific differences in time to diagnosis by gender. We estimate the effect of BMI measured at baseline on time to first DM diagnosis and to specific DM complications by calculating hazard ratios using Cox proportional hazards implemented by the stcox procedure of Stata 12.0; Statacorp, College Station, TX. The hazard ratios represent how much more likely individuals with elevated BMI are to develop DM or its complications over a short period of time for patients who have not yet develop these conditions. The hazard ratio for the Cox hazard model can be interpreted as a weighted relative risk over the entire study period.
RESULTS
On average, individuals in the non–DM group were older − 68 vs. 66 years, had a slightly higher mean annual income − $32,000 vs. $27,000, slightly lower smoking rates − 66% vs. 68%, higher educational attainment − 74% vs. 65% with at least a high school level education, and were more likely to be white − 90% vs. 84% (Table 2). The non-DM group was less likely to have been diagnosed with hypertension − 58% vs. 61% and to be obese −18% vs. 31%. Among persons in the DM group, lower extremity and cardiovascular were the most prevalent complications, occurring in 69.5% and 70.3% of such individuals, respectively. Ocular complications were least prevalent, occurring in just 9% of the DM group. Overall, demographic characteristics were similar among the five DM complication groups.
TABLE 2.
Sample Characteristics at Baseline
| Group |
Complication Groups (within DM Group) |
||||||
|---|---|---|---|---|---|---|---|
| Non-DM | DM | Cardio-vascular | Cerebro-vascular | Renal | Ocular | Lower Extremity | |
| Panel A*: | |||||||
| White | 90.79 | 83.78 | 84.40 | 83.08 | 81.84 | 79.21 | 84.24 |
| Black | 6.39 | 11.40 | 11.15 | 12.75 | 13.87 | 14.43 | 11.13 |
| Other | 2.82 | 4.82 | 4.45 | 4.17 | 4.29 | 6.36 | 4.63 |
| Male | 47.28 | 49.43 | 51.60 | 49.63 | 50.04 | 50.12 | 47.07 |
| Female | 52.72 | 50.57 | 48.40 | 50.37 | 49.96 | 49.88 | 52.93 |
| High-school education | 74.35 | 64.82 | 62.68 | 61.75 | 59.46 | 62.35 | 63.99 |
| Ever smoked | 66.25 | 68.12 | 72.04 | 71.21 | 71.72 | 65.28 | 67.80 |
| Smokes now | 16.84 | 19.04 | 20.51 | 21.64 | 22.99 | 18.38 | 19.68 |
| Hypertension | 57.60 | 61.12 | 63.56 | 64.24 | 65.44 | 51.10 | 62.41 |
| BMI < 25.00 | 42.19 | 29.35 | 29.00 | 31.03 | 28.20 | 27.63 | 27.95 |
| BMI 25.00-27.49 | 25.29 | 23.45 | 23.07 | 23.51 | 21.99 | 20.05 | 23.17 |
| BMI 27.50-29.99 | 14.59 | 16.42 | 15.62 | 15.61 | 16.32 | 18.09 | 16.32 |
| BMI 30.00-39.99 | 16.66 | 27.21 | 28.52 | 26.43 | 29.58 | 30.32 | 28.15 |
| BMI ≥ 40.00 | 1.27 | 3.57 | 3.79 | 3.42 | 3.91 | 3.91 | 4.41 |
| Panel B** : | |||||||
| Age | 68.17 ( 5.32) | 66.24 ( 5.41) | 65.96 ( 5.53) | 65.67 ( 5.43) | 65.79 ( 5.58) | 65.18 ( 5.12) | 65.86 ( 5.55) |
| Income ('000s) | 31.86 (26.28) | 26.81 (24.47) | 25.73 (24.25) | 24.49 (22.91) | 23.95 (22.42) | 25.98 (24.04) | 26.01 (24.42) |
| Sample size | 10,115 | 4,542 | 3,194 | 1,608 | 1,305 | 409 | 3,155 |
Percentage of sample.
Mean (standard deviation).
Higher than normal BMI was consistently associated with an increased probability of being diagnosed with type 2 DM (Table 3). Among overweight persons, women were at a greater risk of a DM diagnosis than men. Women became at an increased risk of DM (HR=1.31) when they are just slightly overweight (25 ≤ BMI ≤ 27.49), while men became at an increased risk of DM (HR=1.34) in the upper range of the overweight category (27.5 ≤ BMI ≤ 29.99). The risk of developing DM at 30 ≤ BMI ≤ 39.99 relative to persons with normal BMI was nearly the same for both men and women (HR=1.98 for men vs. HR=1.96 for women). At BMI ≥ 40, the risk of DM was higher among men (HR=2.85 for men vs. HR=2.51 for women).
TABLE 3.
Hazard Ratios for Diabetes Mellitus and Common Complications by Body Mass Index and Gender*
| Body Mass Index |
||||||||
|---|---|---|---|---|---|---|---|---|
| 25.00-27.49 | 27.50-29.99 | 30.00-39.99 | ≥ 40.00 | |||||
| Women | Men | Women | Men | Women | Men | Women | Men | |
| Diabetes Mellitus | 1.31 | 1.14 | 1.57 | 1.34 | 1.96 | 1.98 | 2.51 | 2.85 |
| (1.16-1.47) | (1.01-1.28) | (1.37-1.79) | (1.18-1.52) | (1.75-2.19) | (1.75-2.22) | (2.04-3.07) | (2.10-3.85) | |
| [0.00] | [0.02] | [0.00] | [0.00] | [0.00] | [0.00] | [0.00] | [0.00] | |
| Insulin Dependence | 1.77 | 1.23 | 1.97 | 1.58 | 2.65 | 2.11 | 3.57 | 4.62 |
| (1.33-2.33) | (0.93-1.61) | (1.44-2.69) | (1.17-2.10) | (2.03-3.43) | (1.60-2.76) | (2.36-5.39) | (2.73-7.82) | |
| [0.00] | [0.15] | [0.00] | [0.00] | [0.00] | [0.00] | [0.00] | [0.00] | |
| Complications: | ||||||||
| Cardiovascular | 1.34 | 1.03 | 1.45 | 1.22 | 2.04 | 1.91 | 2.45 | 2.88 |
| (1.15-1.54) | (0.90-1.18) | (1.22-1.71) | (1.05-1.42) | (1.77-2.33) | (1.67-2.18) | (1.92-3.11) | (2.05-4.04) | |
| [0.00] | [0.66] | [0.00] | [0.01] | [0.00] | [0.00] | [0.00] | [0.00] | |
| Cerebrovascular | 1.30 | 0.97 | 1.33 | 1.12 | 1.70 | 1.47 | 2.00 | 1.46 |
| (1.06-1.57) | (0.80-1.17) | (1.05-1.67) | (0.90-1.38) | (1.41-2.05) | (1.20-1.78) | (1.42-2.81) | (0.83-2.57) | |
| [0.01] | [0.77] | [0.02] | [0.29] | [0.00] | [0.00] | [0.00] | [0.19] | |
| Renal | 1.31 | 1.01 | 1.55 | 1.30 | 1.86 | 2.13 | 2.23 | 2.56 |
| (1.04-1.63) | (0.80-1.25) | (1.20-2.0) | (1.02-1.64) | (1.50-2.29) | (1.71-2.63) | (1.54-3.22) | (1.49-4.38) | |
| [0.02] | [0.95] | [0.00] | [0.03] | [0.00] | [0.00] | [0.00] | [0.00] | |
| Ocular | 1.29 | 0.89 | 1.84 | 1.43 | 2.02 | 2.17 | 1.65 | 4.53 |
| (0.85-1.92) | (0.59-1.33) | (1.18-2.83) | (0.94-2.16) | (1.39-2.93) | (1.48-3.17) | (0.77-3.52) | (2.12-9.67) | |
| [0.22] | [0.58] | [0.01] | [0.09] | [0.00] | [0.00] | [0.19] | [0.00] | |
| Lower Extremity | 1.41 | 1.13 | 1.55 | 1.47 | 2.06 | 2.13 | 2.95 | 3.79 |
| (1.22-1.61) | (0.97-1.30) | (1.32-1.81) | (1.25-1.72) | (1.80-2.35) | (1.84-2.46) | (2.35-3.69) | (2.73-5.24) | |
| [0.00] | [0.11] | [0.00] | [0.00] | [0.00] | [0.00] | [0.00] | [0.00] | |
Statistics presented are hazard ratios.
Note: the hazard ratio estimates are based on Cox proportional hazard model controlling for race, education, age, age squared, income, marital status, smoking status, hypertension and the survey year. Statistically significant coefficients are in bold, 95% confidence intervals are in parenthesis, p-values reported in square brackets.
For women, a slightly overweight status was associated the HR = 1.77 of developing insulin dependence, but was not a significant predictor of insulin dependence for men. Whereas at BMI ≥ 40, the HR increased to 4.62 for men and 3.57 for women relative to a person with 18.5 ≤ BMI < 25.
Elevated BMI was also associated with progressively higher risk for all DM complications (Table 3). The relationship between excess weight and being diagnosed with a DM complication was stronger for women than for men. For women, being just slightly overweight led to a higher risk of cardiovascular (HR=1.34), cerebrovascular (HR=1.30), renal (HR=1.31), and lower extremity (HR= 1.41) complications. For men, a slightly overweight status was not a significant risk factor for developing any DM complications. For women in the upper range of the overweight category, the risk increased for cardiovascular (HR=1.45), renal (HR=1.55), ocular (HR=1.84), and lower extremity (HR=1.55) complications. Men too became at a greater risk for cardiovascular (HR=1.22), renal (HR=1.30), and lower extremity complications (HR=1.47) relative to men with normal BMI.
The magnitude of hazard ratios continues to increase for both men and women with further increases in BMI. Women with 30 ≤ BMI ≤ 39.99 were at an increased risk of cardiovascular (HR=2.04), cerebrovascular (HR=1.70), renal (HR=1.86), ocular (HR=2.02), and lower extremity (HR=2.06); those with BMI ≥ 40 had a much greater risk of cardiovascular (HR=2.45), cerebrovascular (HR=2.00), renal (HR=2.23), ocular (HR=1.65), and lower extremity (HR=2.95) relative to women with 18.5 ≤ BMI < 25. At 30 ≤ BMI ≤ 39.99, men too were at an increased risk of cardiovascular (HR=1.91), cerebrovascular (HR=1.47), renal (HR=2.13), ocular (HR=2.17), and lower extremity (HR=2.13) complications; and those with BMI ≥ 40 were at a much greater relative risk of cardiovascular (HR=2.88), renal (HR=2.56), ocular (HR=4.53), and lower extremity (HR=3.79)) relative to men with normal BMI. Figure 1 illustrates the results for both genders by BMI category.
Figure 1.

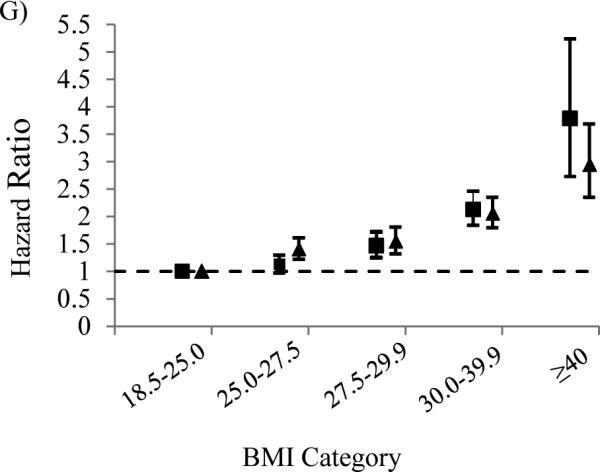
Hazard ratios of type 2 diabetes mellitus (A), insulin dependence (B), cardiovascular (C), cerebrovascular (D), renal E), ocular F), and lower extremity G) complications by body mass index (BMI) among participants of the Medicare Current Beneficiary Survey, United States, 1991-2010. ■ Men over age 65; ▲ women over age 65. Bars represent 95% confidence intervals. Models were adjusted for race, education, age, age squared, income, marital status, smoking status, hypertension and the survey year.
Table 4 reports hazard ratios for select types of cardiovascular (coronary artery disease, myocardial infarction, chronic heart failure, occlusion or stenosis), cerebrovascular (stroke, transient ischemic attack, cerebrovascular carotid bruit), renal (proteinuria, chronic renal failure, end stage renal disease), ocular (background diabetic retinopathy), and lower extremity (ulcer and gangrene) complications.
TABLE 4.
Hazard Ratios of Select Diabetes Mellitus Complications by Body Mass Index and Gender*
| Body Mass Index |
||||||||
|---|---|---|---|---|---|---|---|---|
| 25.00-27.49 | 27.50-29.99 | 30.00-39.99 | ≥ 40.00 | |||||
| Women | Men | Women | Men | Women | Men | Women | Men | |
| Coronary Artery Disease | 1.30 | 1.05 | 1.50 | 1.19 | 2.00 | 1.90 | 2.49 | 2.15 |
| (1.10-1.53) | (0.90-1.22) | (1.24-1.81) | (1.05-1.42) | (1.77-2.33) | (1.67-2.18) | (1.92-3.26) | (1.43-3.21) | |
| [0.00] | [0.50] | [0.00] | [0.04] | [0.00] | [0.00] | [0.00] | [0.00] | |
| Myocardial Infarction | 1.20 | 1.47 | 1.37 | 1.56 | 2.03 | 2.50 | 1.72 | 3.46 |
| (0.89-1.61) | (1.15-1.85) | (0.97-1.92) | (1.20-2.03) | (1.54-2.64) | (1.97-3.16) | (1.02-2.90) | (2.00-5.97) | |
| [0.21] | [0.00] | [0.07] | [0.00] | [0.00] | [0.00] | [0.04] | [0.00] | |
| Chronic Heart Failure | 1.19 | 1.16 | 1.56 | 1.35 | 2.16 | 2.41 | 3.19 | 4.95 |
| (0.97-1.45) | (0.96-1.38) | (1.24-1.94) | (1.10-1.65) | (1.80-2.59) | (2.01-2.87) | (2.38-4.25) | (3.38-7.22) | |
| [0.09] | [0.12] | [0.00] | [0.00] | [0.00] | [0.00] | [0.00] | [0.00] | |
| Occlusion or Stenosis | 1.17 | 0.93 | 1.20 | 1.03 | 1.38 | 1.42 | 1.60 | 1.43 |
| (0.95-1.44) | (0.75-1.13) | (0.92-1.53) | (0.81-1.30) | (1.12-1.70) | (1.14-1.75) | (1.08-2.37) | (0.77-2.64) | |
| [0.14] | [0.47] | [0.16] | [0.78] | [0.00] | [0.00] | [0.02] | [0.25] | |
| Stroke | 1.22 | 0.96 | 1.06 | 0.98 | 1.54 | 1.42 | 2.17 | 1.89 |
| (0.92-1.60) | (0.75-1.23) | (0.74-1.49) | (0.73-1.29) | (1.17-2.01) | (1.10-1.83) | (1.39-3.39) | (0.98-3.61) | |
| [0.16] | [0.76] | [0.76] | [0.88] | [0.00] | [0.00] | [0.00] | [0.05] | |
| Transient Ischemic Attack | 1.16 | 1.02 | 1.36 | 1.22 | 1.28 | 1.39 | 1.89 | 0.70 |
| (0.86-1.55) | (0.75-1.36) | (0.97-1.89) | (0.88-1.68) | (0.95-1.71) | (1.02-1.89) | (1.14-3.13) | (0.22-2.24) | |
| [0.32] | [0.91] | [0.08] | [0.23] | [0.10] | [0.04] | [0.01] | [0.55] | |
| Cerebrovascular Carotid | 1.17 | 0.71 | 1.30 | 1.08 | 1.79 | 1.27 | 1.61 | 1.17 |
| Bruit | (0.87-1.57) | (0.51-0.98) | (0.91-1.82) | (0.77-1.50) | (1.35-2.35) | (0.92-1.74) | (0.92-2.80) | (0.42-3.20) |
| [0.29] | [0.04] | [0.14] | [0.65] | [0.00] | [0.13] | [0.09] | [0.77] | |
| Proteinuria | 1.40 | 0.99 | 1.54 | 1.09 | 1.98 | 2.23 | 1.78 | 0.89 |
| (1.00-1.94) | (0.68-1.43) | (1.05-2.26) | (0.71-1.65) | (1.44-2.71) | (1.57-3.17) | (0.95-3.32) | (0.21-3.68) | |
| [0.05] | [0.67] | [0.03] | [0.87] | [0.00] | [0.13] | [0.37] | [0.77] | |
| Chronic Renal Failure | 1.19 | 1.01 | 1.54 | 1.31 | 1.88 | 2.11 | 2.20 | 2.87 |
| (0.90-1.57) | (0.79-1.29) | (1.13-2.08) | (1.00-1.71) | (1.46-2.42) | (1.66-2.67) | (1.42-3.41) | (1.61-5.13) | |
| [0.22] | [0.91] | [0.01] | [0.04] | [0.00] | [0.00] | [0.00] | [0.00] | |
| Background Diabetic | 1.22 | 0.98 | 2.01 | 1.96 | 2.21 | 2.58 | 1.69 | 4.92 |
| Retinopathy | (0.72-2.04) | (0.57-1.69) | (1.19-3.38) | (1.16-3.29) | (1.40-3.47) | (1.56-4.23) | (0.69-4.10) | (1.86-12.96) |
| [0.45] | [0.96] | [0.00] | [0.01] | [0.00] | [0.00] | [0.25] | [0.00] | |
| Ulcer | 1.41 | 0.91 | 1.56 | 1.33 | 1.79 | 1.75 | 3.34 | 4.97 |
| (1.01-1.95) | (0.64-1.27) | (1.06-2.28) | (0.93-1.89) | (1.29-2.46) | (1.26-2.43) | (2.04-5.45) | (2.76-8.95) | |
| [0.04] | [0.58] | [0.02] | [0.11] | [0.00] | [0.00] | [0.00] | [0.00] | |
| Gangrene | 1.25 | 1.03 | 1.52 | 1.81 | 1.98 | 2.68 | 3.42 | 5.42 |
| (0.81-1.93) | (0.69-1.52) | (0.93-2.45) | (1.22-2.67) | (1.33-2.94) | (1.87-3.83) | (1.92-6.10) | (2.72-10.80) | |
| [0.30] | [0.87] | [0.09] | [0.00] | [0.00] | [0.00] | [0.00] | [0.00] | |
Statistics presented are hazard ratios.
Note: the hazard ratio estimates are based on Cox proportional hazard model controlling for race, education, age, age squared, income, marital status, smoking status, hypertension and the survey year. Statistically significant coefficients are in bold, 95% confidence intervals are in parenthesis, p-values reported in square brackets.
DISCUSSION
This study examines the effect of BMI on time to diagnosis of DM and its complications among individuals over age 65. We found excess weight and obesity to be a major contributing factor to type 2 DM and its complications for both men and women Both men and women in the overweight category (25 ≤ BMI ≤ 29.99) were at an increased risk of developing DM, with 30% and 10% greater risks respectively. At 30 ≤ BMI ≤ 39.99 both genders were at a 100% greater risk of DM than counterparts with a normal BMI. BMI ≥40 increases the odds of developing DM by as much as 150% for women and 180% for men. These results suggest a stronger association between BMI and onset of DM than was previously documented in similar studies (24).
For prevention of DM complications, keeping a healthy weight, among other things, may be more important to women than to men at lower levels of excess weight, since for women DM complications are associated even with just slightly overweight status (25 ≤ BMI ≤ 27.49). For men, however, the increase in risk for DM complications doesn't come until BMI ≥ 27.5. Individuals in the obese category (BMI≥30) were consistently at greater risk of DM complications—as much as 168% higher for all complication types taken together, irrespective of gender. Moreover, obese men are at a greater risk of developing cardiovascular, renal, ocular, and lower extremity complications in comparison to women with the same level of BMI.
Our results suggest that weight-loss is an important preventive strategy for overweight persons with pre-diabetes, as it may delay the progression to DM. In addition, weight-management is important for prevention of DM-related complications, since BMI even slightly above 25 puts one at a greater relative risk of a complication. Many existing weight-loss programs, including dietary, physical activity and behavioral interventions are successful in long-term weight reduction and lead to a significant decrease in diabetes incidence (28-32). One such program for the elderly, Medical Nutrition Therapy (MNT), provides education, diet and physical activity counseling, and weight-loss prescriptions (in some cases) to reduce the risk of developing diabetes complications (33). However, this program is currently the only one covered by Medicare and other insurers (when administered by a dietician) (34; 35). If the “diabesity” epidemic is to be contained, it may be desirable to expand the coverage to other weight-loss interventions, such as partially reimbursing for gym membership or other fitness-related activities. Such strategies might prove to be a cost-effective in the long – run for managing diabetes mellitus and its complications in elderly individuals (36; 37).
Our study has several important strengths. The analysis was based on nationally representative longitudinal data. The diagnosis of DM, its complications, and insulin dependence is based on a physician report. We employed a look back period with a mean value of nearly 4 years to determine whether or not the person had been previously diagnosed with_DM. The follow-up period for monitoring a DM diagnosis and DM complications was nearly seven years on average.
We also acknowledge these study limitations. Most importantly, weight and height were obtained from self-report at MCBS interviews. To the extent that height was overstated and weight understated, the true magnitude of the relationships between excess weight and onset of DM and its complications could be somewhat overstated, especially for the overweight category (38; 39). Medicare claims are filed for administrative purposes not for research, and for this reason, some relevant information, such as laboratory findings and findings from clinical examination more detailed than a diagnosis, are lacking. Persons who did not visit health care professionals would not have received a diagnosis and hence were combined with the non-DM and non-DM complications groups.
ACKNOWLEDGEMENTS
The Guarantor, Dr. Frank A. Sloan, had full access to all of the data in the study and takes responsibility for the integrity of the data and the accuracy of the data analysis. Publication of this article was supported in part by the National Institute on Aging (grant R01-AG017473). The sponsors had no role in design and conduct of the study, collection, management, analysis, interpretation of the data, preparation, review, approval of the manuscript, nor decision to submit the manuscript for publication. All authors contributed significantly to the manuscript.
Footnotes
There is no conflict of interest to be reported.
Contributor Information
Natallia Gray, Department of Economics and Finance, Southeast Missouri University.
Gabriel Picone, Department of Economics, University of South Florida
Frank Sloan, Department of Economics, Duke University
Arseniy Yashkin, Department of Economics, Duke University
REFERENCES
- 1.Zimmet P, Alberti K, Shaw J. Global and societal implications of the diabetes epidemic. Nature. 2001;414:782–787. doi: 10.1038/414782a. [DOI] [PubMed] [Google Scholar]
- 2.Narayan KV, Boyle JP, Thompson TJ, Sorensen SW, Williamson DF. Lifetime risk for diabetes mellitus in the United States. JAMA. 2003;290:1884–1890. doi: 10.1001/jama.290.14.1884. [DOI] [PubMed] [Google Scholar]
- 3.Cowie CC, Rust KF, Ford ES, Eberhardt MS, Byrd-Holt DD, Li C, Williams DE, Gregg EW, Bainbridge KE, Saydah SH. Full accounting of diabetes and pre-diabetes in the US population in 1988–1994 and 2005–2006. Diabetes Care. 2009;32:287–294. doi: 10.2337/dc08-1296. [DOI] [PMC free article] [PubMed] [Google Scholar]
- 4.Stein CJ, Colditz GA. The epidemic of obesity. J Clin Endocrinol Metab. 2004;89:2522–2525. doi: 10.1210/jc.2004-0288. [DOI] [PubMed] [Google Scholar]
- 5.Ogden CL, Carroll MD, Curtin LR, McDowell MA, Tabak CJ, Flegal KM. Prevalence of overweight and obesity in the United States, 1999-2004. JAMA. 2006;295:1549–1555. doi: 10.1001/jama.295.13.1549. [DOI] [PubMed] [Google Scholar]
- 6.Flegal KM, Carroll MD, Kit BK, Ogden CL. Prevalence of obesity and trends in the distribution of body mass index among US adults, 1999-2010. JAMA. 2012;307:491–497. doi: 10.1001/jama.2012.39. [DOI] [PubMed] [Google Scholar]
- 7.Finkelstein EA, Khavjou OA, Thompson H, Trogdon JG, Pan L, Sherry B, Dietz W. Obesity and severe obesity forecasts through 2030. Am J Prev Med. 2012;42:563–570. doi: 10.1016/j.amepre.2011.10.026. [DOI] [PubMed] [Google Scholar]
- 8.Wang YC, McPherson K, Marsh T, Gortmaker SL, Brown M. Health and economic burden of the projected obesity trends in the USA and the UK. The Lancet. 2011;378:815–825. doi: 10.1016/S0140-6736(11)60814-3. [DOI] [PubMed] [Google Scholar]
- 9.Adams KF, Schatzkin A, Harris TB, Kipnis V, Mouw T, Ballard-Barbash R, Hollenbeck A, Leitzmann MF. Overweight, obesity, and mortality in a large prospective cohort of persons 50 to 71 years old. N Engl J Med. 2006;355:763–778. doi: 10.1056/NEJMoa055643. [DOI] [PubMed] [Google Scholar]
- 10.Calle EE, Rodriguez C, Walker-Thurmond K, Thun MJ. Overweight, obesity, and mortality from cancer in a prospectively studied cohort of US adults. N Engl J Med. 2003;348:1625–1638. doi: 10.1056/NEJMoa021423. [DOI] [PubMed] [Google Scholar]
- 11.Flegal KM, Graubard BI, Williamson DF, Gail MH. Cause-specific excess deaths associated with underweight, overweight, and obesity. JAMA. 2007;298:2028–2037. doi: 10.1001/jama.298.17.2028. [DOI] [PubMed] [Google Scholar]
- 12.Guh DP, Zhang W, Bansback N, Amarsi Z, Birmingham CL, Anis AH. The incidence of comorbidities related to obesity and overweight: a systematic review and meta-analysis. BMC Public Health. 2009;9:88–107. doi: 10.1186/1471-2458-9-88. [DOI] [PMC free article] [PubMed] [Google Scholar]
- 13.Field AE, Coakley EH, Must A, Spadano JL, Laird N, Dietz WH, Rimm E, Colditz GA. Impact of overweight on the risk of developing common chronic diseases during a 10-year period. Arch Intern Med. 2001;161:1581. doi: 10.1001/archinte.161.13.1581. [DOI] [PubMed] [Google Scholar]
- 14.Hu FB, Manson JE, Stampfer MJ, Colditz G, Liu S, Solomon CG, Willett WC. Diet, lifestyle, and the risk of type 2 diabetes mellitus in women. N Engl J Med. 2001;345:790–797. doi: 10.1056/NEJMoa010492. [DOI] [PubMed] [Google Scholar]
- 15.Mokdad AH, Ford ES, Bowman BA, Dietz WH, Vinicor F, Bales VS, Marks JS. Prevalence of obesity, diabetes, and obesity-related health risk factors, 2001. JAMA. 2003;289:76–79. doi: 10.1001/jama.289.1.76. [DOI] [PubMed] [Google Scholar]
- 16.Must A, Spadano J, Coakley EH, Field AE, Colditz G, Dietz WH. The disease burden associated with overweight and obesity. JAMA. 1999;282:1523–1529. doi: 10.1001/jama.282.16.1523. [DOI] [PubMed] [Google Scholar]
- 17.Gregg EW, Cheng YJ, Cadwell BL, Imperatore G, Williams DE, Flegal KM, Narayan KV, Williamson DF. Secular trends in cardiovascular disease risk factors according to body mass index in US adults. JAMA. 2005;293:1868–1874. doi: 10.1001/jama.293.15.1868. [DOI] [PubMed] [Google Scholar]
- 18.Sullivan PW, Morrato EH, Ghushchyan V, Wyatt HR, Hill JO. Obesity, inactivity, and the prevalence of diabetes and diabetes-related cardiovascular comorbidities in the US, 2000–2002. Diabetes Care. 2005;28:1599–1603. doi: 10.2337/diacare.28.7.1599. [DOI] [PubMed] [Google Scholar]
- 19.Sigal RJ, Kenny GP, Wasserman DH. Castaneda-Sceppa C: Physical activity/exercise and type 2 diabetes. Diabetes Care. 2004;27:2518–2539. doi: 10.2337/diacare.27.10.2518. [DOI] [PubMed] [Google Scholar]
- 20.Jung H-S, Chang Y, Yun KE, Kim C-W, Choi E-S, Kwon M-J, Cho J, Zhang Y, Rampal S, Zhao D, Kim HS, Shin H, Guallar E, Ryu S. Impact of body mass index, metabolic health, and weight change on incident diabetes in a Korean population. Obesity. 2014 doi: 10.1002/oby.20751. n/a-n/a. [DOI] [PubMed] [Google Scholar]
- 21.de Mutsert R, Sun Q, Willett WC, Hu FB, van Dam RM. Overweight in Early Adulthood, Adult Weight Change, and Risk of Type 2 Diabetes, Cardiovascular Diseases, and Certain Cancers in Men: a Cohort Study. American Journal of Epidemiology. 2014;179:1353–1365. doi: 10.1093/aje/kwu052. [DOI] [PMC free article] [PubMed] [Google Scholar]
- 22.Rudra CB, Sorensen TK, Leisenring WM, Dashow E, Williams MA. Weight Characteristics and Height in Relation to Risk of Gestational Diabetes Mellitus. American Journal of Epidemiology. 2007;165:302–308. doi: 10.1093/aje/kwk007. [DOI] [PubMed] [Google Scholar]
- 23.Astrup A, Finer N. Redefining type 2 diabetes:‘Diabesity’or ‘obesity dependent diabetes mellitus’? Obes Rev. 2000;1:57–59. doi: 10.1046/j.1467-789x.2000.00013.x. [DOI] [PubMed] [Google Scholar]
- 24.Hu FB, Manson JE, Stampfer MJ, Colditz G, Liu S, Solomon CG, Willett WC. Diet, lifestyle, and the risk of type 2 diabetes mellitus in women. Obstet Gynecol Surv. 2002;57:162–164. doi: 10.1056/NEJMoa010492. [DOI] [PubMed] [Google Scholar]
- 25.Sloan FA, Belsky D, Ruiz Jr D, Lee P. Changes in incidence of diabetes mellitus-related eye disease among US elderly persons, 1994-2005. Arch Ophthalmol. 2008;126:1548–1553. doi: 10.1001/archopht.126.11.1548. [DOI] [PMC free article] [PubMed] [Google Scholar]
- 26.Haffner SM, Lehto S, Rönnemaa T, Pyörälä K, Laakso M. Mortality from coronary heart disease in subjects with type 2 diabetes and in nondiabetic subjects with and without prior myocardial infarction. N Engl J Med. 1998;339:229–234. doi: 10.1056/NEJM199807233390404. [DOI] [PubMed] [Google Scholar]
- 27. [June 24 2013];Global database on body mass index: BMI classification [article online] 2013 Available from http://apps.who.int/bmi/index.jsp?introPage=intro_3.html.
- 28.Norris SL, Zhang X, Avenell A, Gregg E, Bowman B, Schmid CH, Lau J. Long-term effectiveness of weight-loss interventions in adults with pre-diabetes: a review. Am J Prev Med. 2005;28:126–139. doi: 10.1016/j.amepre.2004.08.006. [DOI] [PubMed] [Google Scholar]
- 29.Norris SL, Zhang X, Avenell A, Gregg E, Bowman B, Serdula M, Brown TJ, Schmid CH, Lau J. Long-term effectiveness of lifestyle and behavioral weight loss interventions in adults with type 2 diabetes: a meta-analysis. AM J Med. 2004;117:762–774. doi: 10.1016/j.amjmed.2004.05.024. [DOI] [PubMed] [Google Scholar]
- 30.Appel LJ, Clark JM, Yeh H-C, Wang N-Y, Coughlin JW, Daumit G, Miller ER, III, Dalcin A, Jerome GJ, Geller S. Comparative effectiveness of weight-loss interventions in clinical practice. N Engl J Med. 2011;365:1959–1968. doi: 10.1056/NEJMoa1108660. [DOI] [PMC free article] [PubMed] [Google Scholar]
- 31.Norris S, Zhang X, Avenell A, Gregg E, Brown T, Schmid C, Lau J. Long-term non-pharmacological weight loss interventions for adults with type 2 diabetes mellitus. Cochrane Database Syst Rev. 2005:2. doi: 10.1002/14651858.CD004095.pub2. [DOI] [PMC free article] [PubMed] [Google Scholar]
- 32.Tate DF, Jackvony EH, Wing RR. Effects of internet behavioral counseling on weight loss in adults at risk for type 2 diabetes. JAMA. 2003;289:1833–1836. doi: 10.1001/jama.289.14.1833. [DOI] [PubMed] [Google Scholar]
- 33. [November 18 2013];Obesity and Weight Loss Coverage [article online] 2013 Available from http://www.medicare.com/services-and-procedures/weight-loss/obesity-and-weight-loss-coverage.html.
- 34.American Diabetes Association Standards of medical care in diabetes—2013. Diabetes Care. 2013;36:S11–S66. doi: 10.2337/dc13-S011. [DOI] [PMC free article] [PubMed] [Google Scholar]
- 35.Franz MJ, Bantle JP, Beebe CA, Brunzell JD, Chiasson J-L, Garg A, Holzmeister LA, Hoogwerf B, Mayer-Davis E, Mooradian AD. Evidence-based nutrition principles and recommendations for the treatment and prevention of diabetes and related complications. Diabetes Care. 2002;25:148–198. doi: 10.2337/diacare.25.1.148. [DOI] [PubMed] [Google Scholar]
- 36.Carter N, O'Driscoll M. Life begins at forty!: Should the route to promoting exercise in elderly people also start in their forties? Physiotherapy. 2000;86:85–93. [Google Scholar]
- 37.Patel D, Lambert EV, da Silva R, Greyling M, Kolbe-Alexander T, Noach A, Conradie J, Nossel C, Borresen J, Gaziano T. Participation in fitness-related activities of an incentive-based health promotion program and hospital costs: A retrospective longitudinal study. Am J Health Promot. 2011;25:341–348. doi: 10.4278/ajhp.100603-QUAN-172. [DOI] [PubMed] [Google Scholar]
- 38.Rowland ML. Self-reported weight and height. AM J Clin Nutr. 1990;52:1125–1133. doi: 10.1093/ajcn/52.6.1125. [DOI] [PubMed] [Google Scholar]
- 39.Palta M, Prineas RJ, Berman R, Hannan P. Comparison of self-reported and measured height and weight. Am J Epidemiol. 1982;115:223–230. doi: 10.1093/oxfordjournals.aje.a113294. [DOI] [PubMed] [Google Scholar]