

Abstract
Different regions in the resting brain exhibit non-stationary functional connectivity (FC) over time. In this paper, a simple and efficient framework of clustering the variability in FC of a rat’s brain at rest is proposed. This clustering process reveals areas that are always connected with a chosen region, called seed voxel, along with the areas exhibiting variability in the FC. This addresses an issue common to most dynamic FC analysis techniques, which is the assumption that the spatial extent of a given network remains constant over time. We increase the voxel size and reduce the spatial resolution to analyze variable FC of the whole resting brain. We hypothesize that the adjacent voxels in resting state functional magnetic resonance imaging (rsfMRI), just as in task-based fMRI, exhibit similar intensities, so they can be averaged to obtain larger voxels without any significant loss of information. Sliding window correlation is used to compute variable patterns of the rat’s whole brain FC with the seed voxel in the sensorimotor cortex. These patterns are grouped based on their spatial similarities using binary transformed feature vectors in k-means clustering, not only revealing the variable and non-variable portions of FC in the resting brain but also detecting the extent of the variability of these patterns.
Keywords: Functional MRI, Resting State Functional MRI, Functional Connectivity, Sliding Window Correlation, k-means, Clustering, Dunn’s Index
I. INTRODUCTION
Recent studies have revealed that functional networks [1, 2] can be identified in spontaneous brain activities [3] of humans and animals. Understanding functional connectivity (FC) variations in the human brain can therefore assist in the identification of brain disorders [4, 5]. This study is motivated by the need to comprehend the variability of FC as a function of time, known as dynamic FC. As recent research indicates this variability may be a biomarker for normal variations in performance and alterations resulting from neuropsychiatric disorders [6, 7].
Functional magnetic resonance imaging (fMRI) is a noninvasive technique for measuring brain activities by detecting the blood oxygenation level-dependent (BOLD) signal, which occurs in response to neural activities. So the fMRI is often used to compute the activity maps of the brain regions while performing a specific task. Resting state functional MRI (rsfMRI) is performed when the subject is awake but not performing an explicit task. For a long time, it was believed that FC was stationary over the whole scan time (usually in minutes) of rsfMRI. Recent studies, however, have shown that areas in the resting brain are functionally connected and numerous studies [8] have demonstrated the dynamic nature of FC in humans [9, 10] and animals [11–13]. FC changes have been detected over a few seconds, which is more comparable to the duration of cognitive processes. At least a part of this variability is due to changes in neural activities [14–18].
The study of the rsfMRI of network dynamics is still in its infancy, and many of its aspects remain unexplored. In this paper, we investigate one such aspect by observing changes in the FC network configurations over time, which is a challenging task since variations in FC networks are not consistent across subjects because of anatomical variations among different brains. Furthermore, networks of the resting brain are not driven by any stimulus; hence, the series of changes do not follow any specific patterns, unlike task-based fMRI. Identifying some common FC patterns is thus quite challenging. Earlier work by our group focused on FC variations of a seed voxel, in the somatosensory cortex with some specific areas of the resting brain [11]. To our knowledge the current work is the first to explore, cluster, and analyze the seed voxel based whole brain FC. We perform sliding window correlation (SWC) [19] of a seed voxel with the rest of the brain in order to observe the dynamics of FC. Image processing and pattern recognition techniques are utilized here to characterize FC variations. We use k-means clustering [20] with Euclidean distance to cluster the patterns. Clustering validation is performed using Dunn’s index [21].
II. MATERIALS AND METHODS
A. Animal Preparation
In this study, we re-analyzed data acquired for another experiment in which rats were used as test subjects. A detailed description of data acquisition is available in [22]. In the sequence of these experiments, 2% isoflurane [23] is mixed with 1:1 oxygen and room air. Each rat was initially anesthetized with this mixture. The heart rate and the blood oxygen saturation percentage were recorded with a pulse oximeter placed on the rear left paw.
A rectal thermometer, along with an adjustable warm water pad, was used to monitor the body temperature at approximately 37° C (±0.5° C). The respiratory rate was also monitored by using a pressure-sensitive pad placed under the rat’s chest. The rat was then placed in the MRI cradle, and the head was secured with a bite bar and ear bars.
After the setup was completed, each rat was given a subcutaneous bolus injection of 0.025 mg/kg dexmedetomidine (Dexdomitor, Pfizer, Karlsruhe, Germany). Five minutes after the bolus, isoflurane was discontinued, and 15 minutes later, a subcutaneous infusion of 0.05 mg/kg/hr dexmedetomidine (a sedative medication which is similar to natural sleep in its effect on brain activity) was initiated to maintain anesthesia for the duration of the experiment [24]. Approximately 80 minutes after the initial dexmedetomidine bolus, the infusion dosage was increased to 0.15 mg/kg/hr (3x initial infusion rate) for maintaining anesthetic depth, in accordance with the protocol established in [25]. While the use of anesthesia certainly affects neural activity, it is a standard practice for functional imaging studies in animals [25, 26] to mitigate the stress the animals would otherwise experience from being restrained. The validity of this approach is supported by studies in humans that have shown that functional networks are relatively conserved across wakefulness, sleep, and anesthesia [27].
B. Image Acquisition and Preprocessing
All images were acquired on a 20 cm bore 9.4 T Bruker BioSpec magnet interfaced to an AVANCE (Bruker, Billerica, MA) console. An actively decoupled imaging protocol was used, with a 7 cm volume coil for RF transmission and a 2 cm surface coil for signal reception. A FLASH image [28] was acquired in three planes and a single slice was positioned over the primary somatosensory cortex based on known anatomical markers. Manual shimming was conducted on this slice to obtain maximum SNR and spatial homogeneity.
Each resting state scan was acquired using a single-shot gradient echo EPI sequence [29] with the following parameters: Repetitions = 1000, TR = 500 ms, TE = 15 ms, total scan time = 8 min 20 s, slice thickness = 2 mm, FOV = 2.56 cm × 2.56 cm, matrix size = 64 × 64. Approximately 10 resting state scans were acquired from a total of 7 animals for the original study. For the analysis performed in this work, we used the same 3 resting state scans each from the same 4 rats examined in [11]. For the period when the scans were acquired for this analysis, the average heart rate was 300–310 bpm, respiratory rate was 70–80 breaths/min, oxygenation was 98–99%, and body temperature was 37–37.5°C.
All fMRI data processing and analysis were performed using code written in MATLAB (MathWorks, Natick, MA). The time trajectory from each voxel was linearly detrended, followed by finite impulse response bandpass filtering between 0.01 Hz and 0.3 Hz based on previous work demonstrating correlation over a wide range of frequencies in the anesthetized rats [9, 30]. Data points were removed from the beginning of each scan to reduce any transient effects of scanner instability, and again after filtering to reduce filter effects, leaving a total of 800 images for each scan. Three such scans of each rat was taken and concatenated after motion compensation.
C. Voxels’ time series
Scans from four rats were used to compute the FC of the seed voxel in the sensorimotor cortex. Each scan consisted of 2,400 scanned images (1,200 sec, sampling rate = 2 scans/sec). In earlier studies, a voxel is represented by one pixel, and the FC of the seed voxel with only a few other voxels were computed because of an extensive computational complexity. We reduce the computation by representing 3×3 pixel blocks as one voxel in each 2D scanned image, shown as squares in Fig. 1, with their mean assigned as the intensity level of the new voxel. Results of a similar analysis with 2×2 pixel blocks show almost the same functionally connected areas, but at a cost of almost doubling the computation. Voxels are numbered from left to right and from top to bottom, and the time series of a voxel is defined as the intensity sequence of that voxel for the whole scan time. The number of time series is equal to number of voxels in a brain image. Whole brain variable FC of seed voxel in the left primary somatosensory cortex (LS1) is computed. Seed voxel’s location is identified by visual comparison with the Paxinos rat brain atlas [31].
Fig. 1.
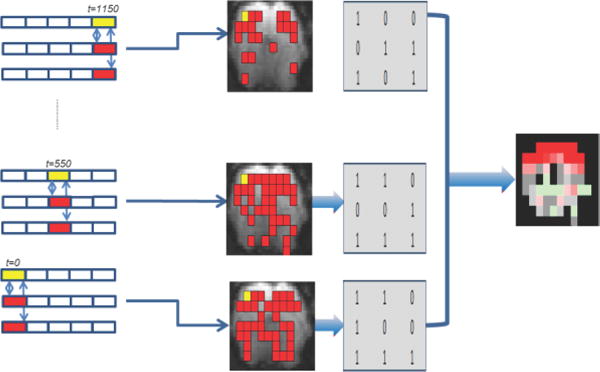
Block diagram (Left to right: Sliding window correlation, Functional connectivity maps, Binary transformed matrices of FC, One cluster)
D. Dynamic Functional Connectivity
Correlation analysis is a widely used method to compute similarity between two time series. SWC (sliding window correlation) [19] computes correlations of windowed time series. In this study SWC is used to capture the dynamics of variable FC. SWC was performed using a window with a size of 100 images (50 sec) and an offset of one image (0.5 sec). There are no standards for the chosen window size and offset. As such, the window size and offset here were taken to be comparable to those used in previous studies [11, 16].
A voxel is functionally connected with the seed voxel if 0.2 ≤ |SWC| ≤ 0.99999 (sample size = 100, p<0.03, where p is the p-value calculated for the lowest given level of correlation and sample size). Fig. 1 shows a block diagram of the whole process. The SWC of the seed voxel’s time series (yellow rectangles) and other voxels’ time series (red rectangles) is computed. Patterns of dynamic FC at intervals of 100 scans (50 s) are plotted, and stored in a matrix form.
E. Feature vectors and k-means clustering
In order to reduce the clustering computation, we exploited the fact that all voxels are either functionally connected with the seed voxel or not. Functional connectivity matrices are binary transformed by replacing correlations of the functionally connected voxels by a value ‘1’ and other correlations by ‘0’. Each binary transformed matrix is converted to a row vector to be used as a feature vector for k-means clustering. For better visualization of variations in FC, clusters are displayed as images with varying colors. The clustering of these patterns allows us to identify repeated patterns in the dynamic FC. Examples of binary transformed matrices are shown in Fig. 1.
k-means clustering is an unsupervised clustering technique that automatically partitions an n-point data set into k clusters, where k < n [32]. It proceeds by selecting k initial cluster centers and then iteratively changing each cluster’s members and centers, till the clusters are stable. It minimizes the within-cluster sum of squares [33] by formula in (1).
| (1) |
where S = { S1, S2, … Sk} is the cluster space of member clusters, μi is the mean of the feature vector in each member Si and x = { x1, x2, …. xn} are feature vectors of functional connectivity to be clustered.
F. Dunn’s index
Cluster validation is done using Dunn’s index [21], since it aims at the identification of “compact and well separated clusters” [33]. Dunn’s index, DIm, for m clusters is given in (2).
| (2) |
where δ(Ci, Cj) is the inter-cluster Euclidean distance between clusters Ci and Cj., Δk = max d(x,y), and d(x,y) is the Euclidean distance between the points x and y in cluster Ci.
III. RESULTS AND DISCUSSION
Results of dynamic network analysis of all four rats showed similar variability in the FC, and a detailed result of one of them is shown in Fig. 2. From Fig. 2, we observe the clustering of the FC patterns of LS1 [11] with the whole brain. In order to examine the degree of variability in the FC patterns, we divide them into groups with different numbers of clusters. Rows in Fig. 2 illustrate clustering when the number of clusters was reduced from six to three. The extent of the color variation depicts the variability of the FC patterns in a cluster. The dark red part in a cluster represents the regions found in all patterns included in that cluster denoting the areas of the brain that are always functionally connected with the chosen seed voxel. Changes of color to lighter shades of red, gray, and then to green indicate a decrease in the number of times an area is functionally connected with the seed voxel, thus representing the variations in FC.
Fig. 2.
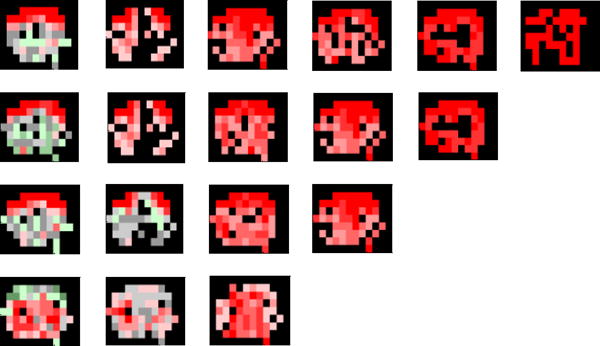
Clustered patterens of left primary somtasensory cortex (LS1) functional connectivity with whole brain. Row one: six clusters, Row two: five clusters, Row three: four clusters, Row four: three clusters
Certain significant observations can be made from Fig. 2, about the FC of LS1. Irrespective of the number of clusters the patterns are divided into, there are certain areas in the brain which are always functionally connected with the seed voxel (deep dark red parts in all clusters), while other areas show variation in FC. The persistent portions often consist of symmetrical areas in the left and right hemispheres and is in good agreement with previous studies [11], The variable portions occur less often and show that connectivity sometimes extend to deeper medial areas outside the cortex. It is also observed that color variations are dominant in 2 clusters, which indicates that most of the patterns are in these clusters, and the extent of the FC variation is not large. Another notable point in Fig. 2 is the fact that changing the number of clusters does not affect the larger clusters, until the number of clusters is reduced by a half (from six to three).
Fig. 3 presents the bar graph of FC patterns distribution for the clusters shown in Fig. 2, averaged over all the 4 rats. For averaging, FC patterns of all rats are divided into a chosen number of clusters, with the most common cluster in each rat given the lowest number. The number of occurrences in the most common cluster is then averaged across rats. The process is repeated for each of the remaining clusters. It can be observed from Fig. 3, that a large number of patterns lies within a few clusters (clusters 1 and 2) and changing the number of clusters does not significantly affect the membership of these clusters. Furthermore, decreasing the number of clusters resulted in merging of clusters containing a smaller number of patterns (six vs. three clusters), illustrating that these patterns are closer to each other than the patterns in bigger clusters. This observation may possibly indicate that at certain times, the variations in brain networks repeat partially, and that these repetitions occur frequently.
Fig. 3.
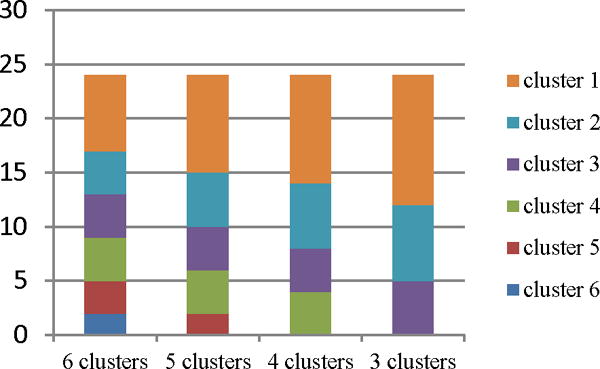
Functional connectivity (FC) patterns districution, averaged over all rats, for varying number of clusters
IV. CONCLUSION
This study identifies the need to understand the changes occurring in FC networks of a rat’s resting brain. Varying similarities between different regions in a brain are captured by using SWC with the SWC matrices binary transformed, and converted to images to get a better visual understanding of FC. These FC patterns are clustered together using k-means. We conclude that while FC in the resting brain in the rat is a constantly changing phenomenon, the majority of the FC patterns are similar to those of the steady-state connectivity obtained from minute-long scans. The variable portion of the patterns accounts for far less of the scan. Future work, applying this technique to the more complex human brain, should exhibit a richer repertoire of states than what are observed here in the sedated rodents.
Contributor Information
Sadia Shakil, Georgia Institute of Technology, School of Electrical and Computer Engineering, Atlanta, 30308, GA, USA.
Matthew E. Magnuson, Email: magnuson1@gmail.com, Georgia Institute of Technology and Emory University, Biomedical Engineering, Atlanta, 30332, GA, USA.
Shella D. Keilholz, Email: shella.keilholz@bme.gatech.edu, Georgia Institute of Technology and Emory University, Biomedical Engineering, Atlanta, 30332, GA, USA.
Chin-Hui Lee, Email: chinhui.lee@ece.gatech.edu, Georgia Institute of Technology, School of Electrical and Computer Engineering, Atlanta, 30308, GA,USA.
References
- 1.Biswal B, Yetkin FZ, Haughton VM, Hyde JS. Functional connectivity in the motor cortex of resting human brain using echo-planar MRI. Magn Reson Med. 1995;34:537–541. doi: 10.1002/mrm.1910340409. [DOI] [PubMed] [Google Scholar]
- 2.Smith SM, Miller KL, Moeller S, Xu J, Auerbach EJ, Woolrich MW, et al. Temporally-independent functional modes of spontaneous brain activity. Proc Natl Acad Sci U S A. 2012;109:3131–3136. doi: 10.1073/pnas.1121329109. [DOI] [PMC free article] [PubMed] [Google Scholar]
- 3.Fox MD, Raichle ME. Spontaneous fluctuations in brain activity observed with functional magnetic resonance imaging. Nature Reviews Neuroscience. 2007;8:700–711. doi: 10.1038/nrn2201. [DOI] [PubMed] [Google Scholar]
- 4.Lynall M-E, Bassett DS, Kerwin R, McKenna PJ, Kitzbichler M, Muller U, et al. Functional Connectivity and Brain Networks in Schizophrenia. The Journal of Neuroscience. 2010;30:9477–9487. doi: 10.1523/JNEUROSCI.0333-10.2010. [DOI] [PMC free article] [PubMed] [Google Scholar]
- 5.Koçak OM, Kale E, Çiçek M. Default Mode Network Connectivity Differences in Obsessive-Compulsive Disorder. Activitas Nervosa Superior. 2012;54:3–4. [Google Scholar]
- 6.Garrity AG, Pearlson GD, McKiernan K, Lloyd D, Kiehl KA, Calhoun VD. Aberrant “default mode” functional connectivity in schizophrenia. Am J Psychiatry vol. 2007;164:450–457. doi: 10.1176/ajp.2007.164.3.450. [DOI] [PubMed] [Google Scholar]
- 7.Thompson PM, Hayashi Kiralee M, Sowell Elizabeth R, Gogtay Nitin, Giedd Jay N, Rapoport Judith L, et al. Mapping cortical change in Alzheimer’s disease, brain development, and schizophrenia. NeuroImage. 2004;23:S2–S18. doi: 10.1016/j.neuroimage.2004.07.071. [DOI] [PubMed] [Google Scholar]
- 8.Smith SM, Fox PT, Miller KL, Glahn DC, Fox PM, Mackay CE, et al. Correspondence of the brain’s functional architecture during activation and rest. Proc Natl Acad Sci U S A. 2009;106 doi: 10.1073/pnas.0905267106. [DOI] [PMC free article] [PubMed] [Google Scholar]
- 9.Majeed W, Magnuson M, Hasenkamp W, Schwarb H, Schumacher EH, Barsalou L, et al. Spatiotemporal dynamics of low frequency BOLD fluctuations in rats and humans. Neuroimage. 2011;54:1140–50. doi: 10.1016/j.neuroimage.2010.08.030. [DOI] [PMC free article] [PubMed] [Google Scholar]
- 10.Chang C, Glover GH. Time-frequency dynamics of resting-state brain connectivity measured with fMRI. Neuroimage. 2010;50:81–98. doi: 10.1016/j.neuroimage.2009.12.011. [DOI] [PMC free article] [PubMed] [Google Scholar]
- 11.Keilholz SD, Magnuson ME, Pan W-J, Willis M, Thompson GJ. Dynamic Properties of Functional Connectivity in the Rodent. Brain Connectivity. 2013;3:31–40. doi: 10.1089/brain.2012.0115. [DOI] [PMC free article] [PubMed] [Google Scholar]
- 12.Majeed W, Magnuson M, Keilholz SD. Spatiotemporal dynamics of low frequency fluctuations in BOLD fMRI of the rat. J Magn Reson Imaging. 2009;30:384–393. doi: 10.1002/jmri.21848. [DOI] [PMC free article] [PubMed] [Google Scholar]
- 13.Hutchison RM, Womelsdorf T, Gati JS, Everling S, Menon RS. Resting-State Networks Show Dynamic Functional Connectivity in Awake Humans and Anesthetized Macaques. Hum Brain Mapp. 2013;34:2154–2177. doi: 10.1002/hbm.22058. [DOI] [PMC free article] [PubMed] [Google Scholar]
- 14.Pan W-J, Thompson GJ, Magnuson ME, Jaeger D, Keilholz S. Infraslow LFP correlates to resting-state fMRI BOLD signals. NeuroImage. 2013;74:288–297. doi: 10.1016/j.neuroimage.2013.02.035. [DOI] [PMC free article] [PubMed] [Google Scholar]
- 15.Thompson GJ, Magnuson ME, Merritt MD, Schwarb H, Pan W-J, McKinley A, et al. Short time windows of correlation between large scale functional brain networks predict vigilance intra-individually and inter-individually. Hum Brain Mapp. 2013;34:3280–3298. doi: 10.1002/hbm.22140. [DOI] [PMC free article] [PubMed] [Google Scholar]
- 16.Thompson GJ, Merritt MD, Pan W-J, Magnuson ME, Grooms JK, Jaeger D, et al. Neural correlates of time-varying functional connectivity in the rat. NeuroImage. 2013;83:826–836. doi: 10.1016/j.neuroimage.2013.07.036. [DOI] [PMC free article] [PubMed] [Google Scholar]
- 17.Chang C, Liu Z, Chen MC, Liu X, Duyn JH. EEG correlates of time-varying BOLD functional connectivity. Neuroimage. 2013;72:227–236. doi: 10.1016/j.neuroimage.2013.01.049. [DOI] [PMC free article] [PubMed] [Google Scholar]
- 18.Thompson GJ, Pan Wen-Ju, Magnuson Matthew Evan, Jaeger Dieter, Keilholz SD. Quasi-periodic patterns (QPP): large-scale dynamics in resting state fMRI that correlate with local infraslow electrical activity. Neuroimage. 2014 doi: 10.1016/j.neuroimage.2013.09.029. [DOI] [PMC free article] [PubMed] [Google Scholar]
- 19.Schulz D, Huston JP. The sliding window correlation procedure for detecting hidden correlations: existence of behavioral subgroups illustrated with aged rats. Journal of Neuroscience Methods. 2002;121:129–137. doi: 10.1016/s0165-0270(02)00224-8. [DOI] [PubMed] [Google Scholar]
- 20.MacQueen J. Some methods for classification and analysis of multivariate observations; Proceedings of the Fifth Berkeley Symposium on Mathematical Statistics and Probability; Berkeley, Calif: University of California Press; 1967. pp. 281–297. [Google Scholar]
- 21.Halkidi M, Batistakis Y, Vanzigiannis M. On Clustering Validation Techniques. Journal of Intelligent Information Systems. 2001;17:107–145. [Google Scholar]
- 22.Magnuson Matthew Evan, Thompson Garth John, Pan Wen-Ju, Keilholz SD. Time-dependent effects of isoflurane and dexmedetomidine on functional connectivity, spectral characteristics, and spatial distribution of spontaneous BOLD fluctuations. NMR in Biomedicine. 2014;27:291–303. doi: 10.1002/nbm.3062. [DOI] [PMC free article] [PubMed] [Google Scholar]
- 23.Masamoto K, Kim T, Fukuda M, Wang P, Kim SG. Relationship between neural, vascular, and BOLD signals in isoflurane-anesthetized rat somatosensory cortex. Cereb Cortex. 2007 Apr;17:942–50. doi: 10.1093/cercor/bhl005. [DOI] [PubMed] [Google Scholar]
- 24.Weber R, Ramos-Cabrer P, Wiedermann D, Camp Nvan, Hoehn M. A fully noninvasive and robust experimental protocol for longitudinal fMRI studies in the rat. Neuroimage. 2006 Feb 15;29:1303–10. doi: 10.1016/j.neuroimage.2005.08.028. [DOI] [PubMed] [Google Scholar]
- 25.Pawela CP, Biswal BB, Hudetz AG, Schulte ML, Li R, Jones SR, et al. A protocol for use of medetomidine anesthesia in rats for extended studies using task-induced BOLD contrast and resting-state functional connectivity. Neuroimage. 2009;46:1137–1147. doi: 10.1016/j.neuroimage.2009.03.004. [DOI] [PMC free article] [PubMed] [Google Scholar]
- 26.Williams KAM, Majeed M, LaConte W, Peltier SM, Hu SJ, Keilholz X, SD Comparison of alpha-chloralose, medetomidine and isoflurane anesthesia for functional connectivity mapping in the rat. Magn Reson Imaging. 2010;28:995–1003. doi: 10.1016/j.mri.2010.03.007. [DOI] [PMC free article] [PubMed] [Google Scholar]
- 27.Boly M, Phillips C, Tshibanda L, Vanhaudenhuyse A, Schabus M, Dang-Vu TT, et al. Intrinsic Brain Activity in Altered States of Consciousness. Annals of the New York Academy of Sciences. 2008;1129:119–129. doi: 10.1196/annals.1417.015. [DOI] [PMC free article] [PubMed] [Google Scholar]
- 28.Frahm J, Haase A, M D. Rapid three-dimensional MR imaging using the FLASH technique. J Comput Assist Tomogr. 1986;10:363–368. doi: 10.1097/00004728-198603000-00046. [DOI] [PubMed] [Google Scholar]
- 29.P M, DN G, RJ O, RE C. Measurement of T1 by echo-planar imaging and the construction of computer-generated images. Phys Med Biol. 1986;31:113–124. doi: 10.1088/0031-9155/31/2/001. [DOI] [PubMed] [Google Scholar]
- 30.Magnuson M, Majeed W, Keilholz SD. Functional connectivity in BOLD and CBV weighted resting state fMRI in the rat brain. J Magn Reson Imag. 2010;32:584–592. doi: 10.1002/jmri.22295. [DOI] [PMC free article] [PubMed] [Google Scholar]
- 31.Paxinos G, Watson C. The Rat Brain in Stereotaxic Coordinates. San Diego: Academic Press; 1996. [Google Scholar]
- 32.Cardie KWC. Constrained K-means Clustering with Background Knowledge; Proceedings of the Eighteenth International Conference on Machine Learning; 2001. pp. 577–584. [Google Scholar]
- 33.Halkidi M, Batistakis Y, Vazirgiannis M. Clustering validity checking methods: part II. ACM SIGMOD Record. 2002;31(3):19–27. [Google Scholar]