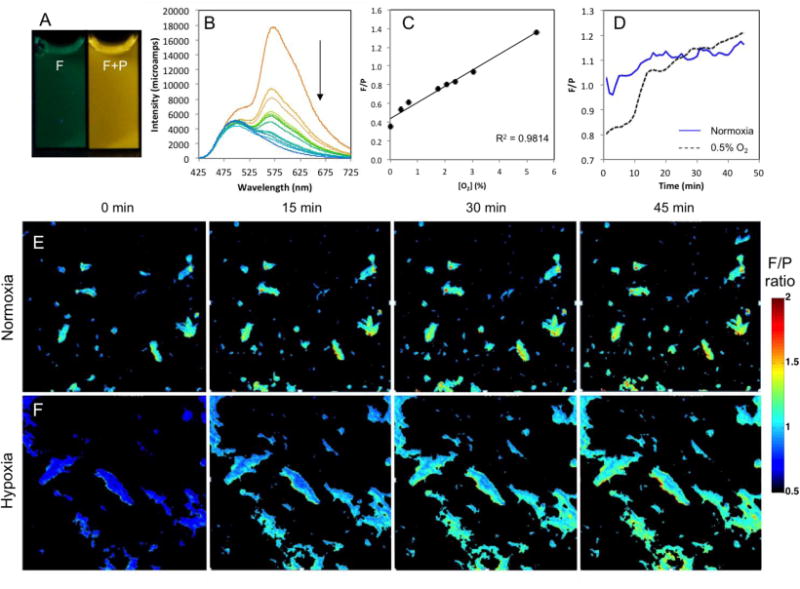
Figure 7.

Boron nanoparticle oxygen sensing. (A) Images of BNPs made from BF2dnm(I)PLA 9b (NPI) in air (fluorescence) and N2 (fluorescence + phosphorescence) (λex = 354 nm). (B) Total emission spectra of NPI at O2 levels 0–21%. Arrow indicates decreasing phosphorescence at 570 nm with increasing O2. (C) Fluorescence intensity (505 nm) over phosphorescence intensity (565 nm) (F/P) calibration plot showing a linear fit in the 0 – 5.3% O2 range. (D) QuadView microscope quantification of F/P intensity ratio monitored for 45 min. (E) QuadView microscope images of NPI within 4T1 cells under normoxia (air; ambient). (F) QuadView microscope images of the hypoxia (0.5% O2) to normoxia transition.
