Abstract
The Enzyme Function Initiative, an NIH/NIGMS-supported Large-Scale Collaborative Project (EFI; U54GM093342; http://enzymefunction.org/), is focused on devising and disseminating bioinformatics and computational tools as well as experimental strategies for the prediction and assignment of functions (in vitro activities and in vivo physiological/metabolic roles) to uncharacterized enzymes discovered in genome projects. Protein sequence similarity networks (SSNs) are visually powerful tools for analyzing sequence relationships in protein families (H.J. Atkinson, J.H. Morris, T.E. Ferrin, and P.C. Babbitt, PLoS One 2009, 4, e4345). However, the members of the biological/biomedical community have not had access to the capability to generate SSNs for their “favorite” protein families. In this article we announce the EFI-EST (Enzyme Function Initiative-Enzyme Similarity Tool) web tool (http://efi.igb.illinois.edu/efi-est/) that is available without cost for the automated generation of SSNs by the community. The tool can create SSNs for the “closest neighbors” of a user-supplied protein sequence from the UniProt database (Option A) or of members of any user-supplied Pfam and/or InterPro family (Option B). We provide an introduction to SSNs, a description of EFI-EST, and a demonstration of the use of EFI-EST to explore sequence-function space in the OMP decarboxylase superfamily (PF00215). This article is designed as a tutorial that will allow members of the community to use the EFI-EST web tool for exploring sequence/function space in protein families.
1. Introduction: The Functional Assignment Challenge
The identities and functions of the complete set of proteins encoded by a genome should allow a comprehensive understanding of the physiology of the organism. However, a conservative estimate is that only ~50% of the proteins discovered in genome projects have reliable functional annotations in the sequence databases—the remainder have unknown, uncertain, or incorrect functional annotations (and the identities of these are unknown!) [1, 2]. Genome projects should provide information of extraordinary value for the biomedical, pharmaceutical, and commercial communities; however, with the large fraction of sequences having unknown, uncertain, or incorrect functions, their inherent potential has yet to be realized.
The magnitude of this problem is accentuated by the rapidly increasing sizes of the protein databases (Figure 1). The “doubling time” of the UniProt database (http://www.uniprot.org/) [3], a widely accessed collection of protein sequences and functional annotation information, is ~18 months. A total of 87,083,183 sequences was available in UniProt Release 2014_10 (October 29, 2014); these sequences were distributed between the SwissProt (manually annotated; 546,790 sequences) and TrEMBL (automatically annotated; 86,536,393 sequences) databases. Although SwissProt is not a comprehensive database of sequences for which functions have been experimentally confirmed—it is both inefficient and prohibitively expensive to mine the literature for functional information—the functions curated by SwissProt can be extended by sequence homology to a much larger number of sequences, although the exact sequence boundaries between functions within protein families are not well-defined.
Figure 1.
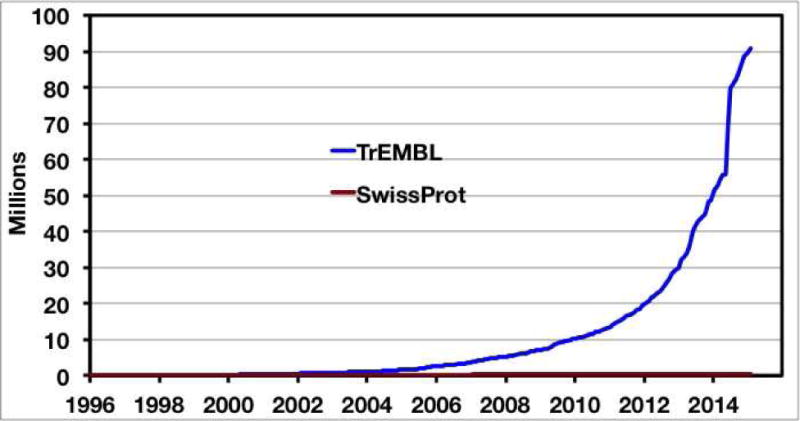
The growth of the UniProt/SwissProt and UniProt/TrEMBL databases.
Devising a robust solution to the problem of assigning functions (both in vitro activities and in vivo metabolic functions) to uncharacterized (“unknown”) enzymes discovered in genome projects is not trivial. In the case of eubacterial and archaeal enzymes, genome context often can provide clues about function, e.g., metabolic pathways frequently are encoded by operons and gene clusters [4]. Also, for enzymes with known three-dimensional structures, virtual docking of metabolite libraries to active sites may provide additional information about the identity of the physiological substrate [5, 6]. And, for structurally defined enzymes that participate in the metabolic pathway, the integration of the results of docking to multiple enzymes in a hypothetical pathway may allow more confident prediction of the metabolites and reactions [7, 8]. These strategies for functional assignment, in development by the Enzyme Function Initiative (EFI; NIH U54GM093342; http://enzymefunction.org/) [9], have been successful in discovering new enzymatic reactions and metabolites in novel metabolic pathways.
The EFI’s strategy for elucidating the functions of uncharacterized enzymes typically begins with analyses of sequence-function space in homologous families, with the assumption that members of families share elements of substrate specificity and/or chemical mechanism. In this way, restrictions often can be placed on the functions (both substrates and reactions) of uncharacterized members of a family in the absence of experimental data, thereby allowing focused predictions to be used to guide experimental testing. The Pfam database defines 14,831 homologous sequence-based families (http://pfam.xfam.org/) [10]; approximately 80% of the sequences in the UniProt database are assigned to at least one Pfam family. A protein’s Pfam family membership can be identified using InterProScan that that searches different protein signature sequence motifs in the InterPro database (http://www.ebi.ac.uk/Tools/pfa/iprscan5/).
An integral component of the EFI’s strategy, the subject of this article, is segregation of protein families into isofunctional groups (same substrate and reaction)—the goal is to place uncharacterized enzymes in sequence-function context with those for which reliable experiment-based functions are available. If an uncharacterized protein shares a high level of sequence identity (often, but not always, >70%; [11]) with an enzyme with known function as established from the literature, SwissProt curation, and/or genome neighborhood context, the function of the known enzyme often can be tentatively transferred to the uncharacterized enzyme, although its function should be confirmed experimentally. If the uncharacterized protein shares a lower level of sequence identity with enzymes of known function, the functions of the “genomic neighbors” may provide clues about the identity of the reaction catalyzed by the uncharacterized enzyme. The integration of protein family and genome neighborhood analyses can be expected to allow predictions about the possible functions of uncharacterized enzymes in novel metabolic pathways.
This article provides 1) an introduction to protein sequence similarity networks (SSNs), a user-friendly, visually-tractable alternative to trees/dendrograms for segregating entire protein families into isofunctional groups, 2) a description of the Enzyme Function Initiative-Enzyme Similarity Tool web tool (EFI-EST; http://efi.igb.illinois.edu/efi-est/index.php) for generating SSNs in a predominately automated manner, and 3) a tutorial on the use of EFI-EST to analyze sequence-function space in a functionally diverse enzyme superfamily. With this context, members of the community should be able to use EFI-EST to explore sequence/function space in their “favorite” enzyme families.
2. Sequence Similarity Networks (SSNs)
Dendrograms and trees (Figure 2A) are the most common tools for surveying sequence-function space in enzyme families. However, their construction and interpretation is computationally intensive and requires an accurate sequence alignment that is difficult to achieve on large-scale. Babbitt and coworkers described the use of protein sequence similarity networks (SSNs) as an “easy to compute” alternate method for assessing sequence relationships within enzyme families [12]. In an SSN (Figure 2B), each member of a protein family is represented by a node (symbol) and is connected with an edge (line) to the nodes for all other members that share a sequence similarity greater than a user-specified value. Comparison of panels A and B demonstrates that SSNs can provide a visually more tractable overview of sequence-function relationships within protein families than dendrograms or trees.
Figure 2.
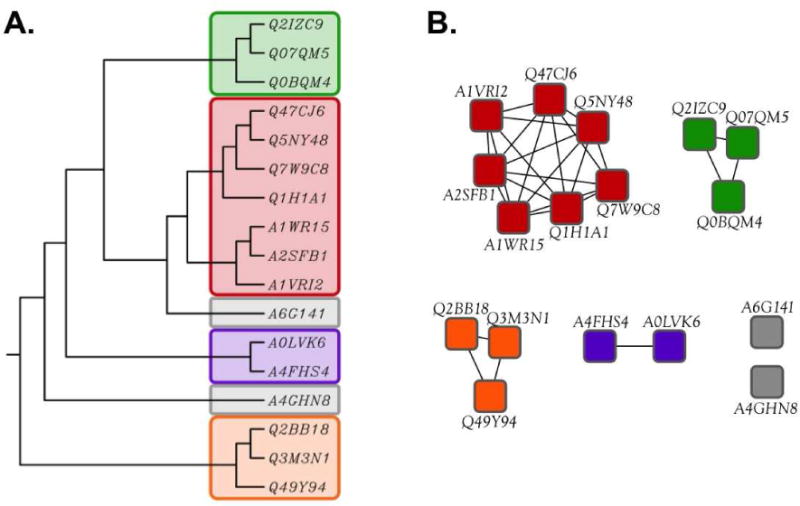
A comparison of trees and sequence similarity networks. Panel A, a rooted phylogenetic tree (UPGMA) created with ClustalW; panel B, the sequence similarity network using the same sequence set as shown in Panel A. Proteins are identified by their UniProt accession IDs.
Recent studies have demonstrated the utility of SSNs for generating hypotheses for experimental assignment of functions to uncharacterized enzymes (Table 1). For example, Babinger, Sterner and colleagues used SSNs to survey sequence/function space in the geranylgeranylglyceryl phosphate synthase family and identified previously unrecognized subfamilies that differ in substrate specificities from members that had been biochemically and structurally characterized [13]. Mitchell, Nair, and coworkers used SSNs to analyze sequence/function space in the YcaO superfamily of ATP-binding proteins involved in the synthesis of heterocyclic natural products [14]. van der Donk, Nair, and colleagues used SSNs to explore functional relationships among the glutaminylation domains of lantibiotic dehydratases [15]. And, very recently, the EFI used SSNs to direct experimental determination of the ligand specificities of the solute binding proteins for bacterial TRAP transport systems [16]. These examples extend the many earlier EFI publications on the use of SSNs to visualize sequence/function space in functionally diverse enzyme superfamilies and generate hypotheses to guide the computational and experimental discovery of novel in vitro enzymatic activities and in vivo metabolic functions of uncharacterized enzymes discovered in genome projects.
Table 1.
Publications Featuring SSNs in Sequence-Function Investigations
| Discovering Novel Chemistry within a Superfamily | Defining Substrate Specificity | Coupling SSNs with Structural Insight | Coupling SSNs with Genome Context |
|---|---|---|---|
| PMID 24684232 [13] | PMID 23214453 [33] | PMID 21222452 [34] | PMID 25540822 [16] |
| PMID 25608448 [20] | PMID 23256477 [35] | PMID 22069325 [36] | PMID 24056934 [8] |
| PMID 21823622 [37] | PMID 23327428 [38] | PMID 21948213 [39] | PMID 24980702 [4] |
| PMID 22069326 [40] | PMID 24802635 [41] | PMID 23493556 [42] | PMID 25129028 [14] |
| PMID 25299649 [44] | |||
| PMID 24074367 [43] | PMID 25363770 [15] | PMID 23959887 [45] | |
| PMID 24401123 [46] | PMID 23968233 [47] | ||
| PMID 24947666 [48] | |||
| PMID 24756107 [50] | |||
| PMID 25151136 [49] | |||
| PMID 24697546 [51] | |||
| PMID 24697329 [52] |
The Structure-Function Linkage Database (SFLD; http://sfld.rbvi.ucsf.edu/django/) [17], maintained by Babbitt’s group, provides manually curated SSNs for a small group of functionally diverse enzyme superfamilies. The SSNs (as XGMML files) can be downloaded by users and visualized using Cytoscape (http://www.cytoscape.org/), an open source software platform for visualizing complex networks. The SFLD’s SSNs provide annotation information in the form of “node attributes” for each sequence (node) in the SSN. Some node attributes are obtained from databases such as GenBank and UniProtKB (UniProt Knowledgebase); others come from the literature via manual curation. The SFLD provides access to highly curated SSNs for 12 functionally diverse enzyme superfamilies, including amidohydrolase, enolase, isoprenoid synthase, and radical SAM. The SFLD also provides a library of SSNs for 35 other specificity/functionally diverse superfamilies (Extended SFLD) for which fewer node attributes are available. Detailed curation requires considerable manual effort and expense, so it is not feasible for the SFLD to provide highly curated SSNs for all families.
The number of protein families is very large: the Pfam database (release 27.0) defines 14,831 sequence-based families and 515 clans (groups of homologous Pfam families, i.e., superfamilies). The InterPro database (release 49.0; http://www.ebi.ac.uk/interpro/) [18], an aggregate of eleven different protein family databases including Pfam, defines 7,518 domains, 18,218 families, 277 repeats, and 831 sites. [A domain is a functional, structural, or sequence unit; a family is a group of proteins that share a common evolutionary origin as suggested by related functions, sequences, and/or structure; a repeat is short sequence that is repeated within a protein; and a site is a short sequence that contains conserved residues, e.g., active sites and ligand binding sites.] The EFI believes that the diverse interests of the community would be well-served if SSNs for all protein families and superfamilies were easily accessible, so that members of the community could quickly place their “favorite” protein in the sequence-function context of its family and generate hypotheses for experimental determination of the in vitro activities and in vivo functions of uncharacterized enzymes.
Babbitt’s group developed Pythoscape, a “framework” for creating and processing SSNs for large protein families [19]. Use of Pythoscape requires use of a terminal command line, some basic knowledge of Python, and access to a computer cluster; however, many biologists do not have such programming prowess nor access to the required computational infrastructure.
Therefore, the EFI, together with the Computer Network Resource Group (CNRG) at the Institute for Genomic Biology (IGB) at the University of Illinois, Urbana-Champaign, developed user-friendly scripts for generating an SSN for any protein family defined by Pfam or InterPro. The process involves two steps: 1) collecting the sequences and executing an all-by-all BLAST to provide the sequence similarities (edges) for all pairs of sequences (nodes) in the protein family; and 2) filtering the node-edge pairs with a user-specified alignment score lower limit to generate the SSN as an XGMML file that can be imported into Cytoscape for subsequent visualization, manipulation, and analysis.
Biologists commonly use the BLAST Expect value (E-value) to infer pair-wise sequence similarity. Rigorously, the E-value is a database size-dependent measure of the number of alignments that can be expected by chance when a sequence is queried against a protein database; both the length of the query sequence and the size of the database determine its magnitude. As a result, the E-value cannot be correlated directly with pair-wise percent identity. However, a database-independent measure of sequence similarity is provided by the BLAST bit-score that is calculated in the pair-wise sequence comparison and used to determine the E-value; the magnitude of the bit-score is independent of the size of the database.
The scripts developed by the EFI for generating SSNs calculate a database-independent “alignment score” for each edge in an SSN using the bit-score obtained from BLAST v2.x (blastall), where the alignment score is the negative base-10 logarithm of [2-bitscore • (query length • subject length)]. In practice, the alignment score is similar in magnitude to the negative logarithm of the E-value, so users of the EFI’s SSNs can use alignment scores as a guide to the level of sequence similarity.
The scripts developed by the EFI provide the back-end for the EFI-EST web tool (http://efi.igb.illinois.edu/efi-est/; Figure 3) that is available without charge for use by the community. This article provides users with sufficient background to use EFI-EST to analyze sequence-function space in their “favorite” protein families; the reader also is referred to the EFI-EST tutorial (http://efi.igb.illinois.edu/efi-est/) for additional information. Those interested in technical details about the scripts should consult the EFI-EST Wiki (http://www-app2.igb.illinois.edu/wikis/efi/index.php/Sequence_Similarity_Networks). Source code for the scripts is freely available for download at https://github.com/EnzymeFunctionInitiative/EST and is supported on Linux.
Figure 3.
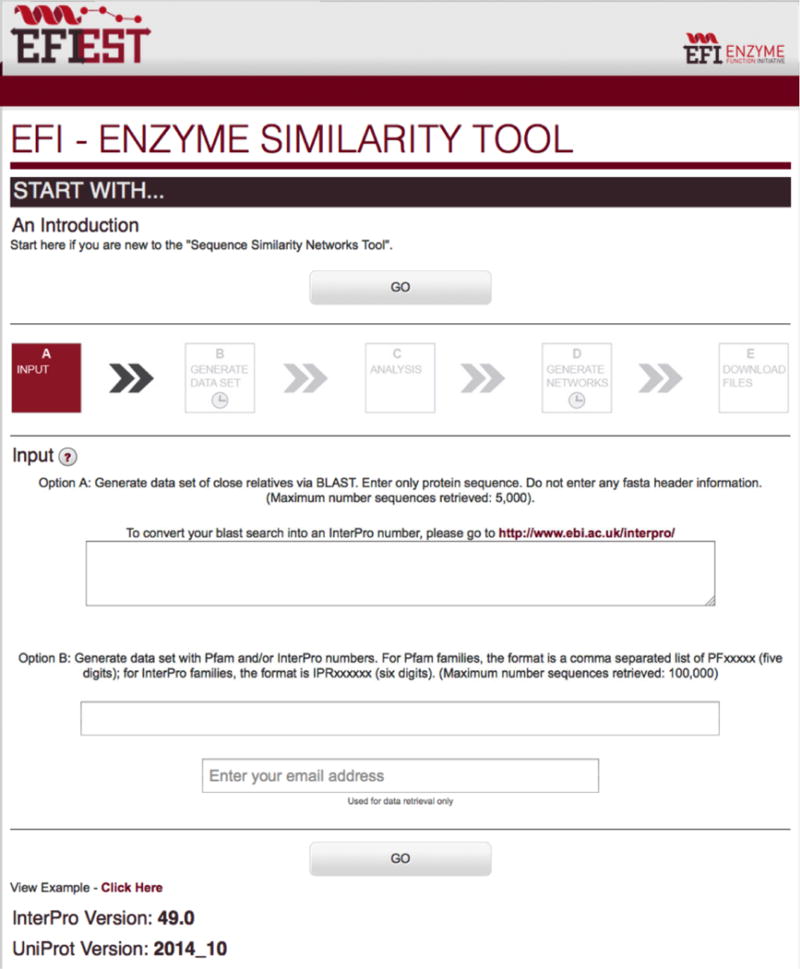
The “Start Page” page for EFI-EST (http://efi.igb.illinois.edu/efi-est/stepa.php).
3. The Value of SSNs and How To Use Them
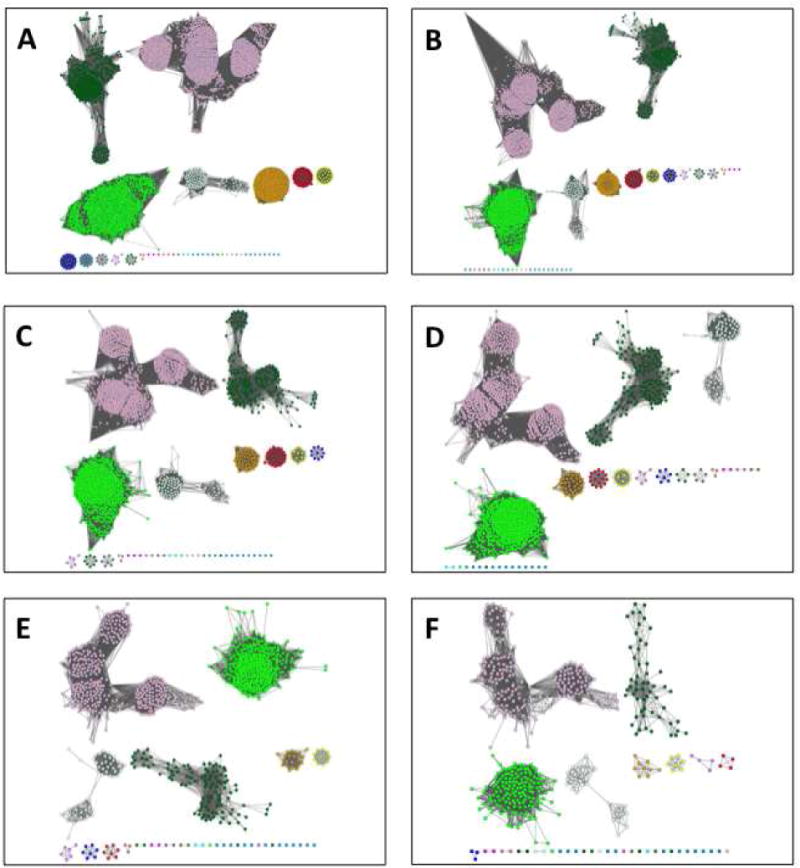
An SSN is a visual aid that allows a user to segregate a functionally diverse superfamily (different substrate specificities and/or reaction mechanisms) into putative isofunctional groups [12]. At small alignment scores (low sequence identity), most of the nodes in the SSN for a homologous family will be connected to one another by edges resulting in a single large cluster (“hairball”, Figure 4A). As the alignment score used to draw edges is increased (the sequence identity is increased), edges are removed and the hairball segregates into distinct clusters (Figure 4B–F). The removal of edges is continued until the user is satisfied that the alignment score lower limit for drawing edges has separated the family into isofunctional clusters.
Figure 4.
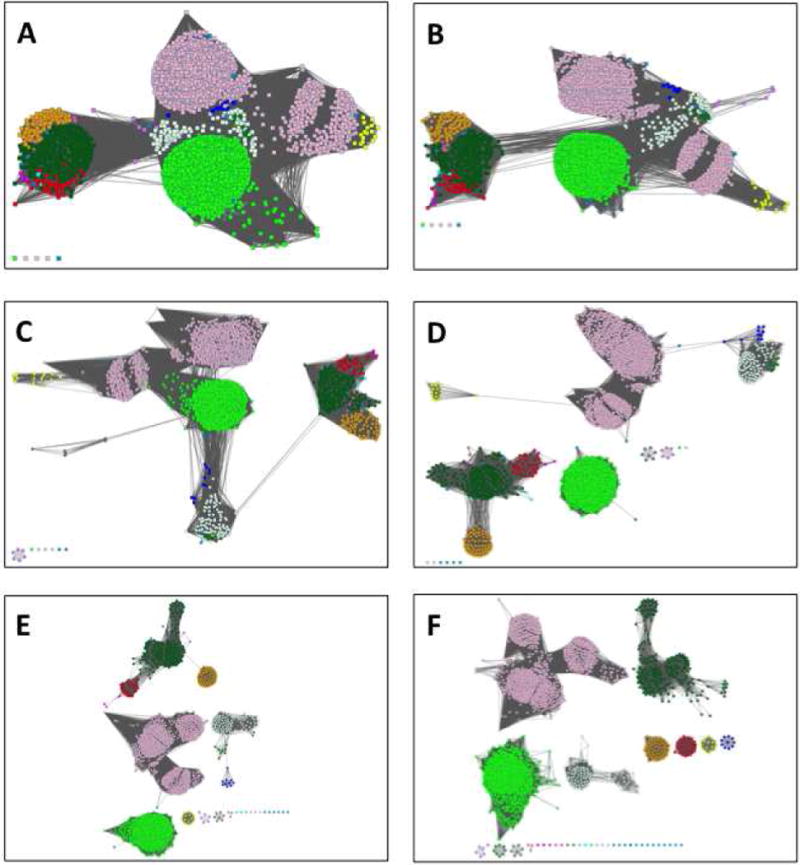
The dependence of the SSN for the OMP decarboxylase superfamily (PF00215) on the minimum alignment score. Panel A, minimum alignment score 10; panel B, minimum alignment score 15; panel C, minimum alignment score 20; panel D, minimum alignment score 25; panel E, minimum alignment score 30; panel F, minimum alignment score 35 (isofunctional clusters). The networks are 80% representative node networks (see text for explanation).
Knowing when isofunctional clusters are achieved is the challenging part of the analysis. An approach for accomplishing this will be illustrated in this review—the alignment score that separates sequences into isofunctional clusters is determined by mapping known functions, e.g., from SwissProt or the literature, on the SSN (using node attributes) and increasing the alignment score (increasing the sequence identity) until different functions are located in distinct clusters. Inspection of the resulting SSN provides a description of sequence-function space in the family, perhaps with some clusters containing sequences with known functions and others containing no functional information, i.e., possibly novel functions.
As the hairball is segregated into isofunctional clusters by using a larger alignment score cutoff, the user can observe how the clusters are connected. These connections may reveal similarities in the structures of the substrates for known and unknown clusters, thereby potentially identifying the type of substrate used by the unknown clusters [20]. In mechanistically diverse superfamilies, these connections also may provide clues about reaction mechanism [21].
In this article, the OMP decarboxylase superfamily (Pfam identifier PF00215) is used to illustrate an SSN-guided analysis of sequence-function space for a functionally diverse superfamily (Figure 4). In panel A (alignment score lower limit 10), the sequences in PF00215 are organized in a single cluster (“hairball”); as the alignment score lower limit for drawing edges is increased to 35, isofunctional clusters separate (panel F). The node colors used to represent the isofunctional clusters in panel F are used in each of the previous panels, so the reader can observe relationships between the isofunctional clusters that provide clues about the reactions catalyzed by the members of the uncharacterized clusters.
4. Representative Node Networks
The number of nodes in an SSN (N) is the number of sequences in the family; the number of edges connecting the nodes varies with the alignment score and is ≤ [N × (N-1)]/2. The memory available to Cytoscape 3.2 that is used to visualize SSNs limits the number of edges that can be displayed: with 4GB RAM, an SSN with ≤ ~500,000 edges can be opened and manipulated; with 64GB RAM, an SSN with ≤ ~5,000,000 edges can be opened and manipulated.
The edge/node ratio in an SSN is determined by the degree of sequence divergence in the family: the ratio is large for a family that is highly conserved (a single cluster in which each node is connected to every other node with edges having large alignment scores); the ratio is small for a family that is functionally diverse (many segregated clusters). For more conserved families, only SSNs for small families can be visualized; for divergent families, SSNs for larger families can be visualized. However, the number of edges in an SSN cannot be predicted a priori.
In release 2014_10 of the UniProt database, the Pfam families range in size from 1 sequence to 1,379,959 sequences, with the distribution of family sizes represented in Table 2. For a conserved family, 500,000 edges corresponds to ~1,000 nodes [(1,000 × 999)/2]; 5,000,000 edges corresponds to ~3,150 nodes [(3,150 × 3,149)/2], both relatively “small” Pfam families. How can SSNs be visualized for the most Pfam families, especially considering that the number of sequences continues to increase as more genomes are sequenced?
Table 2.
Pfam Database Family Size Statistics for UniProt 2014_10.
| Family Size (# of sequences) | Number of Families |
|---|---|
| 1,000–2,000 | 6,683 |
| 2,000–5,000 | 5,170 |
| 5,000–10,000 | 3,363 |
| 10,000–20,000 | 2,156 |
| 20,000–50,000 | 1,308 |
| 50,000–100,000 | 2,156 |
| > 100,000 | 121 |
To solve this problem, EFI-EST generates representative node (“rep node”) SSNs in which the sequences are sorted into “metanodes”. Sequences sharing greater than a specified percent identity are consolidated in the same metanode, thereby reducing the number of nodes and edges that need to be displayed. EFI-EST automatically generates SSNs with metanodes containing sequences sharing from 40% to 100% sequence identity, in increments of 5% (for a total of 13 rep node networks). In a rep node SSN, the node attributes include a list of all of the sequences in the metanode as well lists of the attributes for all of the sequences.
The sequences in the metanodes are identified by the CD-HIT program that identifies the longest sequence in the dataset (the seed sequence) and then collects all other sequences, independent of length, that share sequence identity with the seed sequence greater than the specified amount [22]. After the sequences for the first metanode have been identified, the process is repeated until all of the sequences have been assigned to metanodes. Users should be aware that this procedure incorporates fragments into metanodes with the longer full-length seed sequences—the goal is to reduce the number of nodes and edges that need to be displayed.
In general, even 100% rep node networks (the sequences in each metanode share 100% sequence identity) contain significantly fewer nodes than the full networks. The sequences in the UniProt database are nonredundant (all protein sequences encoded by the same gene in a species/strain are merged into a single UniProt accession). However, the sequences are not unique—UniProt contains sequences from multiple strains of many bacterial species, e.g., Escherichia coli, Salmonella typhimurium, and Bacillus subtilis. Often, addition/deletion of only a small number of genes to the genome makes strains different, but the vast majority of the proteins encoded by the different strains have identical sequences. Indeed, much of the rapid increase in the size of the UniProt database (Figure 1) is explained by the sequences of multiple strains of a relatively small number of bacteria. Approximately 40% of the sequences in UniProt (and thus in Pfam and InterPro domains/families) are actually unique.
At values of sequence identity >70%, the metanodes should contain sequences that share the same function [11]; however, at lower values of sequence identity, the metanodes may be functionally heterogeneous. Nevertheless, rep node networks usually are necessary to display the SSN for an entire family, especially larger families.
5. Sequences and Node Attributes Used by EFI-EST
EFI-EST uses sequences from the UniProt database and their associated descriptions (node attributes; vide infra) from the UniProtKB (http://www.uniprot.org/uniprot/). The EFI’s choice of UniProt, instead of GenBank (http://www.ncbi.nlm.nih.gov/genbank) [23], recognizes the ability of any member of the community to update or correct an annotation in UniProtKB based on experimental evidence; in contrast, GenBank is an archive—the annotations can be changed only by the depositor of the sequence. The ability to change the UniProt annotations allows the community to improve the quality of the information in the database and, thereby, improve the quality of automated functional predictions in the TrEMBL and GenBank databases.
The EFI identifies the members of Pfam and InterPro families (“entries”) for SSN generation using assignments made by InterPro. The EFI updates the sequence/node attribute database used by EFI-EST with each InterPro release. The SSNs in this review use the sequences and entry assignments in InterPro release 49.0 (November 20, 2014) and UniProt release 2014_10 (October 28, 2014).
Although the presence/absence of node-edge connections in an SSN is informative, optimal interpretation of an SSN is facilitated by the availability of sequence-specific metadata. So, in addition to sequences from the UniProt database, the EFI extracts annotation information from the UniProtKB database to generate node attributes. The node attributes supplied with SSNs generated by EFI-EST include, but are not restricted to, the UniProt accession ID and name, Pfam and InterPro family numbers and descriptions, phylogenetic classifications, EC number, Protein Data Bank deposition code(s), SwissProt status (reviewed or unreviewed), SwissProt description, and the Gene Ontology (GO) classification (Table 3). These node attributes can be used in Cytoscape to query and/or filter the SSN to facilitate the recognition of functional characteristics.
Table 3.
Sequence annotations included as node attributes in SSNs produced by EFI-EST.
| Node Attribute | Description |
|---|---|
| ACC1 | UniProt accession(s) |
| Uniprot_ID | UniProt ID(s) |
| GN | gene name(s) |
| GI | GI numbers |
| STATUS | reviewed – manually annotated, in Swiss-Prot; unreviewed automatically annotated, in TrEMBL |
| Description | protein name(s)/annotation(s) in UniProtKB |
| SwissProt_Description | protein name(s)/annotation(s) in UniProtKB for SwissProt reviewed entries |
| IPRO | InterPro family(ies) |
| PFAM | Pfam family(ies) |
| PDB | Protein Data Bank entry |
| CAZY | Carbohydrate-Active enZYmes (CAZy) family name(s) |
| EC | EC number(s) |
| GO | Gene Ontology classification(s) |
| Sequence_Length | number(s) of amino acid residues |
| Domain | domain of life to which the organism(s) belong(s) |
| PHYLUM | Phylogenetic phylum/phyla of the organism(s) |
| CLASS | Phylogenetic class(es) of the organism(s) |
| ORDER | Phylogenetic order(s) of the organism(s) |
| FAMILY | Phylogenetic family(ies) of the organism(s) |
| GENUS | Phylogenetic genus/genera of the organism(s) |
| SPECIES | Phylogenetic species of the organism(s) |
| Organism | organism genus/genera and species |
| Taxonomy_ID | NCBI taxonomy identifier(s) |
| HMP_Body_Site | location(s) of organism(s) in/on the body, if human microbiome organism |
| HMP_Oxygen | oxygen requirement(s), if human microbiome organism |
| EFI_ID | Enzyme Function Initiative database ID(s) |
| GDNA | availability of gDNA(s) at EFI Protein Core |
| Shared name | Full network – UniProt accession; Rep Node network – UniProt accession for the longest sequence in the representative node |
| name | UniProt accession for the longest sequence in the representative node |
| Cluster Size1 | number of proteins represented by the representative node |
Representative node SSNs only
6. Protein Families/Domains Described by Pfam and InterPro
EFI-EST provides the user with two options for generating SSNs:
Option A to explore local sequence-function space defined by a user-specified sequence, often resulting in a small fraction of the membership of a Pfam and/or InterPro entry. The user either has the sequence or can find it in UniProt (or GenBank).
Option B to generate the SSN for any Pfam or InterPro entry (or combination of Pfam and/or InterPro entries that populate a homologous protein family). The InterPro entry identifiers (IPRnnnnnn; six digits) and Pfam entry identifiers (PFnnnnn; five digits) are used as the user-specified input for Option B.
The Pfam and/or InterPro entries for a user-provided sequence are identified using the InterProScan tool that is available on the InterPro home page (http://www.ebi.ac.uk/interpro/; Figure 5). The EFI-EST “Start Page” (http://efi.igb.illinois.edu/efi-est/stepa.php; Figure 3) provides a link to the InterPro home page where the user’s sequence can be used as the query for InterProScan and the entry identifiers then used as the input for Option B. InterProScan scans the user-provided sequence against the signature sequences provided by the eleven databases that are used to define the 26,860 entries in the InterPro database. Any InterPro or Pfam entry can be accessed by EFI-EST using its identifier.
Figure 5.
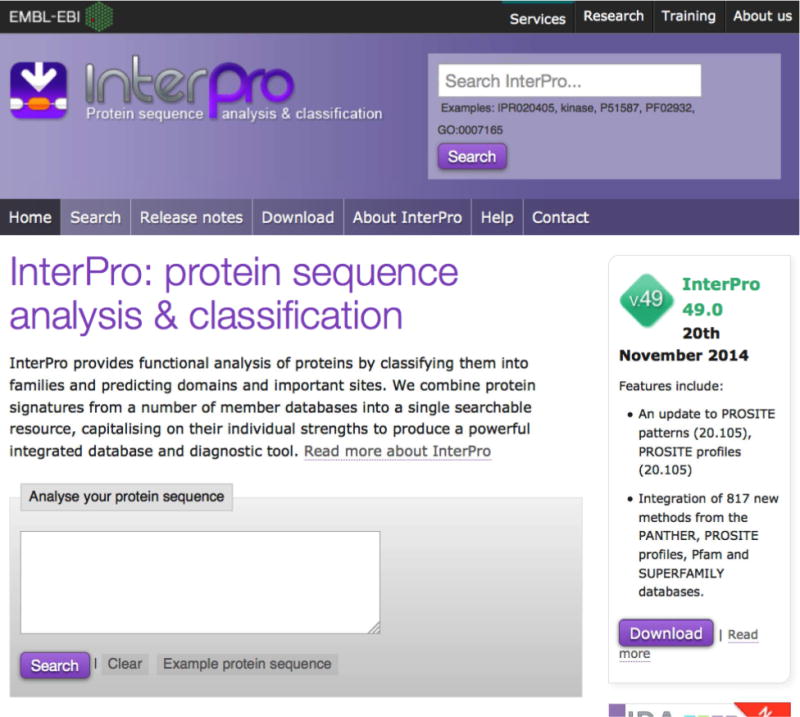
InterPro homepage (http://www.ebi.ac.uk/interpro/).
The InterProScan output is a graphical listing of the InterPro entries for which a match is identified (Figure 6). The sequence segments that match the database signatures for the InterPro entries are provided with links to web pages in the databases that provide useful information.
Figure 6.
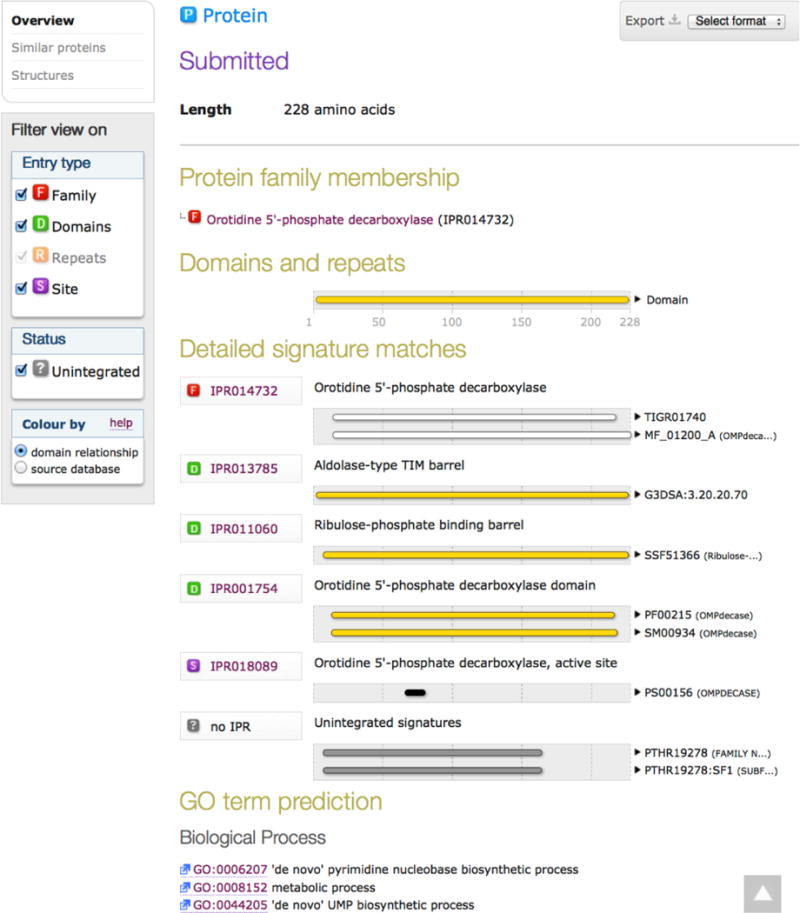
The output of InterProScan5 using the sequence of MtOMPDC as the query.
Some InterPro entries are described by a single database, e.g., Pfam; others are aggregates of entries from multiple databases. Therefore, the use of InterPro entries instead of (or in addition to) Pfam entries often allows a more comprehensive description of the homologous family for which the SSN will be generated.
Both InterPro and Pfam often provide separate entries for different domains of the same protein. For example, InterPro and Pfam include entries for both the N-terminal (IPR020811 based on PF03952; 24,650 sequences) and C-terminal domains (IPR020810 based on PF00113; 25,979 sequences) for glycolytic enolase (2-phospho-D-glycerate dehydratase). The user can use either the InterPro or the Pfam entry for either domain as the input for Option B; specifying both the InterPro and Pfam identifiers to the same domain is redundant because the InterPro entry is defined by only the Pfam entry. However, including the identifiers for both domains would identify more sequences (26,923 sequences) than if only one domain had been specified. Therefore, to be inclusive, the users should specify the Pfam (or InterPro) identifiers for all of the domains in their “favorite” protein. The resulting sequence set is filtered to remove duplicate occurrences of the same UniProt accession.
Although membership in an InterPro or Pfam entry is based on the sequence of a single domain, the sequences provided by UniProt are for the full-length (multidomain) proteins. The full-length sequences are used by EFI-EST to generate the SSNs.
7. Generating SSNs with EFI-EST
The following subsections describe the steps involved in generating the SSN; section 8 illustrates the use of these steps.
a. Step 1: “Start Page”
The EFI-EST “Start Page” (http://efi.igb.illinois.edu/efi-est/stepa.php) provides two options for generating SSNs (Figure 3):
In Option A the user inputs a protein sequence, and EFI-EST uses BLAST to collect the most similar up to 5,000 of the most similar sequences in the UniProt database that share an E-value < 10−5; thus, so < 5,000 sequences may be collected. The sequence is entered without the FASTA header.
In Option B the user inputs one or more Pfam and/or InterPro identifiers (determined as described in the previous section) for a protein family, with EFI-EST collecting the entire set of sequences from UniProt. The input can be any number of comma-separated Pfam and/or InterPro identifiers needed to populate a protein family. The total number of sequences currently is limited to ≤ 100,000 to 1) conserve the computational resources; and 2) optimize the utility of the rep node networks that most users will need to use to visualize the SSNs.
The user also enters an e-mail address for progress notification and then clicks the GO button. A new page confirms that the job has started, and an e-mail is sent that provides the identity of the user-specified query for Option A or the Pfam/InterPro entries for Option B.
The program then collects the sequences and performs the all-by-all BLAST using 24 processors on the EFI’s cluster to calculate alignment scores (edges). Node pairs are retained only if the internode alignment score is >5, i.e., the edges in the SSNs will have alignment scores >5. After the BLAST is completed, the program generates four graphs to aid selection of the alignment score lower limit for generating the initial SSNs:
A “Length Histogram” provides the number of sequences as a function of the sequence length (Figure 7). This histogram provides information about the length heterogeneity within the family, including the presence of fragments that most likely result from sequencing errors as well as multidomain proteins that include the specified Pfam and/or InterPro entries.
A “Number of Edges Histogram” provides the number of edges calculated as a function of the alignment score (Figure 8). This histogram describes the divergence of the sequences: a divergent superfamily with many isofunctional families will contain many edges at small alignment scores that describe the sequence relationships among the divergent families and relatively few edges with large alignment scores that describe the sequence relationships within the isofunctional families. In contrast, a highly conserved isofunctional family will contain few edges at small alignment scores and many edges at large alignment scores.
An “Alignment Length Quartile Plot” displays the alignment lengths used by BLAST to calculate the alignment scores as a function of alignment score (Figure 9), with the data for each alignment score showing the full range of the alignment lengths (extremes) as well as the lengths for the median 50% of the sequences (defined by the red “box”). When selecting the alignment score for outputting the SSN, the user should select a value for which the alignment score is calculated for the full-length sequence (vide infra).
A “Percent Identity Quartile Plot” describes the percent identity for the alignment as a function of alignment score (Figure 10). This is the most useful plot because the user must specify an alignment score lower limit (pair-wise percent identity lower limit) to output the SSN. The user should select a lower limit that corresponds to ~35% sequence identity to prevent over-fractionation of clusters of isofunctional proteins (at larger alignment scores) but remove edges that describe unwanted divergent relationships (at lower alignment scores), remembering that the available RAM on the user’s computer limits the number of edges that can be displayed.
Figure 7.
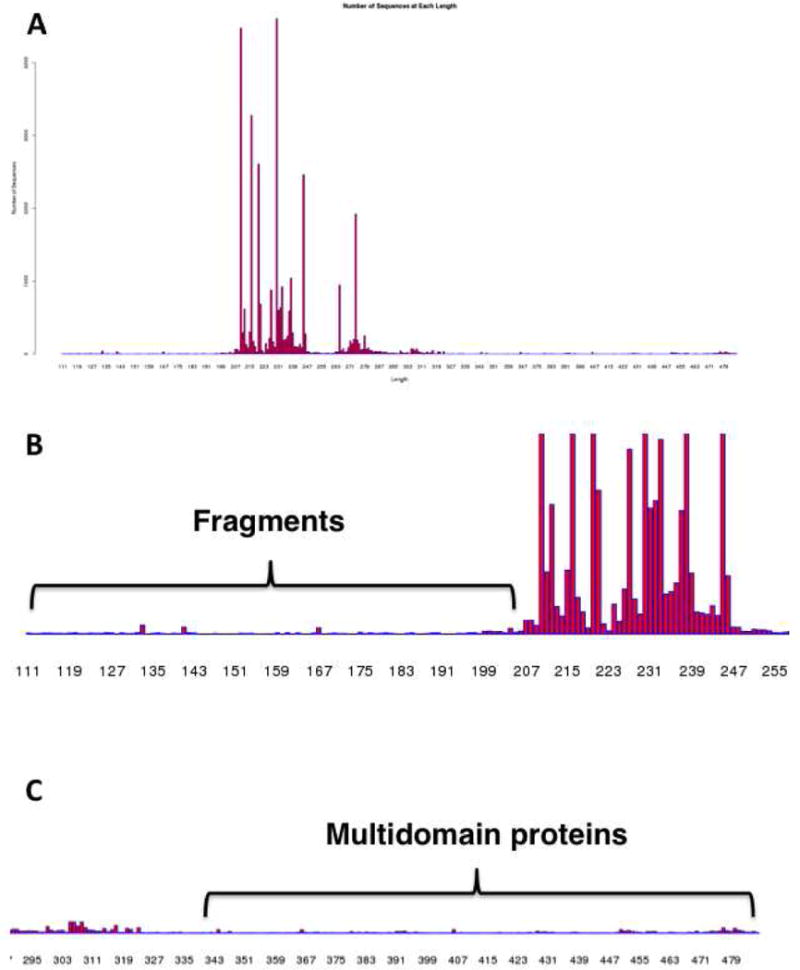
Panel A, the “Length Histogram” for the OMP decarboxylase superfamily (PF00215) showing the number of sequences as a function of length (number of residues). Panel B, a portion of Panel A showing the presence of truncated fragments (< ~190 residues). Panel C, a portion of Panel A showing fragments.
Figure 8.
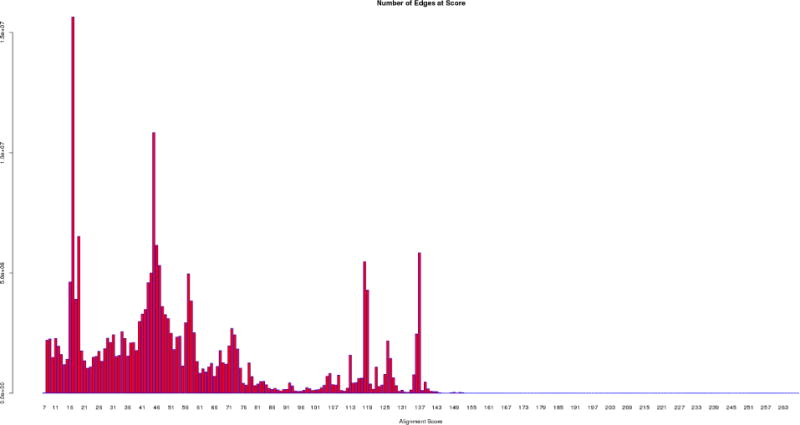
The “Number of Edges Histogram” for the OMP decarboxylase superfamily (PF00215) showing the number of edges calculated by BLAST as a function of alignment score
Figure 9.
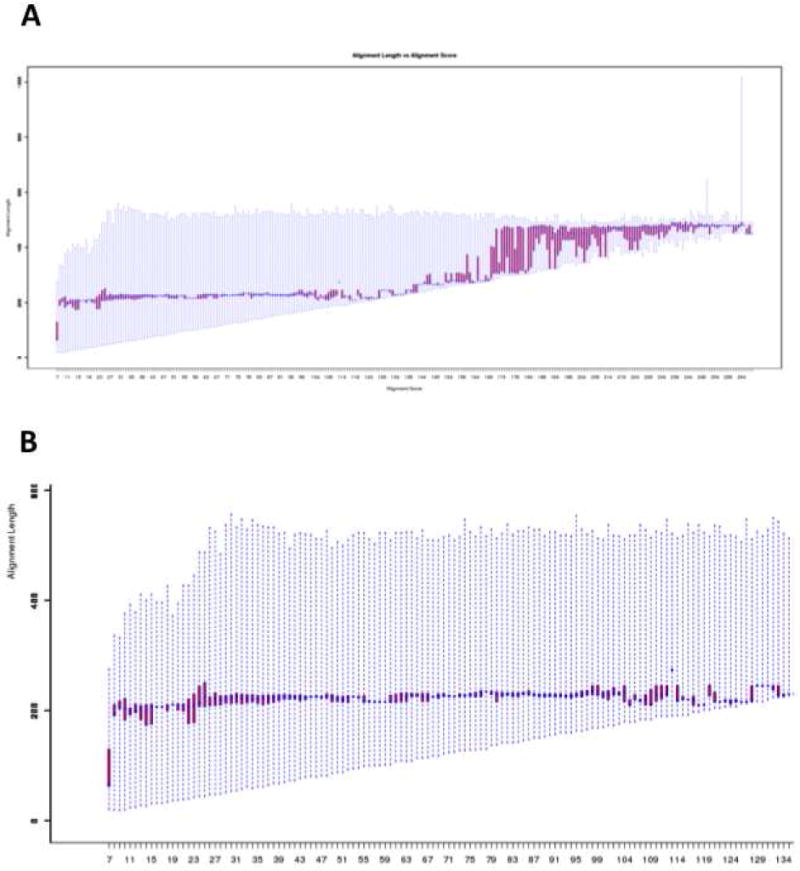
Panel A, the “Alignment Length Quartile Plot” for the OMP decarboxylase superfamily (PF00215) showing the alignment length used to calculate alignment scores as a function of alignment score. Panel B, a portion of panel A (alignment scores < 130) showing the region describing alignment of single domain proteins.
Figure 10.
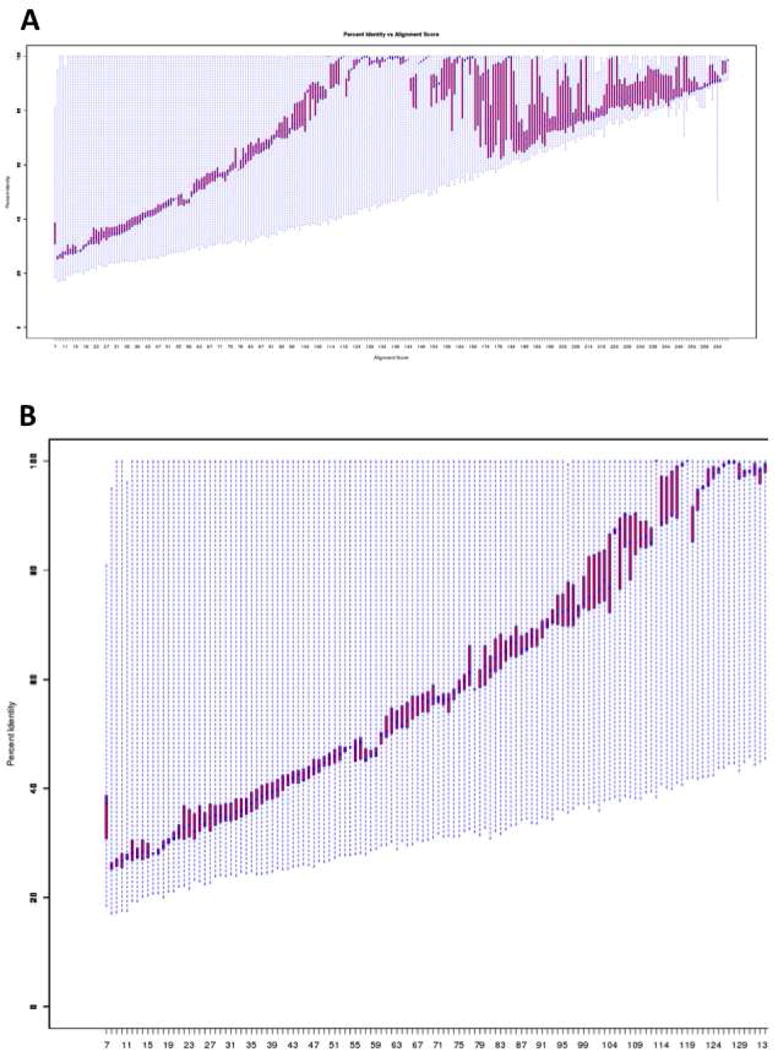
Panel A, the “Percent Identity Quartile Plot” for the OMP decarboxylase superfamily (PF00215) showing the percent identity as a function of alignment score. Panel B, a portion of panel A (alignment scores < 130) showing the dependence of percent identity on alignment score for single domain proteins.
The time required to execute Step 2 depends on the number of sequences that are retrieved by the user’s query. For Option A with queries that return 5,000 sequences, the time is typically several hours. For Option B, small protein families (<5,000 sequences) may require only a few minutes; large families may require several hours or more (the time required for the all-by-all BLAST increases roughly by the square of the number of sequences).
[Users wanting to generate SSNs for >100,000 sequences should send an e-mail to efi@enzymefunction.org to request an account on the EFI’s computer cluster at the IGB at the University of Illinois; SSNs can be constructed for a protein family of any size by executing the command line program remotely.]
c. Step 2: Analyzing the BLAST Dataset
When Step 1 is finished, an e-mail is sent to the user providing a link to the “Data Set Completed” page (Figure 11) that has links for displaying and downloading the four graphs described in the previous section. The page also has input fields for 1) the alignment score lower limit for generating the SSNs (required), 2) optional minimum and maximum length restrictions that the user may apply to exclude fragments and/or multidomain sequences, respectively (optional), and 3) a title for the SSN (required). After the values are entered, a new page is displayed telling the user that the output files for the SSNs are being generated. When the job is finished, the user is sent an e-mail that provides a link to the “Download Network Files” page.
Figure 11.
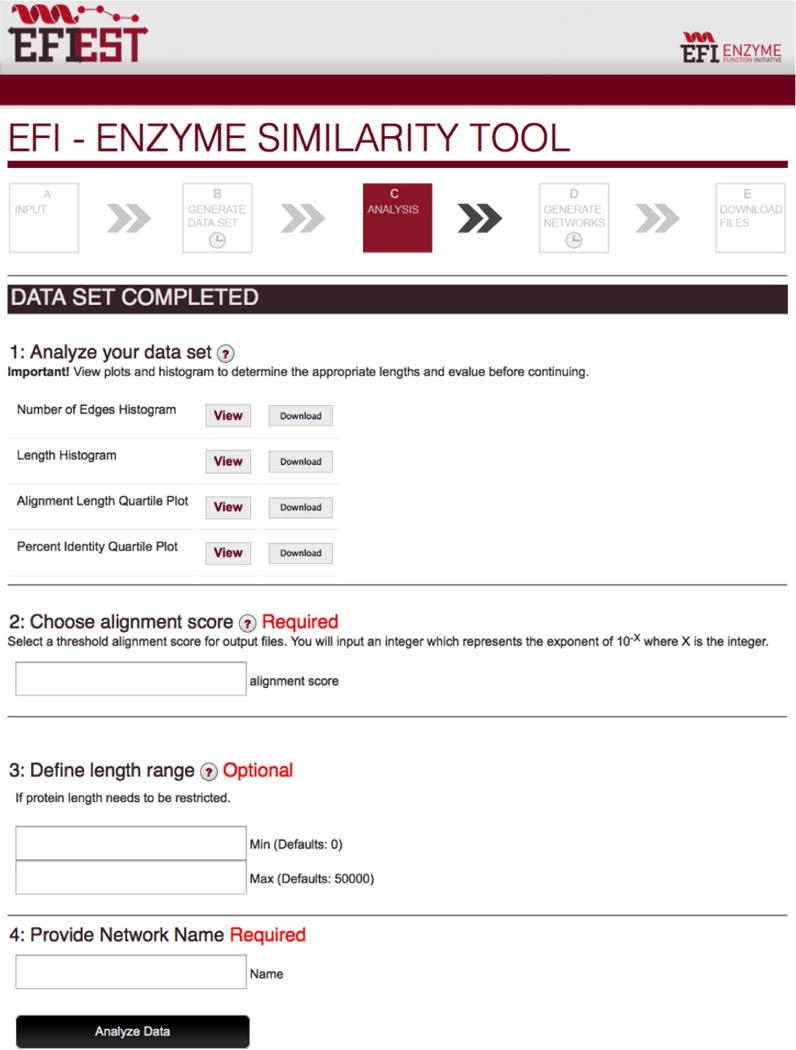
The “Data Set Completed” page for EFI-EST.
d. Step 3: Downloading the SSN(s)
The “Download Network Files” page (Figure 12) provides links for downloading the rep node SSNs. The numbers of nodes and edges for each SSN are given, allowing the user to download SSNs that can be visualized in Cytoscape. Files for full SSNs are provided only when the number of edges is ≤10,000,000—an upper limit for SSNs that can be opened on desktop computers. The total number of sequences in the family also is provided so that the user knows the size of the family. The SSN files are provided in the XGMML format accepted by Cytoscape.
Figure 12.
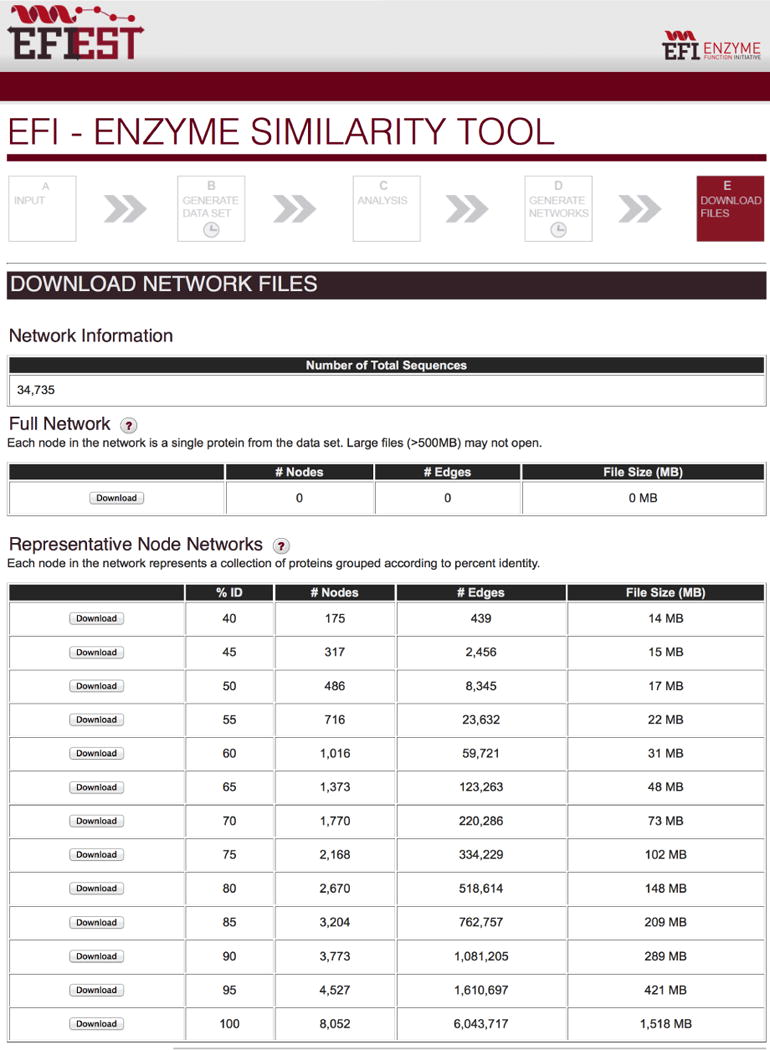
The “Download Network Files” page for EFI-EST showing the sizes of the full and representative networks [for the OMP decarboxylase superfamily (PF00215)] and the buttons for downloading the networks to the user’s computer.
e. Visualizing SSNs with Cytoscape
Cytoscape 3.2 is recommended for analysis of the SSN. The EFI-EST tutorial (http://efi.igb.illinois.edu/efi-est/tutorial.php) provides instructions for using Cytoscape; these will not be repeated in this review.
8. Example: Generation, Visualization, and Analysis of the SSN for the OMP Decarboxylase Superfamily (Pfam Entry PF00215)
For the remainder of this review, the OMP decarboxylase superfamily (Pfam entry PF00215) is used to illustrate the use of both Options A and B. The OMP decarboxylase (OMPDC) superfamily is functionally diverse with three characterized reactions (Figure 13): 1) OMPDC in pyrimidine nucleotide biosynthesis; 2) 3-keto-L-gulonate 6-monophosphate decarboxylase (KGPDC) in L-ascorbate catabolism [24]; and 3) D-arabino-hex-3-ulose synthase (HUMPS) into two metabolic contexts, detoxification of formaldehyde (C-C bond formation) and formation of ribulose 5-phosphate for nucleotide biosynthesis (C-C bond cleavage) [25, 26]. Despite different substrates and reaction mechanisms, the members of this superfamily have a conserved quaternary structure [dimer of (β/α)8-barrels], with the active sites located at the interface of the barrels. The mechanisms of the reactions catalyzed by OMPDC and KGPDC have been investigated in the laboratory of one of the authors (J.A.G.) [24, 27–32].
Figure 13.
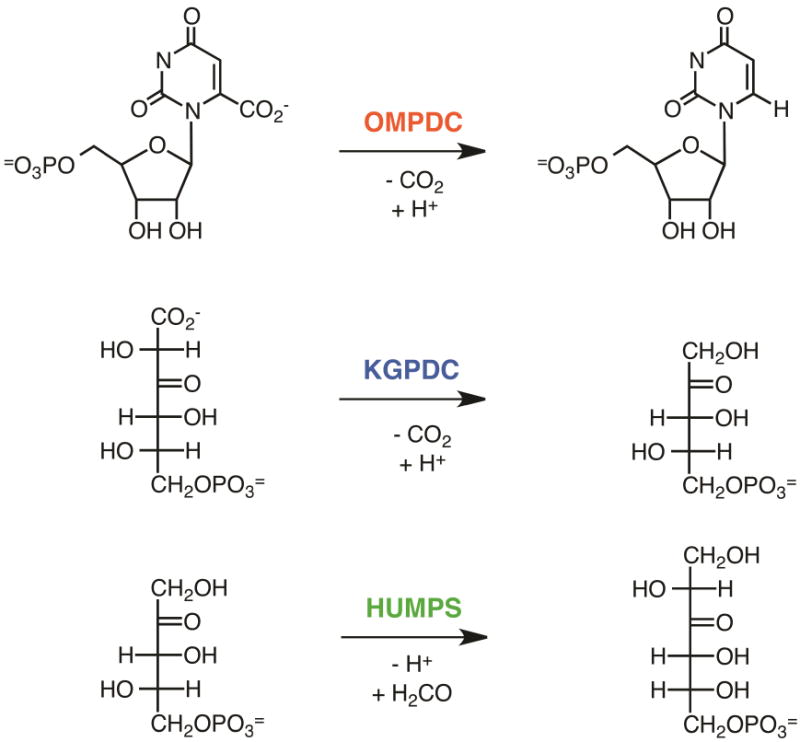
Reactions catalyzed by the OMP decarboxylase superfamily.
The strategies used to visualize and analyze the SSN for the OMP decarboxylase superfamily can be applied universally to other sequence datasets (closest neighbors for Option A and complete families for Option B). Option B will be described first to provide a large-scale overview of structure/function space in PF00215; Option A then will be described to illustrate its use in enabling more focused analyses.
a. Option B: Identification of the Pfam Entry (PF00215)
The structurally and mechanistically characterized OMPDC from Methanothermobacter thermautotrophicus ATCC 29096 (MtOMPDC; UniProt accession Q26232; Table 4) is used to demonstrate the identification of the Pfam/InterPro entries for generating the SSNs. Five InterPro entries are identified using InterProScan (Figure 6).
Table 4.
Input used for Option A examples.
| Gene Name | FASTA |
|---|---|
| MtOMPDC |
>sp|O26232|PYRF_METTH Orotidine 5′ – phosphate
decarboxylase OS=Methanothermobacter thermautotrophicus (strain ATCC 29096 /
DSM 1053 / JCM 10044 / NBRC 100330 / Delta H) GN=pyrF PE=1
SV=1 MRSRRVDVMDVMNRLILAMDLMNRDDALRVTGEVREYIDTVKIGYPLVLSEGMDIIAEFRK RFGCRIIADFKVADIPETNEKICRATFKAGADAIIVHGFRGADSVRACLNVAEEMGREVFL LTEMSHPGAEMFIQGAADEIARMGVDLGVKNYVGPSTRPERLSRLREIIGQDSFLISPGVG AQGGDPGETLRFADAIIVGRSIYLADNPAAAAAGIIESIKDLLNP |
| BsOMPDC |
>sp|P25971|PYRF_BA CSU Orotidine 5′ – phosphate
decarboxylase OS=Bacillus subtilis (strain 168) GN=pyrF PE=1
SV=1 MKNNLPIIALDFASAEETLAFLAPFQQEPLFVKVGMELFYQEGPSIVKQLKERNCELFLDL KLHDIPTTVNKAMKRLASLGVDLVNVHAAGGKKMMQAALEGLEEGTPAGKKRPSLIAVTQL TSTSEQIMKDELLIEKSLIDTVVHYSKQAEESGLDGVVCSVHEAKAIYQAVSPSFLTVTPG IRMSEDAANDQVRVATPAIAREKGSSAIVVGRSITKAEDPVKAYKAVRLEWEGIKS |
| EcOMPDC |
>sp|P08244|PYRF_ECOLI Orotidine 5′ – phosphate
decarboxylase OS=Escherichia coli (strain K12) GN=pyrF PE=1
SV=1 MTLTASSSSRAVTNSPVVVALDYHNRDDALAFVDKIDPRDCRLKVGKEMFTLFGPQFVREL QQRGFDIFLDLKFHDIPNTAAHAVAAAADLGVWMVNVHASGGARMMTAAREALVPFGKDAP LLIAVTVLTSMEASDLVDLGMTLSPADYAERLAALTQKCGLDGVVCSAQEAVRFKQVFGQE FKLVTPGIRPQGSEAGDQRRIMTPEQALSAGVDYMVIGRPVTQSVDPAQTLKAINASLQRS A |
| ScOMPDC |
> sp|P03962|PYRF_YEAST Orotidine 5′ – phosphate
decarboxylase OS=Saccharomyces cerevisiae (strain ATCC 204508 / S288c)
GN=URA3 PE=1 SV=2 MSKATYKERAATHPSPVAAKLFNIMHEKQTNLCASLDVRTTKELLELVEALGPKICLLKTH VDILTDFSMEGTVKPLKALSAKYNFLLFEDRKFADIGNTVKLQYSAGVYRIAEWADITNAH GVVGPGIVSGLKQAAEEVTKEPRGLLMLAELSCKGSLATGEYTKGTVDIAKSDKDFVIGFI AQRDMGGRDEGYDWLIMTPGVGLDDKGDALGQQYRTVDDVVSTGSDIIIVGRGLFAK GRDAKVEGERYRKAGWEAYLRRCGQQN |
Two structure-based InterPro domains are identified, IPR013785 (aldolase-type TIM barrel; 1,076,349 sequences) and IPR011060 (ribulose-phosphate binding barrel; 175,944 sequences), which are defined by the CATH/Gene3D and SCOP/Superfamily databases, respectively. These entries contain not only members of the OMPDC superfamily but also members of much larger groups of (super)families that contain the (β/α)8-barrel fold: “aldolase-type TIM barrels” in IPR013785 and “ribulose-phosphate binding barrels” in IPR011060, with the sequences in the latter a subset of the sequences in the former. Both entries are too large for EFI-EST, although SSNs for these could be generated using an account on the EFI’s computer cluster (vide supra).
One sequence-based InterPro domain, IPR001754 (orotidine 5′-phosphate decarboxylase domain; 34,749 sequences), is defined by entries from both the Pfam (PF00215) and SMART (SM00934) databases. Not all InterPro entries are defined by multiple databases; however, when they are, the number of sequences in the InterPro entry likely will be larger than the numbers identified by the individual database entries because different InterPro member databases use different bioinformatics approaches to classify sequences, thus leveraging the expertise of multiple groups.
One InterPro family, IPR014732 (orotidine 5′-phosphate decarboxylase, 16,266 sequences), is defined by entries in both the TIGR (TIGR01740) and HAMAP (MF_01200_A) databases.
And, one InterPro conserved site, IPR018089 (orotidine 5′-phosphate decarboxylase, active site; 19,314 sequences), is defined by the Prosite database (PS00156).
InterProScan also identifies two Panther families (PTHR19278 and PTHR19278:SF1) that are not incorporated into an InterPro entry. Because these are not incorporated into an InterPro entry, they cannot be accessed by EFI-EST.
The availability of multiple InterPro entries for a family allows EFI-EST users to be inclusive in identifying sequences for generating SSNs.
b. EFI-EST: “Start Page”
To generate the SSN for the OMPDC superfamily as defined by PF00215, the user enters the Pfam entry identifier (PF00215) in the Option B box on the EFI-EST “Start Page” (Figure 6) along with an e-mail address in the indicated box, and then clicks the “GO” button. This initiates collection of the sequences, the all-by-all BLAST, and generation of the four graphs (vide infra) to inform selection of the alignment score lower limit (percent identity lower limit) for outputting the SSN files.
Using the InterPro 49.0/UniProt 2014_10 releases, EFI-EST collects 34,735 sequences. However, the user could have entered IPR001754 that is derived from both the Pfam (PF00215) and SMART (SM00934) databases. Note that the sequence sets identified by PF00215 and IPR001754 are not identical—IPR001745 collects 34,749 sequences. This is a small increase in the number of sequences relative to PF00215, but depending on the definitions of a family by the databases, the number of sequences may be much larger for InterPro entries defined by multiple databases (an InterPro entry) than for those defined by a single database (e.g., Pfam).
The OMPDC superfamily is described by three InterPro entries (IPR014732, IPR001754, and IPR018089), so the user could have entered all three identifiers in the Option B box. This would have collected 34,759 sequences, slightly greater than the numbers collected by PF00215 and IPR001754. Inclusion of the structure-based InterPro domains, IPR013785 and IPR011060, is not possible with EFI-EST since the number of sequences would be ≥100,000 nor is it the most appropriate option for exploring sequence-function space in the OMPDC superfamily because these contain members of other functionally diverse superfamilies that share the (β/α)8-barrel fold.
b. Analyzing the BLAST Dataset: Specifying an Alignment Score Lower Limit for the SSNs
The “Data Set Completed” page (Figure 11) provides links for displaying and downloading to the user’s desktop the four graphs that will be used to select 1) the alignment score lower limit (percent identity lower limit) for generating the SSN files (required), and 2) minimum and/or maximum length limits to exclude fragments and/or multidomain proteins (optional). The user should download and save all four of the graphs for future reference. Interpretation of the graphs for PF00215 is provided in this section.
The “Length Histogram” is displayed in Figure 7A. The majority of the sequences are single domain proteins that have lengths between 200–350 residues (the minimum length for a protein with the (β/α)8-barrel fold is ~200 residues): additional residues are N- and C-terminal extensions as well as internal loops that extend the total length of the single domain proteins beyond the 200 residue minimum. In addition to the single domain proteins, the length histogram reveals the presence of shorter sequences (≤ 200 residues; fragments; Figure 7B) as well as longer sequences [≥ 350 residues; multidomain proteins, including fusions to either phosphoribosyltransferase domains (bifunctional OMP decarboxylases/orotate phosphoribosyltransferases) or formaldehyde activating domains (bifunctional D-arabino-hex-3-ulose 6-phosphate synthases/formaldehyde activating enzymes); Figure 7C].
The “Number of Edges Histogram” is displayed in Figure 8. This graph reveals that the majority of the edges are associated with small alignment scores, with few at very large alignment scores. Recall that this edge profile is a hallmark of divergent superfamilies that contain many isofunctional families; in PF00215, the superfamily, in fact, is populated by multiple divergent OMPDC families as well as the HUMPS and KGPDC families.
The “Alignment Length Quartile Plot” is displayed in Figure 9A. At the smallest alignment scores, the alignment length is a fraction of the minimum length for a protein with the (β/α)8-barrel fold. The alignment length then increases to ~ 200 residues and is constant until the alignment score reaches 130 (in the length histogram (vide supra), the alignment scores between 10 and 130 correspond to alignments of sequences between 200 and 220 residues in length). Within this range (Figure 9B), the alignment score is calculated over the full length of the (β/α)8-barrel domain, so these alignment scores are reliable measures of the pair-wise sequence similarity. As the alignment score increases further, the alignment length increases, corresponding to the sequences that have extensions to the minimal (β/α)8-barrel structure. At an alignment score of >150, the alignment length increases to ~ 450 residues as the multidomain proteins are aligned.
Notice that in the length histogram the number of sequences with a multidomain structure is very small (Figure 7C); however, these sequences disproportionately determine the shape of the alignment length quartile plot. In other words, the dependence of alignment length on alignment score does not reflect the length distribution of the sequences in the superfamily. The “Alignment Length Quartile Plot” allows the user to select an alignment score range that corresponds to alignment of full-length sequences for the OMPDC (β/α)8-barrel domain (≤ 130), thereby allowing proper interpretation of the subsequent “Percent Identity Quartile Plot”.
The “Percent Identity Quartile Plot” is displayed in Figure 10A. The shape of the plot is influenced by the presence of sequences with multiple domains, just as the shape of the “Alignment Length Quartile Plot” is influenced by these sequences. At alignment scores that correspond to alignment of the (β/α)8-barrel domains, the percent identity increases monotonically toward 100% as the alignment score increases (Figure 10B). When the alignment length increases further to include an additional domain in the alignment score calculation, the percent identity decreases and then increases a second time as the full-length longer sequences are aligned. The user should use the correlation between alignment score and percent identity in the range that corresponds to pair-wise alignments for the OMPDC (β/α)8-barrel domain; alignment score < 130), i.e., the initial increase in the dependence of percent identity on alignment score.
A minimum alignment score corresponding to ~ 35% sequence identity usually is a good choice for generating the initial SSN. Simultaneous visualization and analysis of the resulting network in the context of the node attributes should allow the user to increase, if necessary, the alignment score lower limit to achieve segregated isofunctional clusters.
From the “Percent Identity Quartile Plot”, 35% sequence identity corresponds to an alignment score of 35 (Figure 10B). This value is entered in the “Choose Alignment Score for Output” field on the “Data Set Completed” page (Figure 11). For this example, a value of 190 is entered in the field for the minimum length to remove fragments; the maximum length field is left blank to include the multidomain proteins. In the “Provide Network Name” field, the user provides a name for the network when it is opened in Cytoscape, e.g., “PF00215_e-35”. Finally, the user initiates generation of the SSNs.
c. Downloading the Full and Representative Node SSNs
The “Download Network Files” page (Figure 12) displays the total number of sequences used in the analysis and provides links for downloading the SSNs as well as a summary of the number of nodes and edges in each SSN file. For this example, a total of 34,735 sequences was identified in PF00215 and used to calculate the edges with alignment scores >5. By applying the minimum length restriction of 190 residues, the number of sequences was reduced to 34,202, the number of nodes in the full network.
A selection of the rep node SSNs is shown in Figure 14. The number of metanodes and edges for each SSN is given in the Figure legend—note that the number of both nodes and edges decreases as the sequence identity used to cluster the sequences into metanodes decreases. In the analysis that follows, 80% rep node networks are used.
Figure 14.
Representative node networks for the OMP decarboxylase superfamily (PF00215) using a minimum alignment score of 35. The full network that is too large to be displayed contains 34,202 nodes and 149,161,337 edges. Panel A, 100% rep node network, 8,052 nodes, 6,043,717 edges. Panel B, 90% rep node network, 3,773 nodes, 1,081,205 edges. Panel C, 80% rep node network, 2,670 nodes, 518,614 nodes. Panel D, 70% rep node network, 1,770 nodes, 220,286 edges. Panel E, 60% rep node network, 1,016 nodes, 59,721 edges. Panel F, 50% rep node network, 486 nodes, 8,345 edges.
d. Visualizing and Analyzing the SSNs with Cytoscape
For simplicity, the minimum alignment score used in this example (35) is that required to separate the superfamily into isofunctional clusters. Note that the OMPDC, HUMPS, and KGPDC functions are associated with different clusters (Figure 4F), although the OMPDC function is associated with several clusters because of phylogenetic diversity. If 30 is used as the minimum alignment score (Figure 4E), the functions are not segregated.
The conclusion that the clusters are isofunctional is based on the annotations in SwissProt (Figure 15) that are supported by genome context analysis. Although the details of the genome context analysis are not presented here, this was performed on a large-scale (for the entire SSN) using the EFI’s Genome Neighborhood Tool (EFI-GNT) that also is available on the EFI’s website (http://efi.igb.illinois.edu/efi-gnt/); EFI-GNT is in development and will be the topic of a future review.
Figure 15.
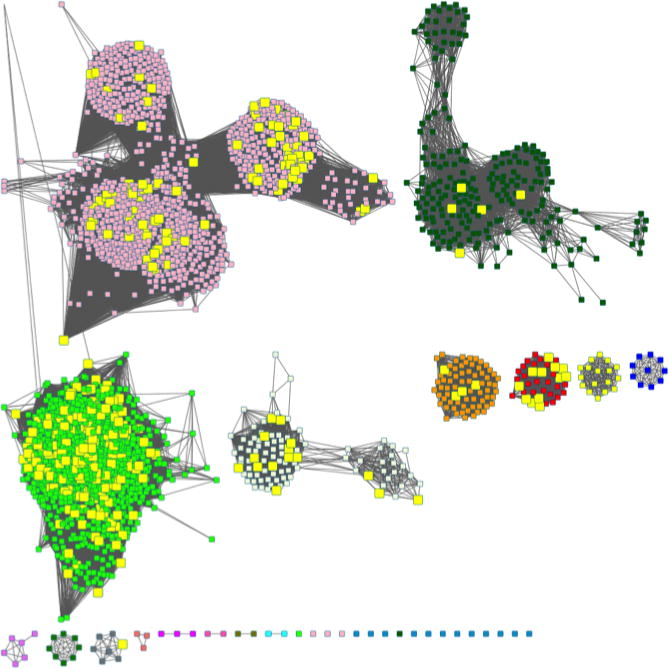
The 80% rep node network for the OMP decarboxylase superfamily (PF00215) with a minimum alignment score of 35 in which the metanodes with reviewed SwissProt status are highlighted in yellow.
f. Using SwissProt Annotations
Cytoscape can be used to select sequences in the SSNs that contain specific information in the node attributes. For the purpose of assessing when an SSN is segregated into isofunctional clusters, the pertinent node attributes are SwissProt “STATUS” (Reviewed or Unreviewed) and the “SwissProt Description” that are obtained from UniProtKB.
In the 80% rep node network with a minimum alignment score of 35 (Figure 15):
Four metanodes have the SwissProt “Reviewed” status (STATUS node attribute) and a SwissProt Description that includes “L-gulonate” (as in KGPDC); these are located in one cluster (orange). These attributes together suggest that members of the KGPDC family populate the orange cluster.
Seventeen metanodes have the SwissProt “Reviewed” status and a SwissProt Description that includes “hps” (as in 3-hexulose 6-phosphate synthase); these are located in two clusters (dark green and red). These attributes together suggest that members of the HUMPS family populate the dark green and red clusters.
-
Twelve metanodes have the SwissProt “Reviewed” status and a SwissProt Description that includes both “bifunctional” and “fae” (for formaldehyde activating enzyme); these are located in one cluster (red). The attributes together suggest that members of the bifunctional HUMPS/FAE family populate the red cluster. In addition, as revealed by using representative sequences as queries for InterProScan, the proteins in this cluster contain two domains, one associated with PF00215 (OMPDC domain) and the second associated with PF08714 (FAE; formaldehyde activating enzyme).
[FAE is involved in both 1) formaldehyde detoxification by condensing formaldehyde with tetrahydromethanopterin for delivery to the HUMPS domain for the formation of 3-hexulose 6-monophosphate that is subsequently converted to D-fructose 5-phosphate, and 2) synthesis of D-ribulose 5-phosphate for isomerization to D-ribose 5-phosphate for nucleotide biosynthesis via the cleavage of 3-hexulose 6-monophosphate.]
Two hundred fifty eight (258) metanodes have the SwissProt “Reviewed” status and a SwissProt Description that includes “orotidine” (as in OMPDC); these are located in four clusters (pink, bright green, ivory, and grey). These attributes together suggest that members of phylogenetically divergent OMPDC subfamilies populate these clusters.
g. Using Genome Context
The genome neighborhoods (± 10 genes) of the proteins in the orange cluster include members of PF01261 (Xylose isomerase-like TIM barrel) and PF00596 (Class II aldolases). In the pathway for catabolism of L-ascorbate to D-ribulose 5-phosphate [24], KGPDC catalyzes the decarboxylation of 3-keto-L-gulonate 6-phosphate to L-xylulose 5-phosphate, a member of PF01261 catalyzes the 3-epimerization of the L-xylulose 5-phosphate product of KGPDC to L-ribulose 5-phosphate, and a member of PF00596 catalyzes the 4-epimerization of L-ribulose 5-phosphate to D-xylulose 5-phosphate [24]. This genome neighborhood provides additional evidence that members of the KGPDC family populate the orange cluster.
The genome neighborhoods of the proteins in the cyan cluster include members of PF01380 (Sugar isomerase). One pathway for detoxification of formaldehyde involves the condensation of formaldehyde with D-ribulose 5-phosphate to form D-arabino-hex-3-ulose 6-phosphase synthase (the HUMPS reaction), which, in turn, is isomerized to D-fructose 6-phosphate by D-arabino-hex-3-ulose 6-phosphate isomerase, a member of PF01380. This genome neighborhood provides additional evidence members of the detoxifying HUMPS family populate the dark green cluster.
The genome neighborhoods of the proteins in the metanodes in eight clusters (pink, bright green, ivory, grey, pink, ivory, magenta, olive green, and cyan) include members of PF00156 (phosphoribosyltransferases)—those in the pink, bright green, ivory, and grey clusters have “Reviewed” SwissProt status. In the pathway for synthesis of pyrimidine nucleotides, the formation of OMP from orotate and 5-phospho-D-ribosyl-1-pyrophosphate (PRPP) is catalyzed by orotate phosphoribosyltransferase. This genome neighborhood provides additional evidence that members of the OMPDC family populate these clusters.
h. Conclusions from Using Option B
SSNs allow the dissection of sequence-function space in protein families into isofunctional clusters. Although the OMP decarboxylase superfamily (PF00215) is a family of modest size (#593 in the 14,831 Pfam entries), the same approach can be used for larger families.
Our analysis indicates that the OMPDC function is associated with multiple clusters. Because phylogeny often influences sequence divergence without affecting function, the same function can be associated with multiple clusters in a family. For example, archaeal sequences are located in the ivory, blue, and green clusters, and bacterial sequences are located in the pink, ivory, and grey clusters. The pink cluster contains both bacterial and eukaryotic sequences that segregate as the alignment score lower limit is increased to 70. The node attributes included with SSNs include the levels of taxonomic classification to facilitate interpretation of the segregation of protein families as the alignment score is increased (Table 1).
Although this analysis was simplified by the choice of an alignment score lower limit (35) that separated the SSN into isofunctional clusters, in practice SwissProt curations are used to guide the filtering of SSNs by incrementally increasing the alignment score until different functions are segregated into separate clusters. Additionally, the user can generate a custom node attribute with more recent or detailed functional annotations than those that may be available from SwissProt to facilitate the choice of the alignment score that results in segregation of different functions (instructions are provided in the EFI-EST tutorial for adding node attributes to an SSN generated by EFI-EST). The choice of 35 as the lower limit for the alignment score in this example (35% sequence identity) was required to separate the ivory, green, and blue OMPDC clusters as well as the orange KGPDC cluster, green HUMPS cluster, and red bifunctional HUMPS/FAE cluster (compare panels E and F in Figure 3). The alignment scores that separate protein families into isofunctional clusters must be determined empirically; unfortunately, the dependence of functional divergence on sequence divergence is not uniform across protein families.
g. Option A: Exploring Local Sequence-function Space
Option A (Figure 3) is used to generate SSNs for up to 5,000 of the most similar sequences to a user-specified query sequence. The user may find Option A useful for 1) exploring a subset of the sequence-function space for a larger family; or 2) mining novel protein families from UniProt that are not members of curated Pfam and InterPro families (83.4% of the sequences are integrated into at least one InterPro domain/family/site and 89.1% of the sequences are associated with a signature from at least one of the eleven component databases). This section provides an example of the first application; members of the community may encounter examples of the second application in their studies.
With sequence-function space for the entire OMPDC superfamily defined using Option B, several sequences will be used as queries for Option A to illustrate how subsets of structure/function space in PF00215 can be explored. The queries (Table 2) include MtOMPDC that was used to query InterProScan (Figure 6) as well as the OMP decarboxylases from Bacillus subtilis strain 168 (BsOMPDC, UniProt accession P25971), Escherichia coli strain K12 (EcOMPDC, UniProt accession P08244), and Saccharomyces cerevisiae ATCC 204503 (ScOMPDC, UniProt accession P03962).
The 80% rep node SSNs obtained for the four OMPDC queries are displayed in Figure 16, again using a minimum alignment score of 35 and a minimum length of 190 residues (the same parameters used in the Option B analysis). Using either BsOMPDC or EcOMPDC as queries, the sequences are in the same isofunctional family as the query (bright green cluster in the Option B SSN). Using either MtOMPDC or ScOMPDC, some of the sequences are located in other OMPDC subfamilies as well as the functionally distinct HUMPS and KGPDC families. The sequences and families identified by the queries are determined by the sequence divergence associated with functional divergence.
Figure 16.
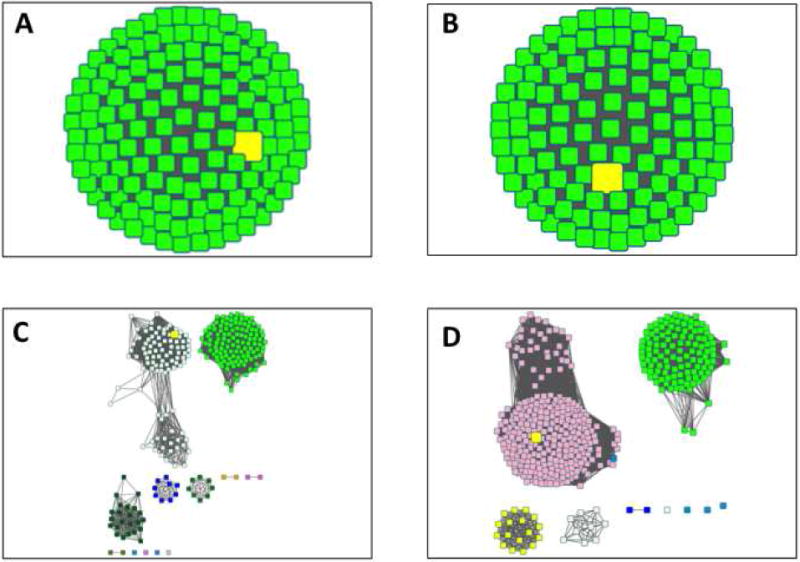
Option A networks (80% rep node networks, minimum alignment score 35, minimum length 190 residues). Panel A, BsOMPDC query. Panel B, EcOMPDC query. Panel C, MtOMPDC query. Panel D, ScOMPDC query. The metanodes with the query sequences are highlighted in yellow.
In Option B, the bright green cluster for bacterial OMPDCs contains 15,246 sequences. The Option A SSN for BsOMPDC includes 5,000 sequences from this cluster (no fragments were collected); the Option A SSN for EcOMPDC includes 4,997 sequences (3 of the 5,000 were removed because they were fragments). The sequences collected by BsOMPDC and EcOMPDC are mutually exclusive (non-overlapping); because BsOMPDC and EcOMPDC share only ~42% sequence identity they are sufficiently divergent to identify distinct sequence sets with no overlap. BsOMPDC retrieves homologous sequences that share >53% sequence identity; EcOMPDC retrieves homologous sequences that share > 55% sequence identity. Thus, Option A allows the user to identify and collect only the sequences that are most similar to a query sequence.
The MtOMPDC (Figure 16C) and ScOMPDC (Figure 16D) queries identify sequences in multiple Option B clusters. MtOMPDC identifies the full complement of 5,000 sequences (4,990 sequences after filtering to remove ten fragments), including all of the sequences in the ivory cluster that includes MtOMPDC as well as sequences in the bright green, green and blue OMPDC clusters as well as in the dark green HUMPS cluster and the orange KGPDC cluster. This occurs because the sequence of MtOMPDC is more similar to the HUMPS and KGPDC sequences than many OMPDC sequences.
ScOMPDC identifies a total of 2,042 sequences (no fragments) in the pink cluster that includes ScOMPDC as well as sequences in the bright green, yellow, ivory, and blue OMPDC clusters. ScOMPDC does not identify all of the sequences in the pink cluster—this is explained by the divergence of the ScOMPDC sequence from many of the OMPDCs in this cluster. Remember that nodes in the pink cluster are connected by edges if the pair-wise alignment score is ≥35; however, many of the node pairs in the cluster have pair-wise alignment scores <35, so they are not connected by edges. ScOMPDC shares greater pair-wise sequence identity (a larger alignment score) with sequences in the bright green, yellow, ivory, and blue OMPDC clusters than with sequences in the pink cluster in which it is located.
9. Summary
Assignment of in vitro enzymatic activities and in vivo metabolic (physiological) functions to uncharacterized enzymes discovered in genome projects is a major challenge confronting many segments of the biological community. The identification of isofunctional clusters is the first step in exploring sequence-function space in enzyme families and devising strategies to determine the functions in unexplored space.
This review describes the use of the EFI-EST web tool to facilitate analysis of sequence-function space in enzyme families using SSNs. Although trees and dendrograms have long been used to describe sequence relationships in enzyme families, their interpretation is often confusing. Although the construction of SSNs are based on sequence similarities described by BLAST bit-scores instead of more rigorous sequence alignments, experience has shown that SSNs provide a visually useful alternative that facilitates the design of experiments to experimentally investigate and assign in vitro enzymatic functions (Table 3). Prior to the creation of the EFI-EST web tool, SSNs have not been generally accessible to the community. Now with EFI-EST, anyone can easily generate SSNs and use the node attribute information provided with them to analyze sequence-function space in protein families.
The functionally diverse OMP decarboxylase superfamily was chosen to illustrate EFI-EST because only the members catalyze one of only three reactions, OMPDC, HUMPS, and KGPDC, thereby simplifying a description of the strategy used to segregate sequence-function space into isofunctional cluster. Option B was used to survey sequence-function space in the entire superfamily; option A was used to survey sequence-function space proximal to user-supplied sequences. A similar approach can be used to analyze sequence-function space in more complicated families that include uncharacterized functions.
We invite members of the community to use EFI-EST and encourage feedback. We encourage feedback. While positive feedback certainly will be appreciated, we also are very interested in suggestions for improving EFI-EST. A link is provided at the bottom of each EFI-EST page for submitting requests for assistance and providing suggestions and comments.
Supplementary Material
Acknowledgments
This work was supported by NIH U54GM093342. The authors acknowledge Gabriel Horton (UIUC) for web design and thank the HPCBio group (UIUC) and Drs. Suwen Zhao (UCSF), Matthew P. Jacobson (UCSF), Michael Carter (UIUC), and Brian San Francisco (UIUC) for helpful discussions.
Footnotes
Publisher's Disclaimer: This is a PDF file of an unedited manuscript that has been accepted for publication. As a service to our customers we are providing this early version of the manuscript. The manuscript will undergo copyediting, typesetting, and review of the resulting proof before it is published in its final citable form. Please note that during the production process errors may be discovered which could affect the content, and all legal disclaimers that apply to the journal pertain.
Supplementary Information
Cytoscape network files (.cys) and high resolution network images (.png) are provided in the supplementary information.
References
- 1.Schnoes AM, Brown SD, Dodevski I, Babbitt PC. Annotation error in public databases: misannotation of molecular function in enzyme superfamilies. PLoS Comput Biol. 2009;5:e1000605. doi: 10.1371/journal.pcbi.1000605. [DOI] [PMC free article] [PubMed] [Google Scholar]
- 2.Caspi R, Altman T, Billington R, Dreher K, Foerster H, Fulcher CA, Holland TA, Keseler IM, Kothari A, Kubo A, Krummenacker M, Latendresse M, Mueller LA, Ong Q, Paley S, Subhraveti P, Weaver DS, Weerasinghe D, Zhang P, Karp PD. The MetaCyc database of metabolic pathways and enzymes and the BioCyc collection of Pathway/Genome Databases. Nucleic Acids Res. 2014;42:D459–71. doi: 10.1093/nar/gkt1103. [DOI] [PMC free article] [PubMed] [Google Scholar]
- 3.C. UniProt. UniProt: a hub for protein information. Nucleic Acids Res. 2015;43:D204–12. doi: 10.1093/nar/gku989. [DOI] [PMC free article] [PubMed] [Google Scholar]
- 4.Zhao S, Sakai A, Zhang X, Vetting MW, Kumar R, Hillerich B, San Francisco B, Solbiati J, Steves A, Brown S, Akiva E, Barber A, Seidel RD, Babbitt PC, Almo SC, Gerlt JA, Jacobson MP. Prediction and characterization of enzymatic activities guided by sequence similarity and genome neighborhood networks. Elife. 2014:3. doi: 10.7554/eLife.03275. [DOI] [PMC free article] [PubMed] [Google Scholar]
- 5.Hermann JC, Ghanem E, Li Y, Raushel FM, Irwin JJ, Shoichet BK. Predicting substrates by docking high-energy intermediates to enzyme structures. J Am Chem Soc. 2006;128:15882–91. doi: 10.1021/ja065860f. [DOI] [PubMed] [Google Scholar]
- 6.Song L, Kalyanaraman C, Fedorov AA, Fedorov EV, Glasner ME, Brown S, Imker HJ, Babbitt PC, Almo SC, Jacobson MP, Gerlt JA. Prediction and assignment of function for a divergent N-succinyl amino acid racemase. Nat Chem Biol. 2007;3:486–91. doi: 10.1038/nchembio.2007.11. [DOI] [PubMed] [Google Scholar]
- 7.Kalyanaraman C, Jacobson MP. Studying enzyme-substrate specificity in silico: a case study of the Escherichia coli glycolysis pathway. Biochemistry. 2010;49:4003–5. doi: 10.1021/bi100445g. [DOI] [PMC free article] [PubMed] [Google Scholar]
- 8.Zhao S, Kumar R, Sakai A, Vetting MW, Wood BM, Brown S, Bonanno JB, Hillerich BS, Seidel RD, Babbitt PC, Almo SC, Sweedler JV, Gerlt JA, Cronan JE, Jacobson MP. Discovery of new enzymes and metabolic pathways by using structure and genome context. Nature. 2013;502:698–702. doi: 10.1038/nature12576. [DOI] [PMC free article] [PubMed] [Google Scholar]
- 9.Gerlt JA, Allen KN, Almo SC, Armstrong RN, Babbitt PC, Cronan JE, Dunaway-Mariano D, Imker HJ, Jacobson MP, Minor W, Poulter CD, Raushel FM, Sali A, Shoichet BK, Sweedler JV. The Enzyme Function Initiative. Biochemistry. 2011;50:9950–62. doi: 10.1021/bi201312u. [DOI] [PMC free article] [PubMed] [Google Scholar]
- 10.Finn RD, Bateman A, Clements J, Coggill P, Eberhardt RY, Eddy SR, Heger A, Hetherington K, Holm L, Mistry J, Sonnhammer EL, Tate J, Punta M. Pfam: the protein families database. Nucleic Acids Res. 2014;42:D222–30. doi: 10.1093/nar/gkt1223. [DOI] [PMC free article] [PubMed] [Google Scholar]
- 11.Tian W, Skolnick J. How well is enzyme function conserved as a function of pairwise sequence identity? J Mol Biol. 2003;333:863–82. doi: 10.1016/j.jmb.2003.08.057. [DOI] [PubMed] [Google Scholar]
- 12.Atkinson HJ, Morris JH, Ferrin TE, Babbitt PC. Using sequence similarity networks for visualization of relationships across diverse protein superfamilies. PLoS One. 2009;4:e4345. doi: 10.1371/journal.pone.0004345. [DOI] [PMC free article] [PubMed] [Google Scholar]
- 13.Peterhoff D, Beer B, Rajendran C, Kumpula EP, Kapetaniou E, Guldan H, Wierenga RK, Sterner R, Babinger P. A comprehensive analysis of the geranylgeranylglyceryl phosphate synthase enzyme family identifies novel members and reveals mechanisms of substrate specificity and quaternary structure organization. Mol Microbiol. 2014;92:885–99. doi: 10.1111/mmi.12596. [DOI] [PubMed] [Google Scholar]
- 14.Dunbar KL, Chekan JR, Cox CL, Burkhart BJ, Nair SK, Mitchell DA. Discovery of a new ATP-binding motif involved in peptidic azoline biosynthesis. Nat Chem Biol. 2014;10:823–9. doi: 10.1038/nchembio.1608. [DOI] [PMC free article] [PubMed] [Google Scholar]
- 15.Ortega MA, Hao Y, Zhang Q, Walker MC, van der Donk WA, Nair SK. Structure and mechanism of the tRNA-dependent lantibiotic dehydratase NisB. Nature. 2015;517:509–12. doi: 10.1038/nature13888. [DOI] [PMC free article] [PubMed] [Google Scholar]
- 16.Vetting MW, Al-Obaidi N, Zhao S, San Francisco B, Kim J, Wichelecki DJ, Bouvier JT, Solbiati JO, Vu H, Zhang X, Rodionov DA, Love JD, Hillerich BS, Seidel RD, Quinn RJ, Osterman AL, Cronan JE, Jacobson MP, Gerlt JA, Almo SC. Experimental Strategies for Functional Annotation and Metabolism Discovery: Targeted Screening of Solute Binding Proteins and Unbiased Panning of Metabolomes. Biochemistry. 2015 doi: 10.1021/bi501388y. [DOI] [PMC free article] [PubMed] [Google Scholar]
- 17.Akiva E, Brown S, Almonacid DE, Barber AE, 2nd, Custer AF, Hicks MA, Huang CC, Lauck F, Mashiyama ST, Meng EC, Mischel D, Morris JH, Ojha S, Schnoes AM, Stryke D, Yunes JM, Ferrin TE, Holliday GL, Babbitt PC. The Structure-Function Linkage Database. Nucleic Acids Res. 2014;42:D521–30. doi: 10.1093/nar/gkt1130. [DOI] [PMC free article] [PubMed] [Google Scholar]
- 18.Mitchell A, Chang HY, Daugherty L, Fraser M, Hunter S, Lopez R, McAnulla C, McMenamin C, Nuka G, Pesseat S, Sangrador-Vegas A, Scheremetjew M, Rato C, Yong SY, Bateman A, Punta M, Attwood TK, Sigrist CJ, Redaschi N, Rivoire C, Xenarios I, Kahn D, Guyot D, Bork P, Letunic I, Gough J, Oates M, Haft D, Huang H, Natale DA, Wu CH, Orengo C, Sillitoe I, Mi H, Thomas PD, Finn RD. The InterPro protein families database: the classification resource after 15 years. Nucleic Acids Res. 2015;43:D213–21. doi: 10.1093/nar/gku1243. [DOI] [PMC free article] [PubMed] [Google Scholar]
- 19.Barber AE, 2nd, Babbitt PC. Pythoscape: a framework for generation of large protein similarity networks. Bioinformatics. 2012;28:2845–6. doi: 10.1093/bioinformatics/bts532. [DOI] [PMC free article] [PubMed] [Google Scholar]
- 20.Zhang X, Kumar R, Vetting MW, Zhao S, Jacobson MP, Almo SC, Gerlt JA. A Unique cis-3-Hydroxy-l-proline Dehydratase in the Enolase Superfamily. J Am Chem Soc. 2015 doi: 10.1021/ja5103986. [DOI] [PubMed] [Google Scholar]
- 21.Schmidt DM, Mundorff EC, Dojka M, Bermudez E, Ness JE, Govindarajan S, Babbitt PC, Minshull J, Gerlt JA. Evolutionary potential of (beta/alpha)8-barrels: functional promiscuity produced by single substitutions in the enolase superfamily. Biochemistry. 2003;42:8387–93. doi: 10.1021/bi034769a. [DOI] [PubMed] [Google Scholar]
- 22.Li W, Godzik A. Cd-hit: a fast program for clustering and comparing large sets of protein or nucleotide sequences. Bioinformatics. 2006;22:1658–9. doi: 10.1093/bioinformatics/btl158. [DOI] [PubMed] [Google Scholar]
- 23.Benson DA, Clark K, Karsch-Mizrachi I, Lipman DJ, Ostell J, Sayers EW. GenBank. Nucleic Acids Res. 2015;43:D30–5. doi: 10.1093/nar/gku1216. [DOI] [PMC free article] [PubMed] [Google Scholar]
- 24.Yew WS, Gerlt JA. Utilization of L-ascorbate by Escherichia coli K-12: assignments of functions to products of the yjf-sga and yia-sgb operons. J Bacteriol. 2002;184:302–6. doi: 10.1128/JB.184.1.302-306.2002. [DOI] [PMC free article] [PubMed] [Google Scholar]
- 25.Mitsui R, Sakai Y, Yasueda H, Kato N. A novel operon encoding formaldehyde fixation: the ribulose monophosphate pathway in the gram-positive facultative methylotrophic bacterium Mycobacterium gastri MB19. J Bacteriol. 2000;182:944–8. doi: 10.1128/jb.182.4.944-948.2000. [DOI] [PMC free article] [PubMed] [Google Scholar]
- 26.Orita I, Sato T, Yurimoto H, Kato N, Atomi H, Imanaka T, Sakai Y. The ribulose monophosphate pathway substitutes for the missing pentose phosphate pathway in the archaeon Thermococcus kodakaraensis. J Bacteriol. 2006;188:4698–704. doi: 10.1128/JB.00492-06. [DOI] [PMC free article] [PubMed] [Google Scholar]
- 27.Amyes TL, Wood BM, Chan K, Gerlt JA, Richard JP. Formation and stability of a vinyl carbanion at the active site of orotidine 5′-monophosphate decarboxylase: pKa of the C-6 proton of enzyme-bound UMP. J Am Chem Soc. 2008;130:1574–5. doi: 10.1021/ja710384t. [DOI] [PMC free article] [PubMed] [Google Scholar]
- 28.Desai BJ, Goto Y, Cembran A, Fedorov AA, Almo SC, Gao J, Suga H, Gerlt JA. Investigating the role of a backbone to substrate hydrogen bond in OMP decarboxylase using a site-specific amide to ester substitution. Proc Natl Acad Sci U S A. 2014;111:15066–71. doi: 10.1073/pnas.1411772111. [DOI] [PMC free article] [PubMed] [Google Scholar]
- 29.Wise E, Yew WS, Babbitt PC, Gerlt JA, Rayment I. Homologous (beta/alpha)8-barrel enzymes that catalyze unrelated reactions: orotidine 5′-monophosphate decarboxylase and 3-keto-L-gulonate 6-phosphate decarboxylase. Biochemistry. 2002;41:3861–9. doi: 10.1021/bi012174e. [DOI] [PubMed] [Google Scholar]
- 30.Yew WS, Wise EL, Rayment I, Gerlt JA. Evolution of enzymatic activities in the orotidine 5′-monophosphate decarboxylase suprafamily: mechanistic evidence for a proton relay system in the active site of 3-keto-L-gulonate 6-phosphate decarboxylase. Biochemistry. 2004;43:6427–37. doi: 10.1021/bi049741t. [DOI] [PubMed] [Google Scholar]
- 31.Wise EL, Yew WS, Gerlt JA, Rayment I. Evolution of enzymatic activities in the orotidine 5′-monophosphate decarboxylase suprafamily: crystallographic evidence for a proton relay system in the active site of 3-keto-L-gulonate 6-phosphate decarboxylase. Biochemistry. 2004;43:6438–46. doi: 10.1021/bi0497392. [DOI] [PubMed] [Google Scholar]
- 32.Yew WS, Akana J, Wise EL, Rayment I, Gerlt JA. Evolution of enzymatic activities in the orotidine 5′-monophosphate decarboxylase suprafamily: enhancing the promiscuous D-arabino-hex-3-ulose 6-phosphate synthase reaction catalyzed by 3-keto-L-gulonate 6-phosphate decarboxylase. Biochemistry. 2005;44:1807–15. doi: 10.1021/bi047815v. [DOI] [PubMed] [Google Scholar]
- 33.Hobbs ME, Vetting M, Williams HJ, Narindoshvili T, Kebodeaux DM, Hillerich B, Seidel RD, Almo SC, Raushel FM. Discovery of an L-fucono-1,5-lactonase from cog3618 of the amidohydrolase superfamily. Biochemistry. 2013;52:239–53. doi: 10.1021/bi3015554. [DOI] [PMC free article] [PubMed] [Google Scholar]
- 34.Stourman NV, Branch MC, Schaab MR, Harp JM, Ladner JE, Armstrong RN. Structure and function of YghU, a nu-class glutathione transferase related to YfcG from Escherichia coli. Biochemistry. 2011;50:1274–81. doi: 10.1021/bi101861a. [DOI] [PMC free article] [PubMed] [Google Scholar]
- 35.Fan H, Hitchcock DS, Seidel RD, 2nd, Hillerich B, Lin H, Almo SC, Sali A, Shoichet BK, Raushel FM. Assignment of pterin deaminase activity to an enzyme of unknown function guided by homology modeling and docking. J Am Chem Soc. 2013;135:795–803. doi: 10.1021/ja309680b. [DOI] [PMC free article] [PubMed] [Google Scholar]
- 36.Brown SD, Babbitt PC. Inference of functional properties from large-scale analysis of enzyme superfamilies. J Biol Chem. 2012;287:35–42. doi: 10.1074/jbc.R111.283408. [DOI] [PMC free article] [PubMed] [Google Scholar]
- 37.Goble AM, Fan H, Sali A, Raushel FM. Discovery of a cytokinin deaminase. ACS Chem Biol. 2011;6:1036–40. doi: 10.1021/cb200198c. [DOI] [PMC free article] [PubMed] [Google Scholar]
- 38.Ghodge SV, Fedorov AA, Fedorov EV, Hillerich B, Seidel R, Almo SC, Raushel FM. Structural and mechanistic characterization of L-histidinol phosphate phosphatase from the polymerase and histidinol phosphatase family of proteins. Biochemistry. 2013;52:1101–12. doi: 10.1021/bi301496p. [DOI] [PMC free article] [PubMed] [Google Scholar]
- 39.Hicks MA, Barber AE, 2nd, Giddings LA, Caldwell J, O’Connor SE, Babbitt PC. The evolution of function in strictosidine synthase-like proteins. Proteins. 2011;79:3082–98. doi: 10.1002/prot.23135. [DOI] [PMC free article] [PubMed] [Google Scholar]
- 40.Gerlt JA, Babbitt PC, Jacobson MP, Almo SC. Divergent evolution in enolase superfamily: strategies for assigning functions. J Biol Chem. 2012;287:29–34. doi: 10.1074/jbc.R111.240945. [DOI] [PMC free article] [PubMed] [Google Scholar]
- 41.Dong GQ, Calhoun S, Fan H, Kalyanaraman C, Branch MC, Mashiyama ST, London N, Jacobson MP, Babbitt PC, Shoichet BK, Armstrong RN, Sali A. Prediction of substrates for glutathione transferases by covalent docking. J Chem Inf Model. 2014;54:1687–99. doi: 10.1021/ci5001554. [DOI] [PMC free article] [PubMed] [Google Scholar]
- 42.Wallrapp FH, Pan JJ, Ramamoorthy G, Almonacid DE, Hillerich BS, Seidel R, Patskovsky Y, Babbitt PC, Almo SC, Jacobson MP, Poulter CD. Prediction of function for the polyprenyl transferase subgroup in the isoprenoid synthase superfamily. Proc Natl Acad Sci U S A. 2013;110:E1196–202. doi: 10.1073/pnas.1300632110. [DOI] [PMC free article] [PubMed] [Google Scholar]
- 43.Goble AM, Feng Y, Raushel FM, Cronan JE. Discovery of a cAMP deaminase that quenches cyclic AMP-dependent regulation. ACS Chem Biol. 2013;8:2622–9. doi: 10.1021/cb4004628. [DOI] [PMC free article] [PubMed] [Google Scholar]
- 44.Tian BX, Wallrapp FH, Holiday GL, Chow JY, Babbitt PC, Poulter CD, Jacobson MP. Predicting the functions and specificity of triterpenoid synthases: a mechanism-based multi-intermediate docking approach. PLoS Comput Biol. 2014;10:e1003874. doi: 10.1371/journal.pcbi.1003874. [DOI] [PMC free article] [PubMed] [Google Scholar]
- 45.Pandya C, Brown S, Pieper U, Sali A, Dunaway-Mariano D, Babbitt PC, Xia Y, Allen KN. Consequences of domain insertion on sequence-structure divergence in a superfold. Proc Natl Acad Sci U S A. 2013;110:E3381–7. doi: 10.1073/pnas.1305519110. [DOI] [PMC free article] [PubMed] [Google Scholar]
- 46.Cummings JA, Vetting M, Ghodge SV, Xu C, Hillerich B, Seidel RD, Almo SC, Raushel FM. Prospecting for unannotated enzymes: discovery of a 3′,5′-nucleotide bisphosphate phosphatase within the amidohydrolase superfamily. Biochemistry. 2014;53:591–600. doi: 10.1021/bi401640r. [DOI] [PMC free article] [PubMed] [Google Scholar]
- 47.Hitchcock DS, Fan H, Kim J, Vetting M, Hillerich B, Seidel RD, Almo SC, Shoichet BK, Sali A, Raushel FM. Structure-guided discovery of new deaminase enzymes. J Am Chem Soc. 2013;135:13927–33. doi: 10.1021/ja4066078. [DOI] [PMC free article] [PubMed] [Google Scholar]
- 48.Wichelecki DJ, Graff DC, Al-Obaidi N, Almo SC, Gerlt JA. Identification of the in vivo function of the high-efficiency D-mannonate dehydratase in Caulobacter crescentus NA1000 from the enolase superfamily. Biochemistry. 2014;53:4087–9. doi: 10.1021/bi500683x. [DOI] [PMC free article] [PubMed] [Google Scholar]
- 49.Selvadurai K, Wang P, Seimetz J, Huang RH. Archaeal Elp3 catalyzes tRNA wobble uridine modification at C5 via a radical mechanism. Nat Chem Biol. 2014;10:810–2. doi: 10.1038/nchembio.1610. [DOI] [PMC free article] [PubMed] [Google Scholar]
- 50.Mashiyama ST, Malabanan MM, Akiva E, Bhosle R, Branch MC, Hillerich B, Jagessar K, Kim J, Patskovsky Y, Seidel RD, Stead M, Toro R, Vetting MW, Almo SC, Armstrong RN, Babbitt PC. Large-scale determination of sequence, structure, and function relationships in cytosolic glutathione transferases across the biosphere. PLoS Biol. 2014;12:e1001843. doi: 10.1371/journal.pbio.1001843. [DOI] [PMC free article] [PubMed] [Google Scholar]
- 51.Wichelecki DJ, Balthazor BM, Chau AC, Vetting MW, Fedorov AA, Fedorov EV, Lukk T, Patskovsky YV, Stead MB, Hillerich BS, Seidel RD, Almo SC, Gerlt JA. Discovery of function in the enolase superfamily: D-mannonate and d-gluconate dehydratases in the D-mannonate dehydratase subgroup. Biochemistry. 2014;53:2722–31. doi: 10.1021/bi500264p. [DOI] [PMC free article] [PubMed] [Google Scholar]
- 52.Wichelecki DJ, Froese DS, Kopec J, Muniz JR, Yue WW, Gerlt JA. Enzymatic and structural characterization of rTSgamma provides insights into the function of rTSbeta. Biochemistry. 2014;53:2732–8. doi: 10.1021/bi500349e. [DOI] [PMC free article] [PubMed] [Google Scholar]
Associated Data
This section collects any data citations, data availability statements, or supplementary materials included in this article.


