

Abstract
Pharmacokinetics [PKs] and pharmacodynamics [PDs] have always been integral to the design of rational drug dosing regimens. Early on PK-driven approaches came under the auspices of therapeutic drug monitoring that progressed into population-based PK and PK/PD modeling analyses. Since the availability of tissue samples for measurement of drug concentrations is limited in patients, the bulk of such model-based methods relied on plasma drug concentrations to both build models and monitor therapy. The continued advances of systems biology and the spawning of systems pharmacology propelled the creation of enhanced PD (ePD) models. A main characteristic of ePD models is that they are derived from mechanistically grounded biochemical reaction networks. These models are commonly represented as systems of coupled ordinary differential equations with the ability to tailor each reaction and protein concentration to an individual’s genomic/proteomic profile. As patient genomic analyses become more common, many genetic and protein abnormalities can be represented in the ePD models, and thus offer a path towards personalized anticancer therapies. By linking PK models to ePD models, a full spectrum of pharmacological simulation tools is available to design sophisticated multidrug regimens. However, ePD models are not a panacea and face challenges in model identifiability, scaling and parameter estimation. Nonetheless, as new technologies evolve and are coupled with fresh ideas on model implementation, it is likely that ePD and PK/ePD models will be considered a viable enterprise to customize anticancer drug therapy.
The design of drug dosing schedules entails the rational choice of the drug amount, the frequency of administration and the context in which the drug or drugs are used that considers the specific patient and what other drugs may be co-administered to avoid drug-drug interactions. Systematic approaches to these drug dosage design concerns have been in large part within the domain of pharmaceutical scientists that historically have relied on pharmacokinetic [PK] information, and more recently, pharmacodynamics [PD] data as well. The progression of these approaches is outlined below.
The advent of personalized medicine and the explosion of genomic assays and bioinformatic tools have created a somewhat parallel domain that has led people away from PK/PD-based drug dosing designs. This may be temporary and simply reflect the newness of genomic-centric personalized medicine in which drugs predicted to be effective are identified 1. Whether or not these drugs prove to be active in an individual patient remains to be seen, yet to test those drugs without a PK or PK/PD analyses jeopardizes the likelihood of success. Personalization of drug therapy should not stop at identifying active drugs but be extended to include a pharmacological step; a process in which PK and/or PK/PD analyses are also conducted to specify drug doses, schedules and examination of drug-drug interactions. How these pharmacological approaches can be implemented is discussed below.
The evolution of drug discovery and development paradigms has seen an increasing use of PK/PD-driven modeling and simulation [M&S] to the extent that it is a common component of the drug development machinery and exemplifies the learn and confirm strategy 2. This seemingly independent M&S development fits nicely into personalized medicine that is applied in late clinical trials and post-marketing analyses. Now PK/PD models and specifically network PD models [referred to as enhanced PD or ePD models] can be generated for virtual patients – for example using public databases as the TCGA (https://tcga-data.nci.nih.gov/tcga/) – early in drug development to predict drug performance in a population of patients with defined genomic characteristics. Whether these predictions prove valuable will require new prospective investigations but it is enticing to consider their power. Each virtual patient and associated PK/network PD model could simulate drug effects that could be used to predict both favorable and unfavorable actions. Such simulated results could be categorized by patient and tumor type to provide a drug activity/toxicity profile that could be used to decide if the drug should be moved into clinical trials, and if so, in which patients and at what doses. The convergence of PK/PD, genomic medicine and systems biology ensure a rich milieu of pharmacological research in the years ahead.
Therapeutic Drug Monitoring
The design of drug dosing regimens – drug amount, frequency and duration – based on pharmacokinetic [PK] information has been an integral part of clinical pharmacology since the 1970’s 3, 4. Drugs that have provided the impetus for the rational design of drug dosing have either narrow therapeutic windows – risk of toxicity is high - or the achievement of minimally effective drug concentrations is tantamount to effective therapy. The basis for therapeutic drug monitoring is that drug concentrations, either plasma or target tissue drug concentrations, are related via mathematical functions to drug response and efficacy. Pharmacodynamics [PDs] defines these relationships that vary from simple linear models – an increase in concentration produces a proportional increase in response – to the well-established Sigmoid Emax model 5. Once a PK/PD relationship is established, doses and schedules can be determined through iterative PK/PD model simulations (considered below) or from standard equations to achieve desired drug concentrations or cumulative exposures. For example, assuming a desired plasma drug concentration range or target is known, a simple means to adjust dose is through the use of a steady-state – rate in equals rate out – formula as follows;
where F = oral bioavailability (1 if drug given intravascularly), X0 = dose, τ = dosing interval, CL = total systemic clearance, and Css = the targeted steady-state (or average if a multiple-dose regimen is used) plasma concentration. It can be seen that dose or the dosing interval or both on the left-hand side of the equation can be adjusted to equal the product of drug clearance and the targeted drug concentration on the right-hand side of the equation. The individual patient’s total clearance is determined directly or could be obtained from a population estimate that is adjusted from individual variables. For example, renally excreted drugs like the aminoglycoside antibiotics are dependent on the glomerular filtration rate [GFR], and thus, the patient’s GFR provides a means to individualize clearance from a population estimate, and thus, design a “personalized” dosing regimen 6. There are numerous variations on this theme yet the essential requirements are knowledge of the PK characteristics of the drug – either in the population or individual – and a PK/PD relationship; the latter are mostly based on a simple biomarker or even phenotypic responses. It can be appreciated that drugs given chronically can be monitored by measurement of plasma drug concentrations and dosing regimens adaptively adjusted. In these cases, the term therapeutic drug monitoring applies as patients are continuously monitored – typically plasma drug concentrations – to ensure the dosing schedule achieves the desired concentrations.
Pharmacokinetic-Guided Dosing for Anticancer Drugs
Model-based design of anticancer drug dosing is predicated on the same general ideas as therapeutic drug monitoring; however there are some important differences. Notably, many of the anticancer drugs are general cytotoxics in which dosing is cyclic – about once a month – and limited by dose-dependent hematological toxicity 7, and thus, the condition of steady-state and those associated equations are not applicable. Although non-hematological toxicities, such as kidney or liver, could be the basis for dosage adjustment, haematological toxicity has been most often used as the criteria to set the maximum tolerated dose or MTD. A classic example is the so-called Calvert formula that was developed for carboplatin 8;
where the AUCtarget is the desired unbound plasma area-under-the-curve, and represents the systemic exposure, and GFR = glomerular filtration rate. The selected dose is based on the desired target AUC and is dependent on the patient’s renal function that is the primary route of carboplatin elimination. Underlying this equation is data that defines successful carboplatin exposures and their relationship to thrombocytopenia. Over the years modifications to this have been implemented based on data in different populations and alternate parameter estimation techniques 9. Another example that embodies the essence of PK-guided dosing, and adaptive control, is based on the work of Ratain and co-workers 10. After evaluation of a series of linear and nonlinear regression models, they found that a nonlinear Sigmoid Emax-type model best characterized etoposide-induced depression of white blood cells [WBC] and etoposide plasma concentrations, here measured at 24 hours of a 72 hour continuous infusion. As is common in these analyses, a host of patient covariates are statistically analysed to determine whether they affect the PK or PD. In this case, albumin was a factor. The model was;
where the n and p subscripts refer to the nadir and pretreatment WBC, respectively, ALB = serum albumin concentration and C = the 24-hour etoposide plasma concentration. Another equation, based on PK, related the 24-hour concentration to the dose, and thus, successive cycles of therapy could be dose-adjusted based on measurements from the preceding cycle. Characteristic of these types of analyses are the use of statistical tools, such as training and validation patient datasets and Bayesian inference.
As stated earlier the level of sophistication in dosage regimen design of anticancer drugs has paralleled advances in PK/PD modeling with many studies utilizing population-based PK and PK/PD models. Population-based PK/PD modeling emanated from the desire to account for interpatient variability and to provide a means to incorporate both dense and sparse data – standard in Phase II and III investigations - into a single modeling paradigm 11. NONlinear Mixed-Effects Modeling and the program NONMEM have been at the heart of these efforts, although other population-based programs, such as ADAPT V and Monolix, are often used 12. The typical strategy is to develop a PK or PK/PD model from all the measured plasma drug concentrations without the use of patient covariates, and then using various statistical tools, such as general additive modeling, obtain a model that defines relationships between key PK variables – total clearance is most common – and significant covariates in the form of an algebraic equation 13. The covariates may be categorical or continuous variables and include a wide range of patient variables such as body size to genotype. An example of a PK parameter-covariate relationship comes from a study on topotecan, a topoisomerase I inhibitor that causes dose-dependent myelosuppression 14. Through a standard model building procedure, the typical value of clearance [TVCL] was;
where weight [WT], height [HT], serum creatinine [SCR] and sex [0 for female and 1 for male] were patient-specific covariates that were used to calculate each patients total clearance. The latter could then be used to adjust dose to achieve a desired systemic exposure [i.e. AUC] of topotecan or as was done here used to define a Sigmoid Emax model relating AUC to the absolute neutrophil count [ANC]; the latter was used as a means to set the dose for a targeted degree of ANC suppression. These examples illustrate the primary operating domain for PK/PD analyses in clinical oncology in which the depth of PD analyses was often limited, and since mechanistic modeling was not a primary goal, the stage is set for new approaches that may be applicable to next generation anticancer drugs.
PK Models
As indicated above, PK models or associated drug concentrations can provide the basis to design customized anticancer drug regimens. In the clinical setting, population-based PK models have taken precedence in this approach. Most often the PK model is a classic compartmental model based on measured plasma drug concentrations; however increasing interest in physiologically-based [PB] PK models is due to their mechanistic underpinnings and species-to-species scalability 15. PBPK models are tissue-centric and offer a means to specify tumor drug concentrations, even intracellular drug concentrations 16. This data can be obtained with in vitro cell studies and whole animal studies, typically mice bearing xenografts. In addition to such data-driven approaches to build PBPK models there are significant efforts to build models in silico based on a paucity of experimental data 17. The underlying physiological nature of PBPK models and the use of a drug’s physicochemical attributes facilitates these efforts. The mechanistic nature of PBPK models provides a logical and quite compatible link to network PD or ePD models described below 18, 19. Regardless of the type of PK model, its link to the ePD model provides a unified modelling platform to consider both PK and PD variables in drug regimen design. This modelling paradigm is a powerful tool that is pharmacologically based to assess the intricacies of dose- and time-dependent events that impact the efficacy of drug therapy.
Evolution of Pharmacodynamic Models
Pharmacodynamic models of anticancer drugs, as with other therapeutic categories, have relied on biomarker-based models 20. Typically, a PD biomarker is the drug target protein, such as a kinase, or a singular downstream signalling protein that can be readily measured in patient samples. Unless tumor samples are available – not a routine endeavour – a surrogate cell or circulating tumor cell from blood would be the sample source. This mono-dimensional biomarker mind-set reflected the clinical desire to identify a readily available tool to demonstrate target engagement as a surrogate for drug efficacy. Of course the simplicity and convenience of a biomarker is not disputed, but its value is questioned given the complex nature of drug action, and how efficacy is dependent upon the protein network downstream of the target. Acknowledgement of the complex nature of drug action opens the door to systems-based analyses that are being forged on various fronts. It is important here to distinguish between systems-based methods to personalize drug therapy based on genomic-centric methods versus those that use dynamic models, referred to as enhanced PD or ePD models 18, 19. The genomic-centric methods will analyse patient data from one or many different genomic platforms [i.e. gene expression, RNAseq, exome sequencing, miRNA] to categorize patients into signatures or clusters that can be associated with drug responders or non-responders 21–23. Integration of drug sensitivity data often from in vitro cell sensitivity assays with the patient clusters or molecular signatures provides a pathway to recommend active drugs. The appeal of genomic-centric methods is understandable given the increasing availability of genomic platforms including lower costs and sophisticated bioinformatics techniques to parse the rich data. Another interesting network approach to design combination chemotherapy incorporated different types of data – genetic, proteomic and phenotypic – to demonstrate enhanced drug sensitivity could be obtained by sequencing drugs that caused EGFR inhibition and DNA damage in triple negative breast cancer cells 24. However, neither the genomic-centric nor the latter approaches utilized PK data and thus, specification of drug doses and frequency of administration, not to mention the potential of drug-drug interactions is limited. Nonetheless, as will be presented below, the initiation of personalized drug therapy with genomic analyses serves an important function in ePD methods so it is likely that static genomic and dynamic model-based methods will continue to merge or at least share certain attributes.
Systems-based models of drug action are based on the simple acknowledgment that cellular decisions to live or die are not accurately predicted from just the measurement of target inhibition even when the drug is selective for one receptor 19. Particularly in cancer where patients possess numerous genetic and protein abnormalities that affect cell signalling and terminal decisions of death, a broader systems view of drug action seems prudent. The desirability of a systems pharmacological view of drug action embodied in network or ePD models is counter-balanced by the challenges of building such models, yet the ability to understand how dose-dependent and time-dependent variables influence system behaviour and ultimately phenotypic response is a meritorious objective. As mentioned above the barriers to obtain genomic data from each patient will recede, and thus, both genomic-centric and ePD-based model methods gain momentum to continue efforts to personalize therapy; however the more challenging task for model-based approaches is to obtain multiplex protein measurements. It is enzyme activities and, for example, phosphorylation states of proteins that determine drug response, and are a highly valued – if not essential - asset to define models and estimate model parameters. In lieu of patient-specific protein measurements, a template on how ePD models can be constructed and applied to the design of combination drug dosing regimens has been offered 18. A base population-based biochemical model can be formulated from public databases – like COSMIC and TCGA 25 – and current literature that will likely consist of some protein measurements. At this stage the model may be referred to as a reference or canonical biochemical model of a particular cancer type, for example, brain tumors, that defines the protein-protein interactions in the absence of any drug intervention. The extent of the available protein data will determine the degree to which genomic data is used to set initial protein concentrations. One convention that can be used is predicated upon the following steady-state model of transcription and translation;
where mss, pss = steady-state mRNA and protein levels, respectively, vtc = gene transcription rate, kdm, kdp = degradation rate constants for mRNA and proteins, respectively, and kts = translation rate constant. For example, using RNAseq data to estimate steady-state mRNA levels and previously available 26 degradation and translation rates, the transcription rate and steady-state protein concentration can be calculated. It is appreciated that there can be biases that distort the linearity and quantitative nature of such transcriptomic data, but newer techniques are emerging that may improve such features. The calculated steady-state protein concentration is then set equal to the initial (total, e.g. phosphorylated plus unphosphorylated) concentration of that protein in the biochemical network. Of course, the resulting estimates of protein concentrations are only as good as the rate constant estimates, and those rate constants are certainly cell and tissue-type dependent. Moreover, such a model assumes a linear correlation between mRNA and protein levels, which is now quite well understood to only hold in some but not all cases 27–30, albeit a variety of studies typically report reasonably high correlation (~50–75%). Lack of correlation between mRNA and protein levels is presumably due to translational regulation, which is becoming better understood to play major roles in gene expression 30. More experiments in the cell type or tissue of interest will bring additional certainty to the values of the translational rate constants that are most appropriate for the modelling task at hand. Yet, as discussed above, this requires delving into protein-level measurements, so a cost-benefit analysis is prudent to determine whether such assumptions are reasonable or not given the particular modelling question. A second methodology is then used to set rate constants for biochemical reactions such as phosphorylation (or other post-translational modification), trafficking/transport, dimerization, oligimerization, etc. Here again genomic data are more abundant, but protein data is of course preferred, and in particular, dynamic responses to perturbations. Regardless of the amount or type of data available, an overriding criteria is that the chosen range of values for biochemical network parameters; (i) provide system behaviour consistent with experimentally known characteristics, (ii) are thermodynamically consistent, and (iii) are in the range of physically feasible values (e.g. on rate constants of bimolecular association reactions are not faster than the diffusion limit). Typically, simulations done in the absence and presence of growth factors and other perturbations, calibrated to published data, are needed. Distinctions of the data source are important and can readily be appreciated when one considers the availability of data in cells, preclinical animal models and patients. The canonical biochemical models will likely rely on all sources; cell, animal tumors and patients, and is a limitation that is not easily rectified at the current time. However, being cognizant of the different data sources will permit more rapid model revisions as new relevant data sources become available. Nonetheless, this inherent limitation of different scales of data can be seen as an Achilles heel of ePD modeling that unless the data are obtained from the same source, the models will be hard to define and the associated predictions may be less accurate. Naturally, more measured protein concentrations in the absence and presence of a drug in the pertinent tumor type will be useful to define the model structure and model parameters.
Even with data-driven model building, the size of systems based models causes parameter identifiability problems that have been fittingly referred to as sloppiness by Gutenkunst and coworkers 31. In practical terms this refers to the presence of multiple parameter sets that provide equal predictability of certain model outputs. It is important for the modeling team to appreciate this potential limitation and recommend additional experiments to better refine the system when warranted; however, as these investigators noted, rigorous experiments to constrain the system may not be an efficient use of resources. Another issue relevant to network model building is where do you draw the boundaries [see Figure 1]? Since cell signalling pathways may be viewed as interconnected modules where do you terminate protein reactions or continue to branch to another pathway? Which interconnecting and feedback pathways are needed to maintain model fidelity? These decisions relate to model reduction and it seems that ultimately network PD models will contain both biochemically detailed and semi-empirical components.
Figure 1.

Hypothetical cell signalling pathways that form the basis of an enhanced pharmacodynamic [ePD] model. Each shape is a protein with the rectangles representing receptor tyrosine kinases within 3 parallel and interconnected “units”. The central unit is the drug target pathway. Should the ePD model be confined to the central unit or also include the 2 other units? This idealized network illustrates a potential problem in defining the boundaries of the model.
Given a canonical biochemical model for a particular cancer type it can now be individualized with additional patient data. Without protein measurements in a specific patient and wanting a predictive tool to design chemotherapy, one again relies on genomic data to refine the canonical model into a patient-based model. The same conventions used to generate the initial protein concentrations and reaction rates for the canonical model are now applied using each patient’s genomic data. The resultant patient-based biochemical model can now be used in two distinct manners. First, in lieu of a set of desired drugs, global sensitivity analyses can be completed to identify fragile nodes that can be ranked for druggability. We have used Sobol sensitivity analyses in this context that produces a ranked list of sensitivity coefficients that are manually evaluated for potential drugs 18. PK models for the desired drugs are produced from literature information and linked to the biochemical model creating a PK/ePD model. Knowledge of the drug’s mechanisms of action is essential to modify the biochemical reactions consistent with the inhibitory mechanism. The PK/ePD model can now be used as a simulation tool in different capacities to determine drug therapy. In an agnostic manner, a control algorithm can be applied to the PK/ePD model to derive which drugs, doses and frequency of administration can be used to achieve a desired PD goal; for example, 80% inhibition of selected proteins. To implement this method, the controller has to be supplied with limits of drug doses and ranges for frequency of administration as well as target criteria for optimization. For example, the fractional inhibition of phosphorylated ERK over time could be set as a criterion for drugs acting through the MAPK pathway. The real power of the controller-based approach is when designing multidrug regimens since there can be an unwielding number of design options to assess “manually”. The PK/ePD model can also be used as a simulation tool without using sensitivity analyses if a desired list of drugs is provided. Here drug doses and schedules could either be varied systematically – without the use of the controller - to define treatment regimens based on desired outcomes or defined with the controller strategy.
A number of these ideas have been documented in a recent paper highlighting a general design pipeline for customized chemotherapy using the VEGFR network as an example 18. The design pipeline that incorporated both the Sobol sensitivity analyses and a controller-based algorithm to produce a PK/ePD model output are shown in Figures 2 and 3. The most compelling features of the drug regimens are the non-uniform dosing schedule – no drug is administered daily – and the relatively low doses used to achieve the target 80% inhibition of both pAKT and pERK, two PD criteria. The model was also used to query how common genetic abnormalities, such as loss of PTEN or a PI3K mutation, would influence the multidrug schedules. In each case, the PI3K inhibitor – BKM120 – was not preferentially selected, as would be by a genomic-centric analysis. The controller is able to consider drug toxicity, and in the VEGFR project, total drug doses formed a penalty function that counterbalanced the efficacy component based on pAKT and pERK inhibition. One can imagine more sophisticated toxicity models that could be used in conjunction with target organ models to quantitatively define therapeutic windows as suggested in the cell-type specific PK/PD modeling approach. In general, the controller-based regimens were not intuitive and suggest this type of model-based chemotherapy offers a fresh perspective on dosing regimen design.
Figure 2.
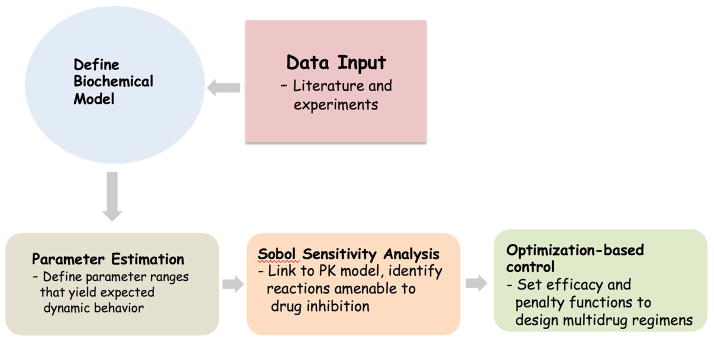
Pipeline to construct and utilize PK/ePD models to design multidrug regimens. The parameter estimation, sensitivity analyses and optimization-based controller steps are distinct computational steps and can be extensive. Modified from reference 18.
Figure 3.
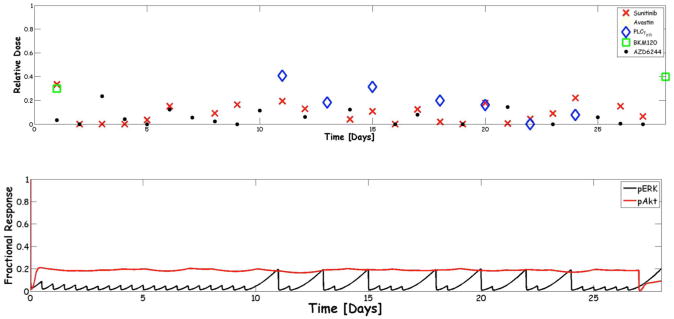
A) Optimization-based control multidrug regimen applied to the VEGFR biochemical pathway for a 28-day cycle. The five drugs available are shown in the legend. A relative dose of 0 is the lowest dose possible and a value of 1 the maximum defined from clinical data. B) The corresponding pERK and pAkt profiles expressed as the fractional response. The profiles show some adulations – particularly for pERK – but both proteins met the 80% inhibition criteria set for the controller. From reference 18.
Conclusion
Drug development and dosage regimen design both benefit from PK/PD analyses and models. There is an increasing reliance on PK/PD to both preserve valuable financial resources and expedite the drug development pipeline. This advantage may be enhanced by the earlier use of PK/ePD models – possibly through the use of virtual patients – that provides a continuum to translate preclinical findings to patients and benefit the decision process. The rational design of anticancer drug regimens has also made use of PK/PD models and will likely grow as more diverse targets and molecularly targeted agents are developed. Both standard PK/PD and newer PK/ePD models can be applied throughout the drug development pipeline and to patient therapy post-approval. Traditional PD models rely on biomarkers whereas ePD models are broader and more detailed. It is premature to favor one modeling technique over the other and unnecessary as each can have complimentary roles. For instance, an initial ePD model may identify key nodes in the system that permit model simplification to a more manageable biomarker type model that can be more readily supported with patient data. At the same time, cancer biology and drug action are sufficiently complex that to capture these processes for each patient may require a mechanistic ePD model. Moreover, since drug combinations are the norm, their interactions may not be fully assessed with simple models. Certainly ePD models will require more data and modeller skill to bring to fruition, and ultimately to gain acceptance by the scientific community. Nonetheless, their mechanistic appeal and integration with systems biology should support a rich scientific conversation on how such models are built and applied to both drug development and dosage regimen design.
Acknowledgments
Dr. Gallo is supported in part by NIH grants CA072937 and CA073728. Dr. Birtwistle is supported by NIH grants GM104184, P50 GM071558 and HG008098, and by an IBM Faculty Award.
Contributor Information
James M. Gallo, Email: james.gallo@mssm.edu, Department of Pharmacology and Systems Therapeutics, Icahn School of Medicine at Mount Sinai, One Gustave L. Levy Place, New York, NY 10029
Marc R. Birtwistle, Email: marc.birtwistle@mssm.edu, Department of Pharmacology and Systems Therapeutics, Icahn School of Medicine at Mount Sinai, One Gustave L. Levy Place, New York, NY 10029
References
- 1.Garnett MJ, Edelman EJ, Heidorn SJ, Greenman CD, Dastur A, Lau KW, Greninger P, Thompson IR, Luo X, Soares J, et al. Systematic identification of genomic markers of drug sensitivity in cancer cells. Nature. 2012;483:570–575. doi: 10.1038/nature11005. [DOI] [PMC free article] [PubMed] [Google Scholar]
- 2.Woodcock J, Woosley R. The FDA critical path initiative and its influence on new drug development. Annu Rev Med. 2008;59:1–12. doi: 10.1146/annurev.med.59.090506.155819. [DOI] [PubMed] [Google Scholar]
- 3.Gibaldi M, Levy G. Pharmacokinetics in clinical practice. 2. Applications. Jama. 1976;235:1987–1992. [PubMed] [Google Scholar]
- 4.Dettli L. Individualization of drug dosage in patients with renal disease. Med Clin North Am. 1974;58:977–985. doi: 10.1016/s0025-7125(16)32094-6. [DOI] [PubMed] [Google Scholar]
- 5.Holford NH, Sheiner LB. Understanding the dose-effect relationship: clinical application of pharmacokinetic-pharmacodynamic models. Clin Pharmacokinet. 1981;6:429–453. doi: 10.2165/00003088-198106060-00002. [DOI] [PubMed] [Google Scholar]
- 6.Lim AK, Mathanasenarajah G, Larmour I. An assessment of aminoglycoside dosing and estimated glomerular filtration rate in determining gentamicin and tobramycin area under the curve and clearance. Intern Med J. 2015 doi: 10.1111/imj.12684. [DOI] [PubMed] [Google Scholar]
- 7.Marangolo M, Bengala C, Conte PF, Danova M, Pronzato P, Rosti G, Sagrada P. Dose and outcome: the hurdle of neutropenia (Review) Oncol Rep. 2006;16:233–248. [PubMed] [Google Scholar]
- 8.Calvert AH, Newell DR, Gumbrell LA, O’Reilly S, Burnell M, Boxall FE, Siddik ZH, Judson IR, Gore ME, Wiltshaw E. Carboplatin dosage: prospective evaluation of a simple formula based on renal function. J Clin Oncol. 1989;7:1748–1756. doi: 10.1200/JCO.1989.7.11.1748. [DOI] [PubMed] [Google Scholar]
- 9.Nagao S, Fujiwara K, Imafuku N, Kagawa R, Kozuka Y, Oda T, Maehata K, Ishikawa H, Koike H, Aotani E, et al. Difference of carboplatin clearance estimated by the Cockroft-Gault, Jelliffe, Modified-Jelliffe, Wright or Chatelut formula. Gynecol Oncol. 2005;99:327–333. doi: 10.1016/j.ygyno.2005.06.003. [DOI] [PubMed] [Google Scholar]
- 10.Mick R, Ratain MJ. Modeling interpatient pharmacodynamic variability of etoposide. J Natl Cancer Inst. 1991;83:1560–1564. doi: 10.1093/jnci/83.21.1560. [DOI] [PubMed] [Google Scholar]
- 11.Beal SL, sheiner LB. Estimating population kinetics. CRC Crit Rev Biomed Eng. 1992;8:195–222. [PubMed] [Google Scholar]
- 12.Bauer RJ, Guzy S, Ng C. A survey of population analysis methods and software for complex pharmacokinetic and pharmacodynamic models with examples. Aaps j. 2007;9:E60–83. doi: 10.1208/aapsj0901007. [DOI] [PMC free article] [PubMed] [Google Scholar]
- 13.Mandema JW, Verotta D, sheiner LB. Building population pharmacokinetic-pharmacodynamic models. I. Models for covariate effects. J Pharmacokin Biopharm. 1992;20:511–528. doi: 10.1007/BF01061469. [DOI] [PubMed] [Google Scholar]
- 14.Gallo JM, Laub PB, Rowinsky EK, Grochow LB, Baker SD. Population pharmacokinetic model for topotecan derived from phase I clinical trials. J Clin Oncol. 2000;18:2459–2467. doi: 10.1200/JCO.2000.18.12.2459. [DOI] [PubMed] [Google Scholar]
- 15.Rowland M, Peck C, Tucker G. Physiologically-based pharmacokinetics in drug development and regulatory science. Annu Rev Pharmacol Toxicol. 2011;51:45–73. doi: 10.1146/annurev-pharmtox-010510-100540. [DOI] [PubMed] [Google Scholar]
- 16.Ballesta A, Zhou Q, Zhang X, Lv H, Gallo JM. Multiscale design of cell-type-specific pharmacokinetic/pharmacodynamic models for personalized medicine: application to temozolomide in brain tumors. CPT Pharmacometrics Syst Pharmacol. 2014;3:e112. doi: 10.1038/psp.2014.9. [DOI] [PMC free article] [PubMed] [Google Scholar]
- 17.Willmann S, Lippert J, Schmitt W. From physicochemistry to absorption and distribution: predictive mechanistic modelling and computational tools. Expert Opin Drug Metab Toxicol. 2005;1:159–168. doi: 10.1517/17425255.1.1.159. [DOI] [PubMed] [Google Scholar]
- 18.Zhang XY, Birtwistle MR, Gallo JM. A General Network Pharmacodynamic Model-Based Design Pipeline for Customized Cancer Therapy Applied to the VEGFR Pathway. CPT Pharmacometrics Syst Pharmacol. 2014;3:e92. doi: 10.1038/psp.2013.65. [DOI] [PMC free article] [PubMed] [Google Scholar]
- 19.Iyengar R, Zhao S, Chung SW, Mager DE, Gallo JM. Merging systems biology with pharmacodynamics. Sci Transl Med. 2012;4:126ps127. doi: 10.1126/scitranslmed.3003563. [DOI] [PMC free article] [PubMed] [Google Scholar]
- 20.Keizer RJ, Schellens JH, Beijnen JH, Huitema AD. Pharmacodynamic biomarkers in model-based drug development in oncology. Curr Clin Pharmacol. 2011;6:30–40. doi: 10.2174/157488411794941368. [DOI] [PubMed] [Google Scholar]
- 21.Linnekamp JF, Wang X, Medema JP, Vermeulen L. Colorectal Cancer Heterogeneity and Targeted Therapy: A Case for Molecular Disease Subtypes. Cancer Res. 2015;75:245–249. doi: 10.1158/0008-5472.CAN-14-2240. [DOI] [PubMed] [Google Scholar]
- 22.Intlekofer AM, Younes A. Precision therapy for lymphoma--current state and future directions. Nat Rev Clin Oncol. 2014;11:585–596. doi: 10.1038/nrclinonc.2014.137. [DOI] [PubMed] [Google Scholar]
- 23.Du W, Elemento O. Cancer systems biology: embracing complexity to develop better anticancer therapeutic strategies. Oncogene. 2014 doi: 10.1038/onc.2014.291. [DOI] [PubMed] [Google Scholar]
- 24.Lee MJ, Ye AS, Gardino AK, Heijink AM, Sorger PK, MacBeath G, Yaffe MB. Sequential application of anticancer drugs enhances cell death by rewiring apoptotic signaling networks. Cell. 2012;149:780–794. doi: 10.1016/j.cell.2012.03.031. [DOI] [PMC free article] [PubMed] [Google Scholar]
- 25.Comprehensive genomic characterization defines human glioblastoma genes and core pathways. Nature. 2008;455:1061–1068. doi: 10.1038/nature07385. [DOI] [PMC free article] [PubMed] [Google Scholar]
- 26.Schwanhausser B, Busse D, Li N, Dittmar G, Schuchhardt J, Wolf J, Chen W, Selbach M. Global quantification of mammalian gene expression control. Nature. 2011;473:337–342. doi: 10.1038/nature10098. [DOI] [PubMed] [Google Scholar]
- 27.Pascal LE, True LD, Campbell DS, Deutsch EW, Risk M, Coleman IM, Eichner LJ, Nelson PS, Liu AY. Correlation of mRNA and protein levels: cell type-specific gene expression of cluster designation antigens in the prostate. BMC Genomics. 2008;9:246. doi: 10.1186/1471-2164-9-246. [DOI] [PMC free article] [PubMed] [Google Scholar]
- 28.Lu P, Vogel C, Wang R, Yao X, Marcotte EM. Absolute protein expression profiling estimates the relative contributions of transcriptional and translational regulation. Nat Biotechnol. 2007;25:117–124. doi: 10.1038/nbt1270. [DOI] [PubMed] [Google Scholar]
- 29.Ingolia NT, Ghaemmaghami S, Newman JR, Weissman JS. Genome-wide analysis in vivo of translation with nucleotide resolution using ribosome profiling. Science. 2009;324:218–223. doi: 10.1126/science.1168978. [DOI] [PMC free article] [PubMed] [Google Scholar]
- 30.Larsson O, Tian B, Sonenberg N. Toward a genome-wide landscape of translational control. Cold Spring Harb Perspect Biol. 2013;5:a012302. doi: 10.1101/cshperspect.a012302. [DOI] [PMC free article] [PubMed] [Google Scholar]
- 31.Gutenkunst RN, Waterfall JJ, Casey FP, Brown KS, Myers CR, Sethna JP. Universally sloppy parameter sensitivities in systems biology models. PLoS Comput Biol. 2007;3:1871–78. doi: 10.1371/journal.pcbi.0030189. [DOI] [PMC free article] [PubMed] [Google Scholar]