

Abstract
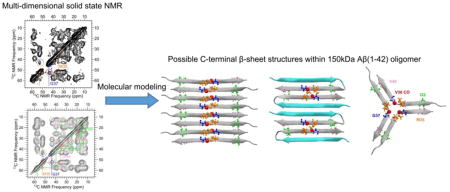
Understanding the molecular structures of amyloid-β (Aβ) oligomers and underlying assembly pathways will advance our understanding of Alzheimer’s disease (AD) at the molecular level. This understanding could contribute to disease prevention, diagnosis, and treatment strategies, as oligomers play a central role in AD pathology. We have recently presented a procedure for production of 150 kDa oligomeric samples of Aβ(1–42) (the 42-residue variant of the Aβ peptide) that are compatible with solid state NMR analysis, and we have shown that these oligomers and amyloid fibrils differ in intermolecular arrangement of β-strands. Here we report new solid state NMR constraints that indicate antiparallel intermolecular alignment of β-strands within the oligomers. Specifically, 150 kDa Aβ(1–42) oligomers with uniform 13C and 15N isotopic labels at I32, M35, G37 and V40 exhibit β-strand secondary chemical shifts in 2D fpRFDR NMR spectra, spatial proximities between I32 and V40 as well as between M35 and G37 in 2D DARR spectra, and close proximity between M35 Hα and G37 Hα in 2D CHHC spectra. Furthermore, 2D DARR analysis of an oligomer sample prepared with 30% labeled peptide indicates that the I32-V40 and M35-G37 contacts are between residues on different molecules. We employ molecular modeling to compare the newly derived experimental constraints with previously proposed geometries for arrangement of Aβ molecules into oligomers.
Keywords: Alzheimer’s β-amyloid, solid state NMR spectroscopy, oligomer
Graphical abstract
INTRODUCTION
While significant genetic, pathological, and biochemical evidence links Alzheimer’s disease (AD) to the self-assembly of the β-amyloid peptide (Aβ), complex self-assembly processes produce a diverse array of aggregated structures. Known aggregated Aβ structures include amyloid fibrils and smaller protofibrillar and oligomeric species associated with higher toxicities.1–7 Analysis of Aβ amyloid fibrils by solid state nuclear magnetic resonance (NMR),8–10 atomic force microscopy,9–12 diffraction based measurements,13–15 hydrogen/deuterium exchange,16 mutagenesis,17 proteolysis18 and electron paramagnetic resonance (EPR),19 has revealed that Aβ self-assembly processes can occur via multiple pathways to produce more than one possible fibril structure. Protocols developed to produce different structurally homogenous fibril samples have made it possible to generate multiple experimentally constrained fibril structural models by solid state NMR.8–10, 20, 21 In contrast, there is no widely accepted structural model for Aβ oligomers.22–25 The existence of oligomers has been documented by size exclusion chromatography (SEC) and sodium dodecyl sulfate (SDS) polyacrylamide gel electrophoresis (SDS-PAGE), but oligomer preparations tend to be structurally heterogeneous.26–30 Oligomers vary in apparent size from 2 to roughly 100 Aβ molecules, tend to be smaller than protofibrils and fibrils, and do not have the elongated aspect ratios or curvilinear appearance of protofibrils.28, 31 A more detailed understanding of Aβ oligomer assembly and structure is likely to be an important step towards a molecular-level understanding of AD pathology, but structural characterization requires structurally homogeneous samples. Here we report further on a 150 kDa Aβ(1–42) oligomer (~30–35 Aβ(1–42) molecules) that is isolated as a stable and homogenous preparation.23 The isolation protocol involves aggregation in dilute SDS and is similar to that used to prepare distinct Aβ oligomers called globulomers.27 Globulomers do not appear to be intermediates leading to fibril formation because globulomers do not readily convert to fibrils and do not accelerate fibril formation when added as potential seeds to initially monomeric Aβ(1–42) solutions.27, 28
The observation of multiple Aβ aggregates raises questions about structural distinctions among oligomers, protofibrils, and fibrils. It is often thought that fibrils are the eventual stable products of Aβ aggregation and that oligomers and protofibrils exist transiently.32 Consequently, different non-fibrillar structures have been argued to be either “on-pathway”33–35 or “off-pathway”28 to fibril formation. Molecules within off-pathway aggregates must dissociate into monomers before eventually being incorporated into fibrils, whereas on-pathway aggregates can convert to fibril structures without dissociation.28, 33, 34 There is general acceptance that protofibrils are on-pathway to fibril formation.28, 31, 32 If globulomers are off-pathway to fibril formation, there must be a significant structural difference that produces an energetic barrier to conversion between the oligomeric and fibrillar structure. At present, multiple distinct Aβ fibril,9, 10, 21 protofibril,34, 36 and oligomer structural models22–24 have been proposed. Composed mostly of β-strands, different structures are distinguished in terms of the exact segments of residues involved in β-strands as well as in the organization of β-strands and β-sheets. The majority of accepted fibril models predict β-sheets composed of in-register parallel β-strands.9, 37 In contrast, studies of protofibrillar and oligomeric samples using Fourier transfer infrared spectroscopy have indicated antiparallel β-sheet structure.38, 39 Scheidt et. al. and Doi et. al. have shown solid state NMR evidence that protofibrils could be composed of molecules that experience intra-molecular hydrogen bonding between distinct β-strands and form antiparallel β-sheets.35, 36 While Scheidt et. al. suggest that oligomers could have similar structure, others including our own group have proposed incompatible oligomer structural models.22–24, 40, 41 More structural knowledge is needed to explain how oligomers differ structurally from protofibrils and fibrils.
We previously reported a solid state NMR structural study on the 150 kDa Aβ(1–42) oligomers which indicates that oligomers are not composed of in-register parallel β-sheets.23 In this contribution, we report new solid state NMR constraints on 150 kDa oligomers of Aβ(1–42). These constraints support the existence of an antiparallel β-sheet formed by residues near the C-terminus. We also present all-atom molecular models which show that the newly derived experimental constraints could be compatible with a subset of previously proposed schemes for arrangement of Aβ molecules into oligomeric structures.
RESULTS
To obtain new residue-specific structural constraints for the 150 kDa Aβ(1–42) oligomers, we prepared two oligomer samples with uniform 13C- and 15N-labeling at selected residues and analyzed these samples using two-dimensional (2D) solid-state NMR spectroscopy. The first sample, designated Sample A, included uniform 13C and 15N at I32, M35, G37 and V40 (see Table 1); we refer to this labeling scheme as IL4. These labeled sites were chosen to test the hypothesis that Aβ(1–42) oligomers are composed of antiparallel β-strands approximately spanning residues 32–40. Evidence for this hypothesis comes from our previous solid-state NMR PITHIRDS-CT experiments on selective 13C-labeled samples where a strong decay was only observed for the V36 carbonyl carbon (CO) labeled site.23 We also conducted an isotopic dilution experiment with Sample B, an oligomer prepared from 30% IL4 monomers and 70% unlabeled Aβ(1–42) monomers.
Table 1.
Isotopic labeling for 150 kDa oligomer samples.
| Aβ(1–42) Oligomer Sample Designation | Isotopic Labeling Scheme |
|---|---|
| A | IL4: uniformly labeled with 13C and 15N at I32, M35, G37 and V40 |
| B | 30% IL4 and 70% unlabeled Aβ(1–42) peptide |
13C NMR chemical shifts are consistent with ordered β-strand structure
The local molecular configurations of Aβ(1–42) oligomers were probed using the 2D fpRFDR solid state NMR technique. This technique creates off-diagonal peaks (cross-peaks) that connect directly bonded 13C atoms (distance of ~0.12nm), enabling spectral assignments and precise measurements of 13C chemical shifts and line widths.42 Fig. 1 is a 2D fpRFDR solid state NMR spectrum of Sample A. Positions of the off-diagonal peaks (chemical shifts) and line widths were determined using nonlinear fitting of cross-peaks to Gaussian functions, and the results are tabulated in Table S1 in the Supplementary Information. The observed 13C NMR line widths indicate a well-defined molecular structure. As we observed previously for the major signals in an identical oligomer preparation with different isotopic labels (denoted IL7),23 secondary NMR chemical shifts for labeled CO, Cα and Cβ sites are consistent with β-strand secondary structure.43 However, in contrast to spectra for IL7 samples, we observed no resolved signals corresponding to minor structures in the present IL4 sample, suggesting a high degree of structural homogeneity.
Fig. 1.

A 2D 13C-13C fpRFDR solid state NMR spectrum of Sample A. The off-diagonal cross-peaks represent single-bond correlations which allow residue-specific assignments within the 13C-labeled residues, as illustrated by colored lines.
2D CHHC indicates an antiparallel β-sheet by identifying close proximity (<0.3 nm) between M35 Hα and G37 Hα
A 2D proton-mediated 13C-13C exchange (CHHC) experiment was used to probe for evidence of antiparallel β-sheets (Fig. 2). In previous studies of amyloid structure with 2D CHHC spectroscopy, a short inter-strand Hα/Hα distance (<0.3 nm) was uniquely attributed to the relative orientation of residues brought in close proximity by antiparallel arrangement of adjacent β-strands. This proximity was detected via cross-peaks between non-sequential Cα atoms.20, 21 The 2D CHHC spectrum of Sample A in Fig. 2 shows a cross-peak between M35 Cα and G37 Cα, revealing that the corresponding Hα atoms are brought into close proximities by antiparallel β-sheets. For an antiparallel β-sheet, we would also expect a Cα-Cα contact between I32 and V40; however, a cross-peak between these two atoms is not clearly detectable due to their close chemical shifts. Nevertheless, the I32/V40 2D-DARR contacts noted in the following section support the antiparallel β-sheet configuration.
Fig. 2.

(A) The aliphatic region of a 2D CHHC NMR spectrum of Sample A, showing a Cα-Cα cross-peak between M35 and G37 at 200 μs 1H spin diffusion period (colored circles). In the 2D CHHC spectrum, the solid colored lines indicate single-bond exchange pathways or residue-specific assignments for M35 (orange) and G37 (blue) determined from the 2D fpRFDR spectrum in Fig. 1. (B) A horizontal slice of the 2D CHHC spectrum taken at the position of the M35 Cα signal, indicated by the orange dashed line from Panel A (at 52.7ppm), is compared to a horizontal slice of the 2D fpRFDR spectrum in Fig. 1 taken at the position of the G37 Cα signal (43.8 ppm). The blue vertical dashed line with an arrow head indicates polarization transfer between the G37 and M35 Cα atoms.
2D DARR data indicate inter-molecular proximities between I32 and V40 as well as M35 and G37
Close spatial proximities between labeled amino acids were determined using the 2D dipolar assisted rotational resonance (DARR) NMR technique with a 500 ms mixing time. Analysis of the 2D DARR spectrum from Sample A (Fig. 3A and 3B) indicates that I32 is near V40 and M35 is near G37. The observed cross-peaks indicate that at least one pair of 13C atoms on different residues are separated by 0.6 nm or less. Strong intra-residue dipolar couplings between directly bonded 13C atoms within each residue prevent us constraining the relative orientation of I32 and V40. The 2D DARR spectrum from Sample B (Fig. 4A and 4B) shows a significant attenuation of the M35-G37 and I32-V40 cross-peak intensities. This signal attenuation corresponds to the dilution of isotopic labels (oligomer formation with a mixture of labeled and unlabeled peptide) and indicates that the observed NMR contacts are the result of proximity between residues on different molecules.
Fig. 3.

(A) The aliphatic region of a 2D DARR 13C-13C spectrum for Sample A (500 ms mixing time). (B) Comparison of selected horizontal slices from the 2D DARR spectrum and the 2D fpRFDR spectrum (Fig. 1). The 2D DARR spectrum in Panel A shows inter-side-chain cross-peaks (correlations between atoms separated by up to ~0.6 nm) that indicate proximities between I32 and V40 and between M35 and G37. The solid colored lines in Panel A indicate single-bond exchange pathways or residue-specific assignments for V40 (pink), I32 (green), M35 (orange), and G37 (blue) identified using the 2D fpRFDR spectrum (Fig. 1). The colored circles indicate inter-residue cross-peaks, with specific residues indicated by the colors of the semicircles. The horizontal slices are at positions indicated by dashed lines in Panel A (V40 Cγ slice at 19.4 ppm, pink; M35 Cα slice at 52.7 ppm, orange) and the 2D fpRFDR spectrum (green slices at the Cβ and Cγ peak positions of I32 and the blue slice at the Cα peak position of G37). The vertical dashed lines with arrowheads in Panel B indicate polarization transfers between I32 and V40 aliphatic carbons as well as the transfers between M35 and G37 aliphatic carbons.
Fig. 4.

(A) Overlaid aliphatic regions of 2D DARR NMR spectra (500 ms mixing time) showing the effect of isotopic dilution. Gray and red contours correspond to Samples A and B, respectively, where Sample B was isotopically diluted (Table 1). Inter-residue I32/V40 and M35/G37 cross-peaks that were clearly attenuated upon isotopic dilution are marked with blue dashed boxes and green dashed circles, respectively. (B) Horizontal slices taken at the frequencies marked with dashed lines (V40 Cγ slice: 19.4 ppm; M35 Cβ slice: 52.7 ppm) in Panel A. Loss of inter-residue cross-peak intensities with isotopic dilution (between I32 and V40 and between M35 and G37) is visible for the selected signals marked with vertical dotted lines. Slices in Panel B are scaled to the single bond (intra-residue) cross-peaks present in those slices.
Consistency in peak positions and line shapes for the 2D fpRFDR spectra of Samples A and B confirms the reproducibility of our oligomer sample preparation (see Fig. S1). When we compared peak positions for corresponding signals from Samples A and B, we measured a root mean squared difference in peak position of 0.15 ppm. This amount of deviation is on the order of the error estimates calculated for the peak fits (± 0.1; see Table S1) and less than deviations reported previously between Aβ aggregate samples which were considered structurally similar.44, 45
DISCUSSION
Emerging molecular structural understanding of Aβ aggregation suggests that different structures could be categorized in terms of arrangements of β-strands into β-sheets. This level of organization is defined as tertiary structure in the nomenclature of Tycko, which was established to characterize different fibril structures.8, 37 It is likely that tertiary structure may be central to the distinctions between fibrillar and nonfibrillar Aβ species, and classifications based on tertiary structure could provide a basis for distinguishing different aggregation pathways. For the 150 kDa Aβ(1–42) oligomers that we describe here, solid state NMR data may be summarized in terms of the following constraints: 1) Secondary 13C chemical shifts for CO, Cα, and Cβ signals at several residues are consistent with β-strand secondary structure (see Fig. 1, Table S1, and Reference 23). 2) The 2D-CHHC cross-peak between the M35 Cα and G37 Cα (Fig. 2) uniquely indicates an antiparallel β-sheet arrangement.20 3) Antiparallel tertiary structure is further supported by the 2D DARR contacts between residues I32 and V40 and between residues M35 and G37 (see Fig. 3). 4) Reduction of inter-residue 2D DARR cross-peak intensities upon isotopic dilution (see Fig. 4) eliminates any model that predicts that the inter-residue cross-peaks are due to intramolecular proximities.
It should be noted that one additional solid state NMR constraint is known for 150 kDa oligomers: we previously reported a 2D DARR cross-peak between F19 and A30 and I31 residues.23 Since A30 and I31 are sequential residues and were both isotopically labeled with 13C in the previous study, these residues were magnetically coupled and therefore F19 could have been proximate to either residue (or both). Since the previously observed cross-peak was attenuated by isotopic dilution, it must correspond to residues on different molecules.23 For amyloid fibrils, proximity between these residues is predicted by published models through stacking of parallel β-sheets (quaternary structure).9, 10
Aβ amyloid fibril structures have been studied most extensively and therefore serve as a basis for interpretation of nonfibrillar structural data. The majority of data on Aβ fibrils indicate molecular organization into in-register parallel β-sheets,8, 20 although one example has been reported of fibrils composed of an Aβ(1–40) mutant that forms antiparallel β-sheets.21 The in-register parallel motif predicts that equivalent β-strands on neighboring molecules align to form β-sheets that maximize overlap between like residues.9, 10 Different Aβ fibril structures have been shown to vary in terms of the precise residues involved in the β-strand regions and the quaternary structure.8, 9, 46 The recent model of the fibril formed by the Iowa mutant (D23N) of Aβ(1–40) proposed by Qiang et. al. predicts an antiparallel alignment of β-strands within some β-sheets (antiparallel β-sheets). However, fibrils that contain these antiparallel β-sheets appear to be kinetically and thermodynamically less favored than in-register parallel β-sheet fibrils formed by the same peptide.21 The belief that fibrils are usually composed of in-register parallel β-sheets has prompted the interpretation that oligomers with in-register parallel β-sheet structures are on-pathway.33
Previous structural characterizations of globulomer-like oligomer preparations include reports by Yu et. al. and Gu et. al.22, 47 Yu et. al. analyzed an Aβ(1–42) oligomer species (with an extra M residue on the N-terminus) prepared in 0.2% (7 mM) SDS and then concentrated to 1.5% SDS (52 mM) for the final NMR sample.22 They reported solution state NMR data that are consistent with a dimeric structural unit consisting of a pair of in-register parallel β-strands formed by residues near the C-terminus (L34-V40) extending from a β-hairpin (intramolecular hydrogen bonding between nonequivalent β-strands) formed by antiparallel arrangement of two additional β-strand regions (V18-D23 and K28-G33). This proposed molecular configuration cannot be reconciled with our structural constraints on 150 kDa oligomers because our data clearly indicate antiparallel arrangement between adjacent C-terminal β-strands. The report by Gu et. al., on Aβ(1–42) globulomers presents EPR data indicating 1.15–1.25 nm intermolecular distances between equivalent residues in the vicinity of the C-terminus (G25-V40).47 This constraint was shown to be consistent with antiparallel β-sheet structure, though other possibilities were also considered.47
Looking beyond data on globulomers, other reports on oligomeric Aβ propose antiparallel β-sheet structures. Stroud et. al. prepared Aβ(1–42) fibrillar oligomers and analyzed the structure using X-ray diffraction to predict domain swapped antiparallel β-sheets.40 Gu et. al. reported EPR and X-ray diffraction data on a non-fibrillar aggregate of a GroES-Ubiquitin-Aβ(1–42) fusion protein. They proposed multiple alternative models based on β-hairpin and antiparallel β-sheet structures for the Aβ(29–40) segment.25 The proposed β-hairpin model does not agree with our present experimental data because it predicts C-terminal β-strands (residues 28–42) that are oriented parallel to equivalent strands on neighboring molecules.25 Alternative models presented by Gu et. al. are consistent with an antiparallel β-sheet configuration for the C-terminal β-strand.25 Finally, while the recent model of Ahmed et. al. predicts antiparallel arrangement of β-strands for pentamers prepared at low temperature (4 °C), this model does not predict any hydrogen bonding between β-strands and therefore predicts no β-sheets.
It is important to recognize that our present constraints on 150 kDa oligomers could be consistent with β-hairpin arrangements. Scheidt et. al. proposed a β-hairpin structure for Aβ(1–40) protofibrils stabilized by an antibody-derived fusion protein.35 The structure was reported to include a close proximity of E22 and I31 that is inconsistent with Aβ(1–40) fibril models but consistent with a β-hairpin.35 Another solid state NMR study by Doi et. al. of Aβ(1–42) protofibrils prepared under close-to-physiological conditions indicated a similar β-hairpin structure.36 Sandberg et. al. stabilized β-hairpin structure with an intramolecular disulfide crosslink within an Aβ(1–42) double mutant (A21C/A30C) and showed that this peptide formed oligomers and protofibrils without proceeding to fibril formation.48 Spencer et. al. have reported a X-ray crystal structure for a cyclic peptidomimetic analog of Aβ(17–36), in which twisted β-hairpins are arranged into 3-fold symmetric antiparallel β-strand subunits.41
Fig. 5 proposes models of C-terminal antiparallel β-sheets arranged into symmetries predicted by published models of Aβ nonfibrillar structures that could be consistent with our present experimental constraints. These diagrams are representations of all-atom models for antiparallel β-sheets formed by residues 32–40. We focused our modeling efforts on β-sheets involving residues 32–40 due to lack of sufficient experimental constraints on other residues. To illustrate that all three configurations in Fig. 5 are consistent with our present structural knowledge, atoms subject to experimental constraints are drawn as spheres. These models are based on symmetries of models previously proposed for Aβ oligomers, although previous models either do not predict residue-specific β-strand alignments or predict alignments which differ from those shown in Fig. 5. Fig. 5A shows an antiparallel β-sheet which is composed exclusively of β-strands spanning residues 32–40, aligned such that V36 CO atoms (red spheres) are in close proximity (0.5 nm). The configuration in Fig. 5A is predicted by our previous report23, in which we suggested that each Aβ molecule contributes one β-strand to each of two β-sheets that are stacked to form a single steric zipper, and by Stroud et. al.,40 who envision an open molecular conformation in which domain swapped β-strands within the same molecule are part of different steric zippers. The Fig. 5A configuration is also similar to that of the antiparallel β-sheet for residues 31–35 within the fibril model proposed by Qiang et. al. for the Iowa mutant of Aβ(1–40), although G33 is at the center of the C-terminal β-sheet for the fibril model.21 Fig. 5B depicts an antiparallel β-sheet which is composed of β-hairpins such that the β-sheet includes two distinct β-strands. In this picture, the gray strands are composed of residues 32–40, as in Fig. 5A, and the blue strands represent an N-terminal β-strand. In the absence of experimental constraints, the residues modeled within the turn (28–31) and blue β-strand (14–27) regions of Fig. 5B were chosen arbitrarily. Models with β-hairpins have been proposed by Doi et. al. for Aβ protofibrils 36 and Gu et. al. for Aβ oligomers.25 The three-fold symmetric model in Fig. 5C resembles an arrangement of β-strands formed by Aβ(17–23) within the crystal structure reported by Spencer et. al.41
Fig. 5.

Models for arrangement of β-strands formed by residues 32–40 into antiparallel β-sheets. Ribbons represent β-strands and spheres represent atoms with NMR-derived structural constraints described in the text. In Panels A–C, spheres are color coded by residue as marked in Panel C. The red spheres, for example, represent carbonyl carbon atoms on V36, for which PITHIRDS-CT data indicate a close interatomic proximity.23 A) An antiparallel β-sheet composed only of equivalent β-strands (residues 32–40). B) An antiparallel β-sheet composed of β-hairpins with two nonequivalent β-strands (gray ribbons for residues 32–40 and blue ribbons for a presently unconstrained N-terminal β-strand). C) A three-fold symmetric configuration of antiparallel β-strands. D) An enlarged view of the peptide backbone regions defined by the dashed boxes in Panels (A) and (B) with side chains deleted. Experimentally constrained interatomic distances are indicated by arrows. In Panels D and E, atoms are colored by element (C: black; H: white; N: blue; O: red). (E) An enlarged view of the peptide backbones within the dashed box in Panel C, with constrained inter-atomic distances indicated by arrows.
All of the molecular models in Fig. 5 are consistent with a close spatial proximity between neighboring V36 CO atoms, a constraint that we have previously reported from the observation of a strong PITHIRDS-CT decay of singly 13C-labeled Aβ(1–42) oligomers.23 Relatively weaker PITHIRDS-CT decays were previously observed for samples selectively 13C-labeled at other backbone sites, leading to the suggestion that 150 kDa oligomers are not composed of parallel β-sheets.23 The 0.5–0.6 nm spatial proximity between V36 CO atoms within presently considered models is illustrated with the red spheres in Fig. 5A–5C. Nuclear spin simulations were performed for our previous PITHIRDS-CT experiment using the coordinates of V36 CO atoms predicted by each model in Fig. 5, and we compared these simulations to the experimental V36 CO PITHIRDS-CT data (Fig. S2). Although each geometry corresponds to a slightly different predicted decay, we consider all of the models to be consistent with the experimentally observed PITHIRDS-CT data. Systematic errors between calculated and measured PITHIRDS-CT decays are often observed, in part because, 1) models tend to be “idealized” configurations that do not consider factors such as twisting of β-sheets that could occur in reality, and 2) limited computational power often limits the number of nuclear spins included in PITHIRDS-CT simulations.23, 49 It should be noted that our previous interpretations of PITHIRDS-CT results do not rely primarily on precise agreement with simulations, but rather on comparisons of experimental decays observed for structurally similar samples with different isotopic labels.23, 49, 50
In summary, the present results establish that the C-terminal β-strand is arranged into an antiparallel β-sheet such that the V36 residue is in the closest possible proximity to V36 residues on adjacent molecules. Since Aβ(1–42) is not known to form fibrils with antiparallel β-sheets, this result could represent an aggregation pathway which differs from the fibril formation pathway. These results therefore provide a molecular level basis for arguing that the 150 kDa oligomer is an off-pathway aggregate, and may explain why this oligomer does not accelerate fibril formation when added to Aβ(1–42) monomer solutions. For oligomer models with extended β-sheets, it is not clear what would limit the size of the aggregate. However, limits could be imposed if the β-sheets were twisted in a fashion reminiscent of the antiparallel β-sheet oligomers formed by the 11-residue segment of αB crystallin.51
MATERIALS AND METHODS
Chemicals and Aβ(1–42) Preparations
All chemicals and solvents were obtained from Sigma-Aldrich (St. Louis, MO) and used without further purification. Aβ(1–42) peptide (sequence DAEFRHDSGYEVHHQKLVFFAEDVGSNKGAIIGLMVGGVVIA) uniformly labeled with 13C and 15N at amino acid residues I32, M35, G37 and V40 (denoted IL4) was purchased from the Keck Biotechnology Resource Laboratory (New Haven, CT). The unlabeled Aβ(1–42) peptide was synthesized using standard FMOC solid phase peptide synthesis methods by the Proteomics Core at the Mayo Clinic (Rochester, MN). The HPLC purification step was omitted for the Aβ(1–42) preparations to conserve peptide,28 and the purity of the peptide was determined by MALDI-mass spectrometry to be > 90%. Lyophilized Aβ(1–42) peptides, stored desiccated at −80 °C, were purified by SEC as previously described.23 Briefly, the peptide (5–7 mg) was first dissolved in 400 μL HFIP, dried as a thin film under a gentle stream of nitrogen, and further dried by centrifugal vacuum concentration. The dried film was completely dissolved in 70 μL of 0.5 M NaOH, gently vortexed for 30 sec, and diluted with 935 μL of 20 mM sodium phosphate, pH 7.5 (NaP buffer). Dissolved samples were bath sonicated for 3 min and centrifuged at 18,000 x g for 10 min before the supernatants were applied to a Superdex 75HR 10/30 column (Amersham Pharmacia, Piscataway, NJ) equilibrated with NaP buffer at a flow rate of 0.5 mL/min. Collected fractions were quantified by UV absorbance at 276 nm (with ε = 1450 M−1cm−1).52
Aβ(1–42) Oligomer Preparations for solid state NMR
Aβ oligomers were prepared as previously reported.23 Briefly, aliquots of 100 μM SEC-purified Aβ monomer were incubated overnight at room temperature in 50 mM NaCl and 4 mM SDS to produce initial oligomers that we denote 2–4mers.23 To remove the SDS and reduce the salt concentration, the sample was dialyzed against 20 mM NaP for 48–72 hours and then against 10 mM NaP for an additional 3–4 hours with at least five buffer changes. Evidence of successful removal of SDS is observed in Fig. S3, which shows that 13C NMR signals from SDS were not observed in the NMR spectrum of an unlabeled oligomer sample. Sample quality was monitored and confirmed at each step of the preparation by circular dichroism (CD) and thioflavin T fluorescence. Residual or unconverted monomer was removed by filtering the dialyzed oligomer with an Amicon Ultra 4 centrifugal concentration/filtration device with a MW cutoff of 50 kDa. In order to prepare sufficient amounts for solid state NMR analysis (3–5mg), at least 5 consecutive samples were prepared within 1–2 days. Finally, the preparations were pooled, flash-frozen in a dry ice-acetone bath, immediately lyophilized, and stored at −80 °C until use. For isotopic dilution experiments, an oligomer sample was prepared from a mixture of monomers composed of 30% IL4 and 70% unlabeled Aβ(1–42).
Solid State NMR Spectroscopy
Solid state NMR experiments were performed on a Bruker 11.75 Tesla (500 MHz 1H NMR frequency) solid state NMR system, equipped with an Avance III console and a 2.5 mm magic angle spinning (MAS) NMR probe. Two-dimensional exchange NMR was performed on IL4 (Sample A) and isotopically diluted (Sample B) oligomer samples. During the 2D exchange mixing periods, 13C-13C dipolar couplings eliminated by MAS were reintroduced using the fpRFDR, DARR, or CHHC pulse sequence. Decoupling of 1H using two pulse phase modulation was employed during free evolution and fpRFDR recoupling periods, with a 1H radio frequency field of 110 kHz. Exchange periods during 2D DARR experiments required continuous irradiation for 500 ms with 1H fields with powers corresponding to 16.5 kHz nutation frequencies (equal to the MAS spinning rate). The π pulses on 13C required for fpRFDR recoupling were applied using 37.5 kHz radio frequency fields, so that the pulse durations (13.3 μs) were 1/3 of the rotor period at 25 kHz MAS. The 2D fpRFDR spectrum in Fig. 1 and the 2D DARR spectra in Fig. 3 are each the result of 48 hours of signal averaging. Due to isotopic dilution, increased signal averaging (72 hours) was required for the 2D DARR spectrum of Sample B (see Fig. 4). CHHC spectra were acquired at 10 kHz MAS as previously described20 with 150 μs 13C-1H and 1H-13C cross-polarization periods and a 200 μs 1H-1H spin diffusion period between t1 and t2, and Fig. 2 is the result for 76 hours of signal averaging.
Molecular Modeling
All-atom molecular models were built using the VMD molecular modeling and NAMD molecular dynamics software.53 Initial models were built using linear segments of the Aβ(1–42) peptide, with φ = −180° and ψ = 180°. Aβ(1–42) segments were rotated and translated to desired positions for each candidate structure as a single peptide. Initial candidate structures underwent a brief energy minimization followed by a simulated annealing in implicit solvent with fixed backbone coordinates, where temperatures were increased from 350 K to 1000 K before dropping to 0 K in increments of 5 K with 10 ps simulation time per step. Annealed structures were then energy minimized for 150000 steps at 310 K without fixed backbone coordinates and with artificial hydrogen bonding constraints between β-sheet forming residues.
Supplementary Material
Highlights.
Aβ(1–42) oligomer formation may underpin Alzheimer’s disease pathology.
Solid state NMR data indicate an antiparallel β-sheet within 150 kDa oligomers.
The β-strands involve residues 32–40 with adjacent residues 36 in close proximity.
Molecular models were constructed with previously proposed β-strand organizations.
Acknowledgments
This work was supported by the Alzheimer’s Association (grant NIRG-10-173755 to AKP), the National High Magnetic Field Laboratory User Collaboration Research Grant Program, and the National Institute on Aging of the National Institutes of Health (award number R01AG045703). The content is solely the responsibility of the authors and does not necessarily represent the official views of the National Institutes of Health. A portion of this work was performed at the National High Magnetic Field Laboratory, which is supported by National Science Foundation Cooperative Agreement No. DMR-1157490 and the State of Florida.
ABBREVIATIONS
- Aβ
amyloid-β
- AD
Alzheimer’s disease
- CD
circular dichroism
- DARR
dipolar-assisted rotational resonance
- EPR
electron paramagnetic resonance
- fpRFDR
finite pulse radio frequency driven recoupling
- HFIP
hexafluoroisopropanol
- HPLC
high performance liquid chromatography
- MALDI
matrix-assisted laser desorption/ionization
- MAS
magic angle spinning
- MW
molecular weight
- MWCO
molecular weight cut-off
- NMR
nuclear magnetic resonance
- PAGE
polyacrylamide gel electrophoresis
- SDS
sodium dodecylsulfate
- SEC
size exclusion chromatography
- VMD
Visual Molecular Dynamics
- 2D
2-dimensional
Footnotes
Publisher's Disclaimer: This is a PDF file of an unedited manuscript that has been accepted for publication. As a service to our customers we are providing this early version of the manuscript. The manuscript will undergo copyediting, typesetting, and review of the resulting proof before it is published in its final citable form. Please note that during the production process errors may be discovered which could affect the content, and all legal disclaimers that apply to the journal pertain.
References
- 1.McLean CA, Cherny RA, Fraser FW, Fuller SJ, Smith MJ, Beyreuther K, et al. Soluble pool of Aβ amyloid as a determinant of severity of neurodegeneration in Alzheimer’s disease. Ann Neurol. 1999;46:860–866. doi: 10.1002/1531-8249(199912)46:6<860::aid-ana8>3.0.co;2-m. [DOI] [PubMed] [Google Scholar]
- 2.Shankar GM, Li S, Mehta TH, Garcia-Munoz A, Shepardson NE, Smith I, et al. Amyloid-β protein dimers isolated directly from Alzheimer’s brains impair synaptic plasticity and memory. Nat Med. 2008;14:837–842. doi: 10.1038/nm1782. [DOI] [PMC free article] [PubMed] [Google Scholar]
- 3.Kawarabayashi T, Shoji M, Younkin LH, Lin WL, Dickson DW, Murakami T, et al. Dimeric Amyloid-β protein rapidly accumulates in lipid rafts followed by apolipoprotein E and phosphorylated tau accumulation in the Tg2576 mouse model of Alzheimer’s disease. J Neurosci. 2004;24:3801–3809. doi: 10.1523/JNEUROSCI.5543-03.2004. [DOI] [PMC free article] [PubMed] [Google Scholar]
- 4.Walsh DM, Klyubin I, Fadeeva JV, Cullen WK, Anwyl R, Wolfe MS, et al. Naturally secreted oligomers of Amyloid-β protein potently inhibit hippocampal long-term potentiation in vivo. Nature. 2002;416:535–539. doi: 10.1038/416535a. [DOI] [PubMed] [Google Scholar]
- 5.Lesne S, Koh MT, Kotilinek L, Kayed R, Glabe CG, Yang A, et al. A specific Amyloid-β protein assembly in the brain impairs memory. Nature. 2006;440:352–357. doi: 10.1038/nature04533. [DOI] [PubMed] [Google Scholar]
- 6.Cleary JP, Walsh DM, Hofmeister JJ, Shankar GM, Kuskowski MA, Selkoe DJ, et al. Natural oligomers of the amyloid-protein specifically disrupt cognitive function. Nat Neurosci. 2005;8:79–84. doi: 10.1038/nn1372. [DOI] [PubMed] [Google Scholar]
- 7.Klyubin I, Walsh DM, Lemere CA, Cullen WK, Shanker GM, Betts V, et al. Amyloid-β protein immunotherapy neutralizes Aβ oligomers that disrupt synaptic plasticity in vivo. Nature Med. 2005;11:556–561. doi: 10.1038/nm1234. [DOI] [PubMed] [Google Scholar]
- 8.Petkova AT, Ishii Y, Balbach JJ, Antzutkin ON, Leapman RD, Delaglio F, et al. A structural model for Alzheimer’s β-amyloid fibrils based on experimental constraints from solid state NMR. Proc Natl Acad Sci USA. 2002;99:16742–16747. doi: 10.1073/pnas.262663499. [DOI] [PMC free article] [PubMed] [Google Scholar]
- 9.Petkova AT, Yau WM, Tycko R. Experimental constraints on quaternary structure in Alzheimer’s β-amyloid fibrils. Biochemistry. 2006;45:498–512. doi: 10.1021/bi051952q. [DOI] [PMC free article] [PubMed] [Google Scholar]
- 10.Paravastu AK, Leapman RD, Yau WM, Tycko R. Molecular structural basis for polymorphism in Alzheimer’s β-amyloid fibrils. Proc Natl Acad Sci USA. 2008;105:18349–18354. doi: 10.1073/pnas.0806270105. [DOI] [PMC free article] [PubMed] [Google Scholar]
- 11.Faendrich M, Schmidt M, Grigorieff N. Recent progress in understanding Alzheimer’s β-amyloid structures. Trends Biochem Sci. 2011;36:338–345. doi: 10.1016/j.tibs.2011.02.002. [DOI] [PMC free article] [PubMed] [Google Scholar]
- 12.Arimon M, Diez-Perez I, Kogan MJ, Durany N, Giralt E, Sanz F, et al. Fine structure study of Aβ1–42 fibrillogenesis with atomic force microscopy. FASEB J. 2005;19:1344–1346. doi: 10.1096/fj.04-3137fje. [DOI] [PubMed] [Google Scholar]
- 13.Serpell LC, Smith JM. Direct visualisation of the β-sheet structure of synthetic Alzheimer’s amyloid. J Mol Biol. 2000;299:225–231. doi: 10.1006/jmbi.2000.3650. [DOI] [PubMed] [Google Scholar]
- 14.Serpell LC, Fraser PE, Sunde M. X-ray fiber diffraction of amyloid fibrils. Methods Enzymol. 1999;309:526–536. doi: 10.1016/s0076-6879(99)09036-9. [DOI] [PubMed] [Google Scholar]
- 15.Morris KL, Serpell LC. X-Ray Fibre Diffraction Studies of Amyloid Fibrils. Amyloid Proteins: Methods and Protocols, Second Edition. 2012;849:121–135. doi: 10.1007/978-1-61779-551-0_9. [DOI] [PubMed] [Google Scholar]
- 16.Kheterpal I, Zhou S, Cook KD, Wetzel R. Aβ amyloid fibrils possess a core structure highly resistant to hydrogen exchange. Proc Natl Acad Sci USA. 2000;97:13597–13601. doi: 10.1073/pnas.250288897. [DOI] [PMC free article] [PubMed] [Google Scholar]
- 17.Luhrs T, Ritter C, Adrian M, Riek-Loher D, Bohrmann B, Doeli H, et al. 3D structure of Alzheimer’s amyloid-β(1–42) fibrils. Proc Natl Acad Sci USA. 2005;102:17342–17347. doi: 10.1073/pnas.0506723102. [DOI] [PMC free article] [PubMed] [Google Scholar]
- 18.Kheterpal I, Williams A, Murphy C, Bledsoe B, Wetzel R. Structural features of the Aβ amyloid fibril elucidated by limited proteolysis. Biochemistry. 2001;40:11757–11767. doi: 10.1021/bi010805z. [DOI] [PubMed] [Google Scholar]
- 19.Torok M, Milton S, Kayed R, Wu P, McIntire T, Glabe CG, et al. Structural and dynamic features of Alzheimer’s Aβ peptide in amyloid fibrils studied by site-directed spin labeling. J Biol Chem. 2002;277:40810–40815. doi: 10.1074/jbc.M205659200. [DOI] [PubMed] [Google Scholar]
- 20.Tycko R, Ishii Y. Constraints on supramolecular structure in amyloid fibrils from two-dimensional solid-state NMR spectroscopy with uniform isotopic labeling. J Am Chem Soc. 2003;125:6606–6607. doi: 10.1021/ja0342042. [DOI] [PubMed] [Google Scholar]
- 21.Qiang W, Yau W, Luo Y, Mattson MP, Tycko R. Antiparallel β-sheet architecture in Iowa-mutant β-amyloid fibrils. Proc Natl Acad Sci USA. 2012;109:4443–4448. doi: 10.1073/pnas.1111305109. [DOI] [PMC free article] [PubMed] [Google Scholar]
- 22.Yu L, Edalji R, Harlan JE, Holzman TF, Lopez A, Labkovsky B, et al. Structural characterization of a soluble amyloid β-peptide oligomer. Biochemistry. 2009;48:1870–1877. doi: 10.1021/bi802046n. [DOI] [PubMed] [Google Scholar]
- 23.Tay WM, Huang D, Rosenberry TL, Paravastu AK. The Alzheimer’s Amyloid-β(1–42) Peptide Forms Off-Pathway Oligomers and Fibrils that are Distinguished Structurally by Intermolecular Organization. J Mol Biol. 2013;425:2494–2508. doi: 10.1016/j.jmb.2013.04.003. [DOI] [PMC free article] [PubMed] [Google Scholar]
- 24.Ahmed M, Davis J, Aucoin D, Sato T, Ahuja S, Aimoto S, et al. Structural conversion of neurotoxic amyloid-β1–42 oligomers to fibrils. Nat Struc Mole Biol. 2010;17:561–568. doi: 10.1038/nsmb.1799. [DOI] [PMC free article] [PubMed] [Google Scholar]
- 25.Gu L, Liu C, Stroud JC, Ngo S, Jiang L, Guo Z. Antiparallel Triple-strand Architecture for Prefibrillar Aβ42 Oligomers. J Biol Chem. 2014;289:27300–27313. doi: 10.1074/jbc.M114.569004. [DOI] [PMC free article] [PubMed] [Google Scholar]
- 26.Matsumura S, Shinoda K, Yamada M, Yokojima S, Inoue M, Ohnishi T, et al. Two distinct amyloid β-protein (Aβ) assembly pathways leading to oligomers and fibrils identified by combined fluorescence correlation spectroscopy, morphology, and toxicity analyses. J Biol Chem. 2011;286:11555–11562. doi: 10.1074/jbc.M110.181313. [DOI] [PMC free article] [PubMed] [Google Scholar]
- 27.Barghorn S, Nimmrich V, Striebinger A, Krantz C, Keller P, Janson B, et al. Globular amyloid β-peptide(1–42) oligomer - a homogenous and stable neuropathological protein in Alzheimer’s disease. J Neurochem. 2005;95:834–847. doi: 10.1111/j.1471-4159.2005.03407.x. [DOI] [PubMed] [Google Scholar]
- 28.Rangachari V, Moore BD, Reed DK, Sonoda LK, Bridges AW, Conboy E, et al. Amyloid-β(1–42) rapidly forms protofibrils and oligomers by distinct pathways in low concentrations of sodium dodecylsulfate. Biochemistry. 2007;46:12451–12462. doi: 10.1021/bi701213s. [DOI] [PubMed] [Google Scholar]
- 29.Moore BD, Rangachari V, Tay WM, Milkovic NM, Rosenberry TL. Biophysical analyses of synthetic amyloid-β(1–42) aggregates before and after covalent cross-linking. Implications for deducing the structure of endogenous amyloid-β oligomers. Biochemistry. 2009;48:11796–11806. doi: 10.1021/bi901571t. [DOI] [PubMed] [Google Scholar]
- 30.Lambert MP, Barlow AK, Chromy BA, Edwards C, Freed R, Liosatos M, et al. Diffusible, nonfibrillar ligands derived from Aβ1–42 are potent central nervous system neurotoxins. Proc Natl Acad Sci USA. 1998;95:6448–6453. doi: 10.1073/pnas.95.11.6448. [DOI] [PMC free article] [PubMed] [Google Scholar]
- 31.Kodali R, Wetzel R. Polymorphism in the intermediates and products of amyloid assembly. Curr Opin Struct Biol. 2007;17:48–57. doi: 10.1016/j.sbi.2007.01.007. [DOI] [PubMed] [Google Scholar]
- 32.Roychaudhuri R, Yang M, Hoshi MM, Teplow DB. Amyloid β-protein assembly and Alzheimer disease. J Biol Chem. 2009;284:4749–4753. doi: 10.1074/jbc.R800036200. [DOI] [PMC free article] [PubMed] [Google Scholar]
- 33.Sarkar B, Mithu VS, Chandra B, Mandal A, Chandrakesan M, Bhowmik D, et al. Significant Structural Differences between Transient Amyloid-β Oligomers and Less-Toxic Fibrils in Regions Known To Harbor Familial Alzheimer’s Mutations. Angew Chem Int Ed. 2014;53:6888–6892. doi: 10.1002/anie.201402636. [DOI] [PubMed] [Google Scholar]
- 34.Chimon S, Shaibat MA, Jones CR, Calero DC, Aizezi B, Ishii Y. Evidence of fibril-like β-sheet structures in a neurotoxic amyloid intermediate of Alzheimer’s β-amyloid. Nat Struct Mol Biol. 2007;14:1157–1164. doi: 10.1038/nsmb1345. [DOI] [PubMed] [Google Scholar]
- 35.Scheidt HA, Morgado I, Huster D. Solid-state NMR reveals a close structural relationship between amyloid-β protofibrils and oligomers. J Biol Chem. 2012;287:22822–22826. doi: 10.1074/jbc.M112.367474. [DOI] [PMC free article] [PubMed] [Google Scholar]
- 36.Doi T, Masuda Y, Irie K, Akagi K, Monobe Y, Imazawa T, et al. Solid-state NMR analysis of the β-strand orientation of the protofibrils of amyloid β-protein. Biochem Biophys Res Commun. 2012;428:458–462. doi: 10.1016/j.bbrc.2012.10.096. [DOI] [PubMed] [Google Scholar]
- 37.Paravastu AK, Qahwash I, Leapman RD, Meredith SC, Tycko R. Seeded growth of β-amyloid fibrils from Alzheimer’s brain-derived fibrils produces a distinct fibril structure. Proc Natl Acad Sci USA. 2009;106:7443–7448. doi: 10.1073/pnas.0812033106. [DOI] [PMC free article] [PubMed] [Google Scholar]
- 38.Cerf E, Sarroukh R, Tamamizu-Kato S, Breydo L, Derclaye S, Dufrene YF, et al. Antiparallel β-sheet: a signature structure of the oligomeric amyloid β-peptide. Biochem J. 2009;421:415–423. doi: 10.1042/BJ20090379. [DOI] [PubMed] [Google Scholar]
- 39.Habicht G, Haupt C, Friedrich RP, Hortschansky P, Sachse C, Meinhardt J, et al. Directed selection of a conformational antibody domain that prevents mature amyloid fibril formation by stabilizing Abeta protofibrils. Proc Natl Acad Sci U S A. 2007;104:19232–19237. doi: 10.1073/pnas.0703793104. [DOI] [PMC free article] [PubMed] [Google Scholar]
- 40.Stroud JC, Liu C, Teng PK, Eisenberg D. Toxic fibrillar oligomers of amyloid-β have cross-β structure. Proc Natl Acad Sci USA. 2012;109:7717–7722. doi: 10.1073/pnas.1203193109. [DOI] [PMC free article] [PubMed] [Google Scholar]
- 41.Spencer RK, Li H, Nowick JS. X-ray Crystallographic Structures of Trimers and Higher-Order Oligomeric Assemblies of a Peptide Derived from Aβ. J Am Chem Soc. 2014;136:5595–5598. doi: 10.1021/ja5017409. [DOI] [PMC free article] [PubMed] [Google Scholar]
- 42.Ishii Y. C-13-C-13 dipolar recoupling under very fast magic angle spinning in solid-state nuclear magnetic resonance: Applications to distance measurements, spectral assignments, and high-throughput secondary-structure determination. J Chem Phys. 2001;114:8473–8483. [Google Scholar]
- 43.Wishart DS, Bigam CG, Holm A, Hodges RS, Sykes BD. 1H, 13C and 15N random coil NMR chemical shifts of the common amino acids. I Investigations of nearest-neighbor effects. J Biomol NMR. 1995;5:67–81. doi: 10.1007/BF00227471. [DOI] [PubMed] [Google Scholar]
- 44.Scheidt HA, Morgado I, Rothemund S, Huster D, Fandrich M. Solid-state NMR spectroscopic investigation of Aβ protofibrils: implication of a β-sheet remodeling upon maturation into terminal amyloid fibrils. Angew Chem Int Ed Engl. 2011;50:2837–2840. doi: 10.1002/anie.201007265. [DOI] [PubMed] [Google Scholar]
- 45.Paravastu AK, Petkova AT, Tycko R. Polymorphic fibril formation by residues 10–40 of the Alzheimer’s β-amyloid peptide. Biophys J. 2006;90:4618–4629. doi: 10.1529/biophysj.105.076927. [DOI] [PMC free article] [PubMed] [Google Scholar]
- 46.Petkova AT, Leapman RD, Guo ZH, Yau WM, Mattson MP, Tycko R. Self-propagating, molecular-level polymorphism in Alzheimer’s β-amyloid fibrils. Science. 2005;307:262–265. doi: 10.1126/science.1105850. [DOI] [PubMed] [Google Scholar]
- 47.Gu L, Liu C, Guo Z. Structural Insights into Aβ 42 Oligomers Using Site-directed Spin Labeling. J Biol Chem. 2013;288:18673–18683. doi: 10.1074/jbc.M113.457739. [DOI] [PMC free article] [PubMed] [Google Scholar]
- 48.Sandberg A, Luheshi LM, Sollvander S, Pereira de Barros T, Macao B, Knowles TP, et al. Stabilization of neurotoxic Alzheimer amyloid-beta oligomers by protein engineering. Proc Natl Acad Sci U S A. 2010;107:15595–15600. doi: 10.1073/pnas.1001740107. [DOI] [PMC free article] [PubMed] [Google Scholar]
- 49.Cormier AR, Pang X, Zimmerman MI, Zhou H, Paravastu AK. Molecular Structure of RADA16-I Designer Self-Assembling Peptide Nanofibers. ACS Nano. 2013;7:7562–7572. doi: 10.1021/nn401562f. [DOI] [PMC free article] [PubMed] [Google Scholar]
- 50.Cormier AR, Lopez-Majada JM, Alamo RG, Paravastu AK. Distinct solid and solution state self-assembly pathways of RADA16-I designer peptide. J Pept Sci. 2013;19:477–484. doi: 10.1002/psc.2524. [DOI] [PubMed] [Google Scholar]
- 51.Laganowsky A, Liu C, Sawaya MR, Whitelegge JP, Park J, Zhao M, et al. Atomic view of a toxic amyloid small oligomer. Science. 2012;335:1228–31. doi: 10.1126/science.1213151. [DOI] [PMC free article] [PubMed] [Google Scholar]
- 52.Nichols MR, Moss MA, Reed DK, Lin W, Mukhopadhyay R, Hoh JH, et al. Growth of β-amyloid(1–40) protofibrils by monomer elongation and lateral association. Characterization of distinct products by light scattering and atomic force microscopy. Biochemistry. 2002;41:6115–6127. doi: 10.1021/bi015985r. [DOI] [PubMed] [Google Scholar]
- 53.Nelson M, Humphrey W, Gursoy A, Dalke A, Kale L, Skeel R, et al. NAMD: A parallel, object oriented molecular dynamics program. Int J Supercomput Appl High Perform Comput. 1996;10:251–268. [Google Scholar]
Associated Data
This section collects any data citations, data availability statements, or supplementary materials included in this article.