

Abstract
Oxidative stress is often associated with etiology and/or progression of disease conditions, such as cancer, neurodegenerative diseases, and diabetes. At the cellular level, oxidative stress induces carbonylation of biomolecules such as lipids, proteins and DNA. The presence of carbonylcontaining biomolecules as a hallmark of these diseases provides a suitable target for diagnostic detection. Here, a simple, robust method for detecting cellular aldehydes and ketones in live cells using a fluorophore is presented. A hydrazine-functionalized synthetic fluorophore serves as an efficient nucleophile that rapidly reacts with reactive carbonyls in the cellular milieu. The product thus formed exhibits a wavelength shift in the emission maximum accompanied by an increase in emission intensity. The photochemical characteristics of the fluorophore enable the identification of the fluorophore-conjugated cellular biomolecules in the presence of unreacted dye, eliminating the need for removal of excess fluorophore. Moreover, this fluorophore is found to be non-toxic and is thus appropriate for live cell analysis. Utility of the probe is demonstrated in two cell lines, PC3 and A549. Carbonylation resulting from serum starvation and hydrogen peroxide induced stress is detected in both cell lines using fluorescence microscopy and a fluorescence plate reader. The fluorescent signal originates from carbonylated proteins and lipids but not from oxidized DNA, and the majority of the fluorescence signal (>60%) is attributed to fluorophore-conjugated lipid oxidation products. This method should be useful for detecting cellular carbonylation in a high content assay or high throughput assay format.
Keywords: Oxidative stress, biomolecule carbonylation, live cells, fluorophore, hydrazine, microscopy, plate reader
Introduction
Oxidative stress is a physiological condition that results from imbalance in the pro-oxidant/antioxidant homeostasis. An abnormal increase in oxidants, such as reactive oxygen species (ROS), or insufficient anti-oxidant defense culminates in oxidative stress in the cellular system. This failure of the cells’ buffering system to maintain the redox equilibrium leads to diverse modifications in biomolecules that are a hallmark of disease conditions. Oxidative stress is often associated with the onset and/or progression of cancer [1], neurodegenerative diseases [2], diabetes [3], chronic obstructive pulmonary disease [4] and cardiac complications [5]. These diverse pathophysiological implications of oxidative stress thus make it a valuable target for diagnosis and prognosis of disease states.
Stable irreversibly carbonylated biomolecules such as proteins [6,7,8,9] and lipids [10,11], and, to some extent, DNA [12], serve as biomarkers for oxidative stress. For example, protein carbonylation can directly result from carbonylation of the side chains of amino acids, such as proline, arginine, lysine and threonine [13,14], which may in turn cross-link intracellular proteins. Indirect means of protein modification include addition of oxidized products of carbohydrates or lipids [15,16]. Lipid peroxidation can result in aldehyde-containing products such as 4-hydroxynonenal [17], malondialdehyde, acrolein and heptanal [18]. Aldehydes and ketones from lipid oxidation can subsequently react with proteins and nucleic acids to form covalent adducts that may retain the carbonyl functionality [19]. Hence, a well-accepted approach for evaluating the extent of oxidative stress is to detect the level of modified biomolecules.
Traditionally, cellular carbonyl detection is achieved by using chemical probes such as tritiated sodium borohydride [20,21], which reduces the carbonyls to alcohols, or a hydrazine or hydrazide-containing reagent, which form hydrazones with the target carbonyl. Popular hydrazine/hydrazide methods use reagents, such as 2, 4-dinitrophenylhydrazine (DNPH) [22,23,24,25,26], biotin-linked hydrazides [27] or fluorophore-hydrazides [16,28]. The resulting hydrazone can then be detected by fluorescence [25,28] or by analytical techniques such as enzyme-linked immunosorbent assay [23,29], Western blot [24], or mass spectrometry [27].
The extent and distribution of carbonylated species in fixed cells can be observed by fluorescence microscopy. Cellular carbonyl-containing molecules are first reacted with DNPH and are subsequently visualized by immunochemical analysis with anti-DNP antibodies [25]. Detection of carbonylation products in live cells, however, has not yet been reported. In principle, cell permeable hydrazine or hydrazide-containing fluorophores could be used to covalently attach a fluorophore to carbonylated cellular components. A possible difficulty with this technique is background due to unreacted fluorophore in the cytosol [30] and the slow reaction between hydrazides and aliphatic aldehydes at neutral pH [31].
We have shown previously that reaction of an aromatic hydrazine-containing fluorophore with an aromatic aldehyde occurs at a reasonable rate at neutral pH (∼30 M-1min-1) and that the reaction also occurs within live cells [32]. Moreover, the hydrazone thus formed has absorption and emission spectra that are red shifted relative to the hydrazine and, importantly, a higher quantum yield. The molecule, 4-methyl-7-hydrazinyl coumarin (1, CH), was able to fluorescently label an aromatic aldehyde-containing protein in live cells. We reasoned if CH retained similar behavior with aliphatic aldehydes, then this molecule could be used to detect cellular carbonylation. In this work, we show that CH is suitable for visualizing carbonylation of lipids and proteins in live cells resulting from hydrogen peroxide treatment. Cellular carbonylation due to serum starvation can also be detected using CH by both confocal microscopy and a fluorescent plate reader. This method of detecting carbonylation due to oxidative stress should be applicable for high content screening [33] and forms the basis of a high throughput assay for inducers of intracellular carbonylation.
Materials and Methods
Reagents
Hydrogen peroxide (30%) was purchased from Thermo Scientific. Bovine serum albumin-fraction V (BSA) was purchased from Rockland. Sephadex G-25 fine resin was purchased from GE Healthcare. Fetal bovine serum (FBS) and penicillin-streptomycin were purchased from Atlanta Biologicals. Chloroform was purchased from Spectrum. The remaining chemicals were purchased from Sigma Aldrich unless otherwise stated. Coumarin hydrazine (7-hydrazinyl-4-methyl-2H-chromen-2-one, CH) was synthesized starting with 3-aminophenol as described in Banerjee et al.[32].
Cell culture
Prostate cancer (PC3) cells were purchased from the American Type Culture Collection (ATCC). Lung carcinoma (A549) cells (originally purchased from ATCC) were a gift from Professor Ming An. Cells were grown in F12K medium (ATCC) supplemented with 10% (v/v) FBS and 1% penicillin-streptomycin (standard medium) in a humidified incubator containing 5% CO2 at 37°C. Cells were seeded on 96 well plates (Greiner Bio-One or Corning), 6 well plates (Corning) or Lab-Tek™ II chambered coverglass (Thermo Scientific), and grown for the stated period of time.
Spectroscopy of the fluorophore
Absorption spectra were obtained at room temperature using a Hewlett Packard 8452A Diode Array Spectrophotometer. Emission spectra were recorded at room temperature using a Jobin Yvon Horiba FluoroMax-3 spectrofluorometer. The samples were excited at 405 nm.
Stock solutions of the fluorophore were made fresh by dissolving the solid molecule in 10 mM phosphate buffer, pH 7.0 (PB). An extinction coefficient of ε346 =1.9 x 10⁴ M-1 cm-1 was used to obtain the concentration of the solution. A propanal hydrazone of CH was prepared by mixing large excess of propanal with CH in PB.
Detection of carbonyls in oxidized BSA
Making oxidized BSA
BSA (10 mg/ ml) was dissolved in oxidizing buffer (25 mM HEPES, 25 mM sodium ascorbate, 100 μM FeCl3, pH 7.2) and incubated at 37 °C for 5 h. The sample was then subjected to rapid gel filtration chromatography using G-25 resin in HE buffer (50 mM HEPES, 1 mM EDTA, pH 7.2). The oxidized BSA thus obtained was stored as aliquots at -50°C until use.
Detecting oxidized BSA by CH - SDS PAGE analysis
Oxidized BSA or unmodified BSA in HE buffer (final concentration 2 μg/μL) was allowed to react with CH (final concentration 300 μM) for 4.5 h at room temperature. The samples were then subjected to SDS PAGE analysis. The gel was first imaged under long wavelength UV to observe the fluorophore conjugated protein and then Coomassie stained. Densitometric analysis was performed using ImageJ (NIH). The graph represents the fluorescence signal of the BSA band normalized to the Coomassie signal, i.e., fluorescent band intensity due to CH-ligated BSA divided by the intensity of the Coomassie stained band.
Standard curve for carbonyl detection in oxidized BSA
Making reduced BSA
Reduced BSA was prepared as described elsewhere [34], with minor modifications. Briefly, BSA in PBS (10 mM PB pH 7.4, 0.9% sodium chloride) was incubated with sodium borohydride (BSA:sodium borohydride = 1:2) for 40 min at room temperature. The protein solution was then subjected to gel filtration with G-25 resin in HE buffer. The reduced BSA thus obtained was stored as aliquots at -50°C until use.
Standard curve
Oxidized BSA or reduced BSA (final concentration: 2.5 μg/μL) was incubated with 400 μM CH for 4.5 h at room temperature. The protein solutions were subjected to gel filtration chromatography using G-25 in HE buffer and their concentration was determined using a BCA assay kit (Thermo Scientific). Various proportions (0-100%) of protein samples (oxidized BSA+CH and reduced BSA+CH) were mixed together to generate a standard curve. The total protein concentration (0.2 μg/μL) was kept constant in all samples. The samples were excited at 364 nm and the emission was measured at 475 nm.
Detection of biomolecule carbonyls in cell lysate
Detection of protein carbonyls in cell lysate
A549 cells (500,000 cells per well) were grown overnight in a 6 well plate. The cells were then treated with or without 4 mM hydrogen peroxide for 4 h. CH to a final concentration of 20 μM was added to the cells and incubated at 37 °C for 2 h. The medium was discarded and the cells were washed twice with PBS. The cells were then lysed in PS buffer (10 mM PB pH 7, 1% SDS) and subjected to SDS PAGE analysis. The gel was first imaged under long wavelength UV to observe fluorophore-conjugated proteins and then Coomassie stained.
Densitometric analysis of each gel lane was performed using ImageJ (NIH). The graph represents the fluorescence signal of the lysate normalized to the Coomassie signal, i.e., fluorescent band intensity divided by the intensity of the Coomassie stained band.
Detection of lipid carbonyls in cell lysate
Cellular lipid was isolated as described elsewhere [35], with minor modifications. A549 cells (500,000 cells per well) were grown in F12K standard medium overnight. Cells were treated with or without hydrogen peroxide (2 mM) for 4.5 h before addition of 20 μM CH. After 2 h, cells were rinsed once with PBS and lysed in PB. To each sample, methanol: chloroform (1:2) was added. The samples were then vortexed vigorously and centrifuged to isolate total lipid from the whole cell lysate. The methanol layer and the precipitate at the interface were discarded and the lipid in the chloroform layer was collected. The isolated lipid samples were excited at 360 nm and emission spectra were obtained using the fluorimeter. Fluorescence fold increase was calculated based on the fluorescence increase at 450 nm for samples excited at 360 nm.
Attempted detection of CH-conjugated DNA isolated from live cells
A549 cells (500,000 cells per well) were grown overnight in F12K medium. Cells were then treated with 4 mM hydrogen peroxide for 4.5 h before incubation with 20 μM CH. After 2 h, cells were rinsed with PBS and lysed. DNA was isolated using GeneJET Genomic DNA Purification Kit (Thermo Scientific) according to manufacturer's instruction. The resultant DNA samples were excited at 405 nm and emission spectra were obtained using the fluorimeter.
Attempted detection of DNA carbonyls in isolated DNA using CH
A549 cells (500,000 cells per well) were grown overnight in F12K medium. Cells were then treated with or without 4 mM hydrogen peroxide for 6 h, lysed and DNA was extracted prior to treatment with 5 μM CH for 2 h. The samples were excited at 360 nm and emission spectra were recorded.
Attempted detection of 8-oxo-GTP by CH
Guanosine triphosphate (GTP) or 8-oxo-GTP (final concentration 0.9 mM) in sodium phosphate buffer (20 mM, pH 7.2) or only buffer was allowed to react with 10 μM CH. After 3.5 h and 24 h, the samples were excited at 405 nm and the emission spectra were recorded using the fluorimeter.
Distribution of fluorescence in lipid versus non-lipid components
A549 cells (250,000 cells/well) were grown in a 6 well plate for 48 h. Medium was discarded and fresh medium with or without hydrogen peroxide (2 mM) was added. After 4 h, the cells were treated with CH (final concentration 20 μM) for 1.5 h. The cells were washed twice with PBS and lysed before methanol precipitation (methanol: lysate in PB = 4:1). The samples were centrifuged and the lipid containing methanol layer was separated from the pellet containing DNA and protein. The pellet was resuspended in SDS containing PB. The lipid and the non-lipid fractions were excited at 360 nm and the emission was recorded at 450 nm to estimate the fraction of fluorescence contributed by the lipid versus the non-lipid layer.
Cell viability assay
A resazurin assay was performed as described previously [36,37], with minor modifications, to assess the cell viability. PC3 or A549 cells (10,000 cells per well) in standard F12K medium were grown overnight in a 96-well plate. Cells were then treated with 20 μM CH, or vehicle (0.5% PB). Cells devoid of exogenous molecule were used as control. After 24 h, the medium was discarded and the cells were washed twice with fresh medium. Subsequently, the cells were incubated for 2 h in fresh medium containing 50 μM resazurin. The optical density was then measured at 570 nm using the BioTek Synergy Mx microplate reader.
Detection of carbonylation of biomolecules using confocal microscopy
Confocal microscopy
Microscopic analysis was performed using a Zeiss LSM 510 Meta confocal microscope. Imaging was initiated within 20 min after the end of the fluorophore incubation period (unless washing steps are stated) at room temperature. A diode 405 nm laser was used to excite the samples while the emission was monitored by long pass (LP) 420 or LP 475 filter. The same scanning rate (scan speed = 7 on the Zeiss 510 control software) was used to image all samples. Photomicrographs were processed for visual clarity; identical parameters were used in each cell line within an experimental set.
Hydrogen peroxide induced carbonylation
PC3 or A549 cells (30,000 cells per chamber) were seeded in 8 chambered coverglass. After overnight incubation, cells were treated with the stated concentration of hydrogen peroxide for 4-5 h. CH in PB was added to the cells and incubated at 37 °C for 30 min. The final concentration of the fluorophore was 20 μM. The final concentration of PB was up to 0.5% (v/v) in each sample. The cells were then imaged, with the emission detected using LP 475 filter.
In another set of experiments, A549 cells were treated similarly and imaged before and after wash with fresh medium. The emission was monitored either using LP 420 or LP 475 filter.
Inhibition of biomolecule carbonylation by exogenous glutathione
PC3 cells (30,000 cells per chamber) were grown in an 8 chambered coverglass overnight. The medium was discarded and fresh medium supplemented with or without 4 mM glutathione (GSH) was added to the cells. Cells were incubated with GSH for 40 min. Extracellular GSH was rinsed off using fresh medium before addition of hydrogen peroxide (2 mM). One set of cells devoid of exogenous molecules and another set of cells treated only with GSH were used as controls. After 4 h, CH was added to the cells to a final concentration of 20 μM and incubated for 30 min at 37 °C prior to confocal microscopic analysis. Emission was collected using a LP 475 filter.
Serum starvation
PC3 or A549 cells (45,000 cells per chamber) were grown in standard (10% FBS and 1% penicillin-streptomycin containing) F12K medium in an 8 chambered coverglass overnight. The medium was discarded and fresh standard medium or medium without FBS was added to the cells. After 24 h, the medium was discarded again. To the serum starved cells, fresh medium (+/-serum) containing CH was added. To the cells grown in standard medium, fresh medium (+/-serum) containing CH was added. The final concentration of CH was 20 μM. After 30 min incubation at 37 °C, the cells were imaged. The emission was monitored using a LP 475 filter.
Detection of carbonylation of biomolecules using plate reader
Hydrogen peroxide induced carbonylation
A549 cells (10,000 cells per well) were grown in a 96-well plate overnight. The medium was discarded and fresh medium containing hydrogen peroxide (0 to 1 mM) was added to the cells and incubated for 4.5 h. CH to a final concentration of 20 μM was then added to the cells followed by a 2 h incubation. The medium was discarded and the cells were rinsed with PBS once before measuring fluorescence using the plate reader. The samples were excited at 405 nm and emission was measured at 475 nm.
The fluorescence intensity in each well was normalized to cell density estimated by an SRB assay. The SRB assay was performed as described elsewhere [38], with minor modifications. Briefly, cells were fixed by adding 25% trichloroacetic acid (w/v) and incubating at 4 °C for 45 min. Cells were then washed and stained with Sulforhodamine B solution (0.2% Sulforhodamine B (w/v) dissolved in 1% acetic acid (v/v)). Unbound dye was washed off after 30 min incubation at room temperature and the bound dye was solubilized in 10 mM unbuffered Tris base. Optical density (OD) was recorded at 570 nm, using the plate reader, to obtain cell density. The graph represents the ratio of fluorescence (emission: 475 nm) due to carbonyl associated CH and cell density (OD at 570 nm).
Serum starvation
PC3 or A549 cells (10,000 cells per well) were grown in standard (10% FBS and 1% penicillin-streptomycin containing) F12K medium in a 96-well plate overnight. The medium was discarded and fresh standard medium or medium without FBS was added to the cells and incubated for 24 h. At the end of the incubation period, CH was added to the cells to a final concentration of 10 μM and incubated for 110 min at 37 °C. Medium was discarded and the cells were rinsed with PBS once prior to analysis. The emission was recorded at 475 nm. The excitation wavelength was 405 nm. The fluorescence intensity in each well was normalized to cell density estimated by an SRB assay as described in the above section.
Results and Discussion
Coumarin hydrazine as a fluorescent probe for aliphatic aldehydes
We have shown previously that certain hydrazine-containing fluorophores undergo changes in their absorption and emission properties upon hydrazone formation [32,39]. The absorption and emission spectra of coumarin hydrazine (1, Figure 1) undergo a red shift upon reaction with an aromatic aldehyde (such as salicylaldehyde, 2, to form the hydrazone 3), which is accompanied by an increase in the quantum yield (Table 1; [32]). We reasoned that if the hydrazine-substituted fluorophores also undergo a change in optical properties upon hydrazone formation with an aliphatic aldehyde, then such molecules could be useful for detecting cellular aldehydes resulting from oxidative stress in live cells.
Figure 1.
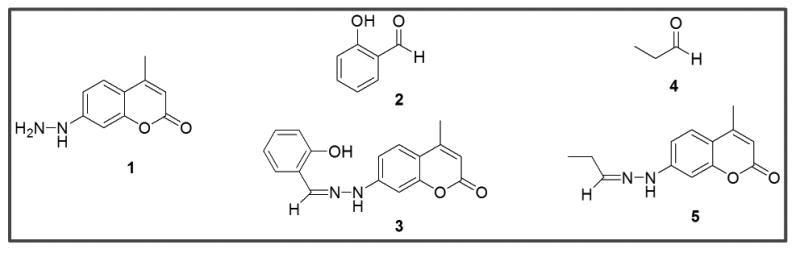
Structures of coumarin hydrazine (CH, 1), salicylaldehyde (2), the hydrazone of salicylaldehyde and CH (3), propanal (4) and the hydrazone of propanal and CH (5).
Table 1. Absorption and emission maxima of CH (1) and CH-hydrazones from model compounds (3 and 5) in aqueous solution.
| Molecule | Absorption maximum (nm) | Emission maximum (nm) |
|---|---|---|
| CH (1) | 346 | 446 |
| CH + salicylaldehyde (3)a | 373 | 474 |
| CH + propanal (5) | 360 | 461 |
Values taken from reference [40]
The majority of carbonylated biomolecules produced by oxidative stress possess aliphatic aldehydes; therefore, it was important to determine the absorption and emission properties of CH hydrazone formed from an aliphatic carbonyl-containing molecule such as propanal (4). The hydrazone of the model compound (5) was prepared by reaction of CH with excess propanal in aqueous solution. Figure 2 shows absorption and emission spectra of CH and its aliphatic hydrazone (5). The absorption spectrum of CH undergoes a red shift and a small increase in extinction coefficient upon hydrazone formation. The wavelength shift is smaller than that observed upon hydrazone formation between CH and an aromatic aldehyde (Table 1), which is expected because the extended conjugation from the aromatic ring in 3 is absent in 5. The emission spectrum of the aliphatic hydrazone of CH is red shifted relative to that of the hydrazine but to a lesser extent than that of the aromatic hydrazone of CH, which is consistent with the absorption properties of the compounds.
Figure 2. Absorption and emission spectra of CH and CH–hydrazone with propanal.
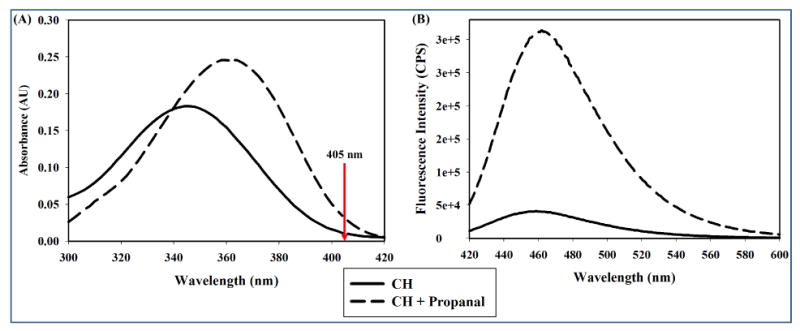
CH (10 μM) in PB was allowed to react with excess propanal (277 mM) prior to collection of the absorption (A) and emission spectra (B). The excitation wavelength was 405 nm (arrow, panel A). Solid curve: 10 μM CH only. Dashed curve: 10 μM CH plus propanal.
Note that the fluorescence spectra shown in Figure 2 were collected using an excitation wavelength of 405 nm (arrow in absorption spectrum) and not the absorption maximum of either molecule. We reasoned that this excitation wavelength would be more relevant to observing hydrazone formation in live cells, where the 405 nm excitation laser would be used for microscopy. At this excitation energy, hydrazone formation increases the integrated emission intensity of the fluorophore by a factor of ∼7.5. The red-shift in the emission maximum of coumarin hydrazone may also provide a spectroscopic advantage in observing hydrazone products in the presence of unreacted hydrazine. Hence, it was hypothesized that CH could be used to detect cellular carbonyls by hydrazone formation without removal of the unreacted reagent.
The next task was to assess the ability of CH to form covalent bonds with carbonyl-containing biomolecules such as proteins. First, CH was allowed to react with unmodified BSA or BSA that had been treated with an external oxidant (oxidized BSA) as described under Materials and Methods. figure 3A shows that the CH-treated oxidized protein is highly fluorescent compared to the CH-treated unmodified commercial BSA. Densitometric analysis of the gels further revealed that CH-treated oxidized BSA is ∼2.3 fold more fluorescent than the CH-treated unmodified BSA (Figure 3B). Since unmodified BSA is known to possess a small degree of carbonylation, for the next experiment a sample was reduced with NaBH4 prior to CH treatment. The reduced BSA and the oxidized BSA were individually treated with CH and were then mixed in varying proportions. A linear relationship was obtained (Figure 3C). These results show that CH fluorescence can be used to detect protein carbonylation.
Figure 3. Oxidized BSA detected by CH.
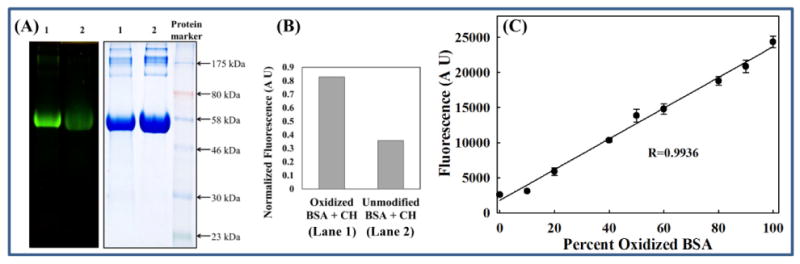
(A) SDS PAGE analysis: Oxidized BSA (1) or unmodified BSA (2) (final concentration 2 μg/μL) was incubated with 300 μM CH for 4.5 h in HE buffer at room temperature. The protein samples were then subjected to SDS PAGE analysis. Left panel: Gel imaged under long wavelength UV. Right panel: Coomassie stained gel. (B) Fluorescence normalized to total protein: Densitometric analysis of (A) was performed using ImageJ. The graph represents a ratio of the fluorescent and Coomassie-stained band densities. (C) Standard curve: Oxidized BSA or reduced BSA was allowed to react with CH as described in Materials and Methods. The protein solutions were then mixed in varied proportions while maintaining a constant mass (0.2 μg/μL). The emission intensity at 475 nm was measured using a plate reader.
Carbonyl-containing biomolecules detected by CH in the intracellular milieu
Oxidative stress results in carbonylation of different cellular components, such as proteins, lipids and DNA [41]. We therefore sought to investigate CH's ability to conjugate with carbonyls associated with each of these components in the intracellular milieu.
The ability of CH to detect intracellular protein carbonylation was assessed using A549 cells. Cells were treated with hydrogen peroxide or vehicle followed by CH as described under Material and Methods. Lysates of the cells were subjected to SDS-PAGE. The resulting gel was first imaged under UV light and then stained for protein. The results of a typical experiment are shown in Figure 4A. The fluorescence of the proteins of hydrogen peroxide-treated cells is visually brighter than that of the untreated cells. Densitometry revealed that the overall fluorescence increased by a factor of ∼3 (Figure 4B).
Figure 4. Carbonyl-containing biomolecules detected by CH in the lysate of hydrogen peroxide treated cells.
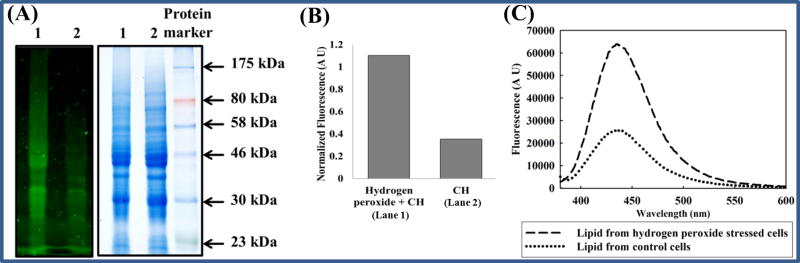
(A) Carbonyl-containing proteins: A549 cells were treated with (1) or without (2) hydrogen peroxide (4 mM) for 4 h before incubation with 20 μM (final concentration) CH for 1.5 h. Cell lysates were then prepared as described in Materials and Methods and subjected to SDS PAGE analysis. Left panel: Gel imaged under long wavelength UV light. Right panel: Coomassie stained gel. (B) Fluorescence normalized to total protein: Densitometric analysis of (A) was performed using ImageJ. The graph represents a ratio of the fluorescent and Coomassie-stained band densities. (C) Carbonyl-containing lipid A549 cells were treated with or without hydrogen peroxide (2 mM) for 4 h before addition of 20 μM CH. After 1.5 h, cells were lysed and lipid was isolated as described in Materials and Methods. The isolated lipid was excited at 360 nm and an emission spectrum was obtained.
To confirm that the fluorescence observed in the gels is the result of covalent hydrazone formation and not due to non-covalent hydrophobic interactions, parallel experiments were performed with an additional control, 7-amino-4-methyl coumarin (“coumarin amine”), in which the hydrazinyl group (-NHNH2) of CH is replaced by an amine (-NH2), described in Supplementary Material. The small change in structure should not significantly affect the hydrophobicity of the molecule. Furthermore, changing this substituent produces only minor differences in the absorption and fluorescence properties of the two molecules [41]. Owing to an amine substituent, however, covalent bond formation between carbonyls and the fluorophore coumarin amine is a reversible process with a low equilibrium constant since an imine rather than a hydrazone is the resulting product. SDS-PAGE followed by densitometry of all three samples revealed that fluorescence in the coumarin amine sample is negligible (Figure S1, Supplementary Material.). Thus, the fluorescence of the proteins in the gels can reasonably be attributed to hydrazone formation between CH and protein aldehydes.
Next, lipids were separated from biopolymers in the lysates by using chloroform and methanol as described under Materials and Methods. The emission spectra of the resulting solutions were measured (Figure 4C). The absorption and emission maxima of lipid samples are red-shifted compared to CH in the same solvent (absorption maximum 340 nm, emission maximum 400 nm; data not shown), which supports the idea that hydrazone and not unreacted hydrazine is being measured in the lipid samples. The fold increase in fluorescence in the hydrogen peroxide-treated lipid fraction was calculated using the emission intensity at 450 nm, and these results are shown in Table 2.
Table 2. Fluorescence fold increase in hydrogen peroxide stressed A549 cells in comparison to control cells.
| Fractions | Samples | Fold Increasea | ||
|---|---|---|---|---|
| Control | Stressed | |||
| Lipid | In methanol layer | 1 | 2.8 ± 0.2 | |
| In chloroform layer | 1 | 2.6 ± 0.4 | ||
| Non-lipid | Methanol precipitate | 1 | 2.6 ± 0.2 | |
| Protein gel (densitometry) | 1 | 3.0 ± 0.9 | ||
Mean and standard deviation of three separate determinations.
Cellular lysates were also subjected to methanol precipitation. The precipitate was resuspended in SDS-containing buffer and absorption and emission spectra of each fraction were recorded. The fold increase in fluorescence in the lipid and non-lipid fractions of peroxidetreated cells was calculated and the results are shown in Table 2. The fold increase in the fluorescence of the lipid fraction obtained by either method is the same within experimental error. Note also that the fold increase in the fluorescence of resuspended methanol precipitate is the same within experimental error as the fold increase obtained from protein densitometry, although the former contains nucleic acid polymers in addition to protein.
DNA was also isolated from CH-treated stressed or unstressed cells as described under Materials and Methods. We were unable to detect hydrazone formation in those samples using fluorescence spectroscopy. In addition, it was noted that CH fluorescence was almost always absent from the nucleus when cells were serum starved or treated with low to moderate amounts of peroxide (see Figures 5, 6, 7). Even following exposure to 2 mM hydrogen peroxide, only some nuclear labeling was observed while the bulk of the nucleus remained dark (Figure S2, Supplementary Material.).
Figure 5. Cellular carbonylation resulting from hydrogen peroxide treatment detected by fluorescence microscopy.
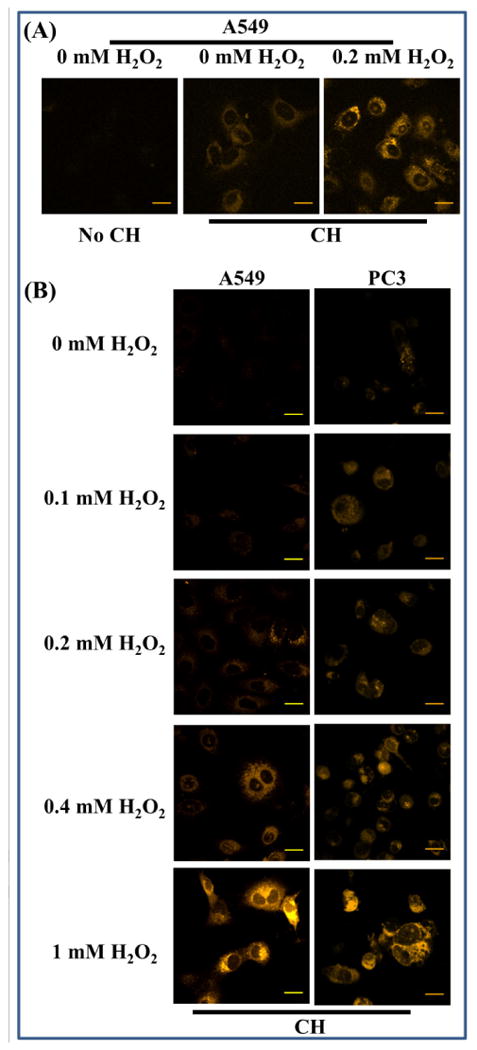
Cells pretreated with the stated concentration of hydrogen peroxide were incubated with CH (final concentration of 20 μM) for 30 min before imaging. A 405 nm diode laser was used for excitation and emission was monitored using a LP 475 filter. Scale bar = 20 μm. Panel A: Optical parameters set to observe endogenous carbonylation. Panel B: Optical parameters set to minimize endogenous carbonylation.
Figure 6. Hydrogen peroxide induced cellular carbonylation detected before and after washing out unreacted fluorophore.
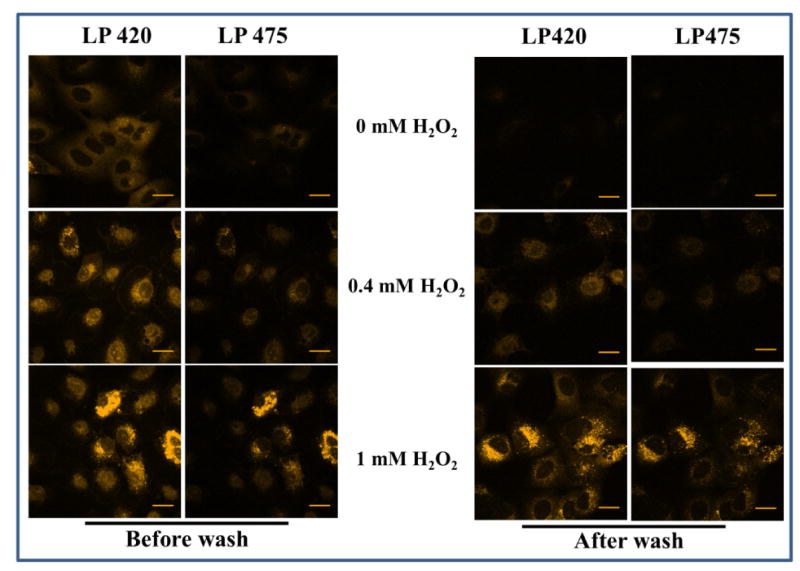
A549 cells were treated with hydrogen peroxide for 4 h before incubation with CH (final concentration 20 μM) for 30 min. Cells were imaged at the end of the incubation period. The cells were washed and imaged again. Samples were excited with a diode 405 nm laser and the emission was monitored either using LP 420 or LP 475 filter.
Figure 7. Inhibition of carbonylation by GSH.
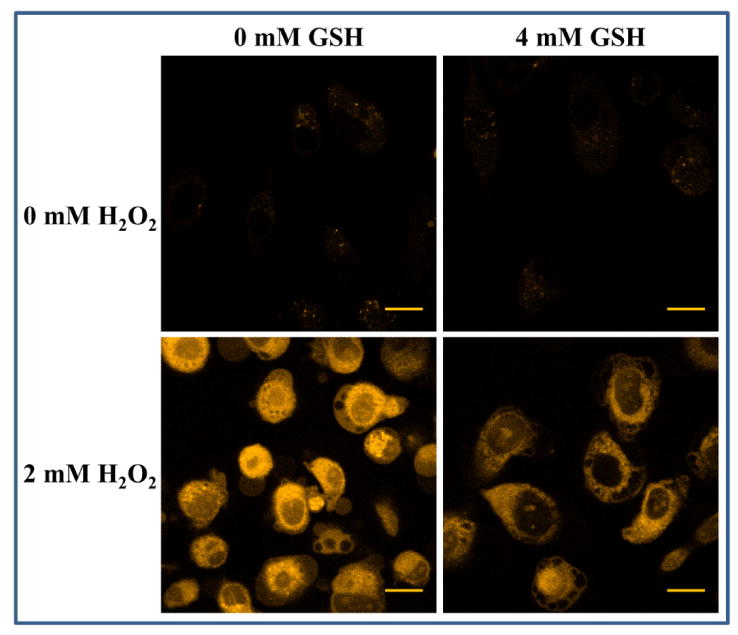
PC3 cells preincubated with 4 mM GSH were rinsed with fresh medium and then treated with 2 mM hydrogen peroxide for 4 h. Cells without exogenous hydrogen peroxide treatment and cells treated only with GSH were used as control. CH in PB was added to a final concentration of 20 μM 30 min before imaging. A 405 nm diode laser was used for excitation and emission was monitored using a LP 475 filter. Scale bar = 20 μm.
We undertook experiments to determine whether the lack of detectable hydrazone in the DNA fraction was due to reactivity of the fluorophore. First, DNA was isolated from stressed and unstressed cells, and the hydrazone-forming reaction was performed on the isolated DNA. No difference in the fluorescence intensity or fluorescence emission maximum was observed in DNA-containing samples from control cells vs. cells treated with peroxide (Figure S3, Supplementary Material.). Next, we attempted to react CH with the major carbonyl-containing product in oxidized DNA, 8-oxoguanine. We used 8-oxo-GTP for this purpose and compared it to GTP as a control. There was no apparent reaction between CH and either compound (fluorescence emission spectral peak and intensity following reaction with 90-fold excess of GTP or 8-oxo-GTP were the same as control; data not shown). Since the carbonyl in 8-oxo-GTP is bonded to nitrogen rather than carbon or hydrogen atoms, it is not expected to react with hydrazines in the same manner as an aldehyde or ketone, consequently, this lack of reaction of CH with 8-oxo-GTP is not surprising based on the chemistry of ureas.
It is known that abasic sites of nuclear DNA can be detected using a probe possessing both an alkoxyamine and biotin moiety, and that this reaction can take place in live cells [42]. Recently, the antihypertensive drug hydralazine, which contains an aromatic hydrazine, was shown to react with abasic sites in DNA under physiologically relevant conditions [43]. These results support the notion that CH-DNA adducts may be formed in live cells; however, we are unable to detect reactive DNA carbonyls by either microscopy or in isolated DNA.
We therefore conclude that CH forms fluorescent products with cellular proteins and lipids in live cells through hydrazone formation with carbonylated functional groups. We have not observed a contribution from DNA, though others have reported detection of DNA carbonyls using chemically similar reagents [20,42,44]. We do not consider this to be evidence of absence of DNA carbonyls, but absence of detection with CH in cells under our conditions.
Intracellular carbonyl-containing biomolecules detected by confocal microscopy
CH is compatible with live cell studies
In order for the fluorophore to be useful for live cell studies, it is necessary to determine if the probe is cytotoxic. Metabolic activity was assessed in different cell lines (PC3 and A549) after 24 h incubation with 20 μM CH using a resazurin based assay. Under these conditions, the fluorophore was not detrimental to cell viability (data not shown). Hence, CH displays no apparent cytotoxicity even after a long incubation with the cells, which renders it suitable for use in live cells.
Hydrogen peroxide induced carbonylation of biomolecules
The next task was to determine whether the spectral changes that occur upon hydrazone formation observed in solution are sufficient for detecting cellular aldehydes. Hydrogen peroxide is known to be a potent inducer of oxidative stress/damage that leads to carbonylation of native proteins, lipids, and DNA [45,46]. Cells were therefore incubated with hydrogen peroxide to promote intracellular carbonylation. The fluorophore was then added to the cells to a final concentration of 20 μM, followed by a 30 min incubation to allow the chemical reaction to take place. Cells were then imaged by confocal microscopy as described under Materials and Methods. As expected, while a basal level of carbonyls/fluorescence was observed in the control cells, a higher level of intracellular fluorescence was detected in peroxide stressed cells (Figure 5A). Next, the cells were exposed to a series of relatively high concentrations of peroxide to investigate if the probe is chemically stable and can effectively detect the increase in fluorescence/carbonylation under these experimental conditions. Optical parameters for microscopy were set such that the fluorescence intensity in control cells (basal level fluorescence) was small to better visualize the fluorescence increase in cells containing higher degree of carbonylation. An increase in intracellular fluorescence with increasing concentration of peroxide was observed, thereby attesting CH's utility as an optical probe for detecting oxidative stress induced carbonylation. (Figure 5B).
Note that the images were acquired without washing the cells; that is, in the presence of unreacted hydrazine. Therefore, an attempt was made to estimate the relative amount of unreacted CH and of CH-hydrazones. Under the experimental conditions tested, the concentration of CH found in the lysate was ∼ 0.2 μM and the concentration of hydrazone was ∼ 0.9 μM in stressed cells (Table S1). These results support the idea that the hydrazones can be detected even in the presence of excess hydrazine in live cells.
To further validate the detection of hydrazones in the presence of excess unreacted hydrazine, we examined the effect of introducing a washing step to remove unreacted fluorophore. Hydrogen peroxide treated cells were incubated with CH and imaged before and after washing out unreacted fluorophores. Two different emission filters were used to analyze the samples: LP 420 was chosen to collect emission due to both the hydrazine and the hydrazone, whereas LP 475 was chosen to detect emission predominantly due to the hydrazone. Figure 6 shows the same pattern of cellular response to hydrogen peroxide treatment before and after wash using both emission filters. Note that when LP 420 is used to observe unwashed cells, background fluorescence in the control due to unreacted hydrazine was evident. If the cells were washed prior to imaging, as expected, a much lower level of fluorescence was observed in the controls using either filter. Similarly, the overall intensity of the emission was diminished. Therefore, a washing step may be used, but equivalent results are obtained by omitting the wash and using the longer wavelength emission filter to observe the cells.
Subcellular distribution of CH-detected carbonyls
An attempt was made to estimate the amount of fluorescence contributed by hydrazone in the lipid versus non-lipid components of the cells. CH was allowed to conjugate with hydrogen peroxide induced cellular carbonyls before separating the lipids from DNA and proteins by methanol precipitation. The fluorescence signal in each fraction was analyzed as described in Material and Methods. We find that the lipids contribute to ∼ 62% of the total fluorescence signal, whereas the remaining ∼38% fluorescence is contributed by the non-lipid components in stressed cells (Table 3). Therefore, under these experimental conditions, more lipid oxidation products, compared to other oxidation products, were detected by this technique.
Table 3. Relative fluorescence contributed by lipid and non-lipid fractions of A549 cells.
| Fractions | Samples | Percent Fluorescencea |
|---|---|---|
| Lipid | Control | 63 ± 3.4 |
| Stressed | 62 ± 0.90 | |
| Non-lipid | Control | 37 ± 4.7 |
| Stress | 38 ± 2.9 |
Mean and standard deviation from three separate determinations.
GSH induced inhibition of biomolecule carbonylation
Cells are protected from day-to-day ROS and therefore carbonylation by the presence of endogenous reducing agents. In particular, the anti-oxidant glutathione (GSH) plays an important role in protecting cells from oxidative damage [2]. It has been shown that exogenous GSH can protect cells from injury due to oxidative stress [47,48]. We therefore examined whether the effect of GSH could also be detected by CH fluorescence. Since A549 cells break down GSH before transporting it inside the cells [49], PC3 cells were used as the study model in this experimental set. The cells were first incubated with or without GSH, washed, and then treated with hydrogen peroxide for 24 hours before addition of CH. It is seen that GSH treatment prior to hydrogen peroxide treatment decreases global fluorescence relative to that of the peroxide treated cells (Figure 7), which agrees with the idea that exogenous GSH protects cells from oxidative damage.
Serum starvation
In the previous experiments, oxidative stress was induced by an external oxidant, hydrogen peroxide. It is important to determine if the carbonyls resulting from oxidants generated endogenously can be detected by this method. Reactive oxygen species can be produced endogenously by serum starvation [50]. Therefore, the applicability of CH in detecting serum starvation induced oxidative injury was evaluated. Cells were initially grown in standard (serum containing) medium before changing to serum free (serum starved) or standard medium (control). After 24 h, the cells were incubated with CH for 30 min, after replacing medium of the serum starved cells with serum free or standard medium. Similarly, the medium of the control cells was replaced by serum free or standard medium.
Confocal microscopic analysis showed that the intracellular fluorescence in serum starved cells was higher than that in cells grown in the presence of serum (Figure 8). This illustrates a greater level of oxidative stress in serum starved cells, which is in agreement with existing literature. Similar results were obtained in both PC3 and A549 cells. It was noted that the increase in fluorescence due to serum starvation was higher in A549 cells than in PC3 cells.
Figure 8. Microscopic detection of carbonylation due to oxidative stress in serum starved cells.
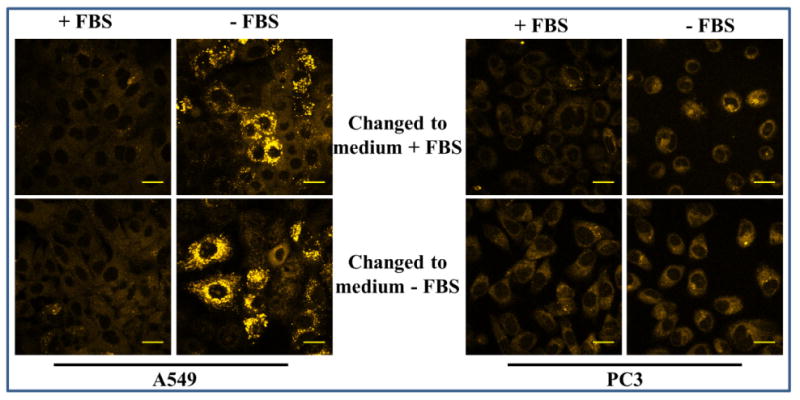
Cells were grown in F12K medium with or without serum for 24 h. The medium was discarded. To the serum starved cells, fresh medium (+/- serum) containing CH was added. To the cells grown in the presence of serum, fresh medium (+/- serum) containing CH was added. After 30 min, photomicrographs were obtained. A 405 nm diode laser was used for excitation and emission was monitored using a LP 475 filter. The final concentration of CH was 20 μM. Scale bar = 20 μm.
An interesting observation was that there was a slight increase in fluorescence in the control cells that were incubated in serum free medium during fluorophore treatment. It was reasoned that this increase in fluorescence was due to the brief period of serum starvation during CH treatment. Meanwhile, the intracellular fluorescence remained unaltered in the serum starved cells that were incubated with serum supplemented medium during the brief incubation with CH. This demonstrates that the observed oxidative response in serum starved cells was not reversed during the brief exposure to serum containing medium. This is in line with expectation since carbonylation is an irreversible process, thereby validating CH's applicability for detecting intracellular carbonyls.
Detection of biomolecule carbonylation using a microplate reader
Production of reactive oxygen species is frequently detected in live cells using a fluorescence plate reader [51]. We therefore assessed whether detection of hydrogen peroxide induced carbonylation in live A549 cells using CH could also be performed in a plate reader format. Since peroxide will oxidize biomolecules in the medium, it was necessary to replace the medium with PBS prior to measuring cellular carbonyl associated CH. About a three-fold increase in fluorescence was observed in A549 cells treated with 1 mM hydrogen peroxide versus untreated cells (Figure 9A). This follows the same trend detected by microscopic analysis (Figure 6) where an increase in fluorescence is observed with increasing concentration of hydrogen peroxide.
Figure 9. Cellular carbonylation detected using a fluorescence plate reader.
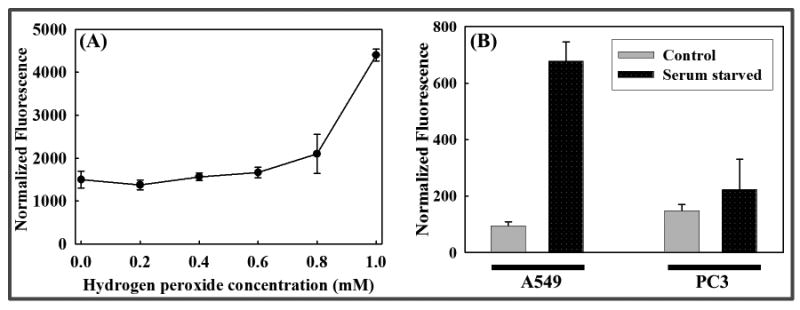
(A) Hydrogen peroxide induced carbonylation: A549 cells were treated with different concentrations of hydrogen peroxide for 4.5 h prior to 2 h incubation with 20 μM CH. (B) Serum starvation induced carbonylation: Cells (PC3 and A549) grown in the presence (control) or absence (serum starved) of serum for 24 h were treated with 10 μM CH for 110 min. (A) & (B): The medium was discarded after fluorophore treatment and the cells were rinsed with PBS once immediately before measuring the fluorescence (excitation: 405 nm; emission: 475 nm). An SRB assay was then performed as described in Materials and Methods to estimate the cell density after both experiments. The graphs represent fluorescence normalized to cell density.
Oxidative stress generated due to serum starvation of A549 and PC3 cells was also examined in the plate reader format. An increase in fluorescence was observed in serum starved cells compared to the control when emission was measured directly after CH incubation, but the increase was small (data not shown). In the confocal microscope, a plane can be selected that obviates extracellular CH fluorescence, thus increasing the fraction of the signal that originates in the cells. This is not possible in a plate reader, where the cells and the entire column of the medium above the cells contribute to the recorded signal. It was therefore necessary to replace the medium with PBS before measuring the fluorescence. The medium change step produced a detectable contrast in fluorescence between the stressed and the unstressed cells (Figure 9B). Note that the fluorescence of stressed cells observed in the plate reader was higher for A549 cells than for PC3 cells, which is consistent with the observations from microscopic analysis of cells processed under similar conditions.
Summary and Conclusion
Cellular oxidative stress can be observed in live cells using a number of markers, including detection of hydrogen peroxide, superoxide, nitrous oxide and lipid peroxidation. Detection of biomolecule carbonylation, however, has required an end point assay where the cells are either fixed or lysed for downstream analyses. We show that carbonylation of lipids and proteins can be detected directly in live cells using a fluorophore, which in this work is coumarin hydrazine. The signal detected is primarily due to lipids (>60%). Furthermore, the method is simple to perform: the fluorophore is added directly to the medium, and after a short incubation, cellular carbonyls can be detected by confocal microscopy. Cellular carbonylation can also be effectively detected using a plate reader provided that extracellular CH is removed prior to reading the plate. This method should be useful for observing global cellular carbonylation as a stand-alone screening assay or to determine candidates for downstream, quantitative processing.
Supplementary Material
Highlights.
A hydrazine-functionalized fluorophore has been used to detect oxidative stress induced carbonylation of lipids and proteins in live mammalian cells.
The optical properties of the fluorophore allow for the detection of these cellular carbonyls in a single step procedure using confocal microscopy.
The fluorescent probe and technique used are applicable for both microscope and plate reader based detection methods.
Acknowledgments
This work was supported in part by the Intramural Research Program of the Eunice Kennedy Shriver National Institute of Child Health and Human Development and by NIH Grant R15 GM-102867. The Regional NMR Facility (600 MHz instrument) at Binghamton University is supported by NSF (CHE-0922815). The authors would like to thank Dr. Abhijit Banerjee for synthesizing coumarin hydrazine and coumarin amine, Dr. Ozlem Dilek for synthesizing coumarin aldehyde, Mr. David Tuttle for photographing the gels and for expert assistance with image processing, Professor Rebecca Kissling for scientific discussion and assistance with organic synthesis, and Professor Ming An for the generous gift of A549 cells.
Abbreviation
- CH
Coumarin hydrazine (7-hydrazinyl-4-methyl-2H-chromen-2-one)
Footnotes
Publisher's Disclaimer: This is a PDF file of an unedited manuscript that has been accepted for publication. As a service to our customers we are providing this early version of the manuscript. The manuscript will undergo copyediting, typesetting, and review of the resulting proof before it is published in its final citable form. Please note that during the production process errors may be discovered which could affect the content, and all legal disclaimers that apply to the journal pertain.
References
- 1.Reuter S, Gupta SC, Chaturvedi MM, Aggarwal BB. Oxidative stress, inflammation, and cancer: how are they linked? Free radical biology & medicine. 2010;49:1603–1616. doi: 10.1016/j.freeradbiomed.2010.09.006. [DOI] [PMC free article] [PubMed] [Google Scholar]
- 2.Schulz JB, Lindenau J, Seyfried J, Dichgans J. Glutathione, oxidative stress and neurodegeneration. European journal of biochemistry / FEBS. 2000;267:4904–4911. doi: 10.1046/j.1432-1327.2000.01595.x. [DOI] [PubMed] [Google Scholar]
- 3.Rains JL, Jain SK. Oxidative stress, insulin signaling, and diabetes. Free radical biology & medicine. 2011;50:567–575. doi: 10.1016/j.freeradbiomed.2010.12.006. [DOI] [PMC free article] [PubMed] [Google Scholar]
- 4.Kirkham PA, Caramori G, Casolari P, Papi AA, Edwards M, Shamji B, Triantaphyllopoulos K, Hussain F, Pinart M, Khan Y, Heinemann L, Stevens L, Yeadon M, Barnes PJ, Chung KF, Adcock IM. Oxidative stress-induced antibodies to carbonyl-modified protein correlate with severity of chronic obstructive pulmonary disease. American journal of respiratory and critical care medicine. 2011;184:796–802. doi: 10.1164/rccm.201010-1605OC. [DOI] [PMC free article] [PubMed] [Google Scholar]
- 5.Badran M, Ayas N, Laher I. Cardiovascular complications of sleep apnea: role of oxidative stress. Oxidative medicine and cellular longevity. 2014;2014:985258. doi: 10.1155/2014/985258. [DOI] [PMC free article] [PubMed] [Google Scholar]
- 6.Dalle-Donne I, Giustarini D, Colombo R, Rossi R, Milzani A. Protein carbonylation in human diseases. Trends in molecular medicine. 2003;9:169–176. doi: 10.1016/s1471-4914(03)00031-5. [DOI] [PubMed] [Google Scholar]
- 7.Baraibar MA, Ladouce R, Friguet B. Proteomic quantification and identification of carbonylated proteins upon oxidative stress and during cellular aging. Journal of proteomics. 2013;92:63–70. doi: 10.1016/j.jprot.2013.05.008. [DOI] [PubMed] [Google Scholar]
- 8.Levine RL. Carbonyl modified proteins in cellular regulation, aging, and disease. Free radical biology & medicine. 2002;32:790–796. doi: 10.1016/s0891-5849(02)00765-7. [DOI] [PubMed] [Google Scholar]
- 9.Suzuki YJ, Carini M, Butterfield DA. Protein carbonylation. Antioxidants & redox signaling. 2010;12:323–325. doi: 10.1089/ars.2009.2887. [DOI] [PMC free article] [PubMed] [Google Scholar]
- 10.Abuja PM, Albertini R. Methods for monitoring oxidative stress, lipid peroxidation and oxidation resistance of lipoproteins. Clinica chimica acta; international journal of clinical chemistry. 2001;306:1–17. doi: 10.1016/s0009-8981(01)00393-x. [DOI] [PubMed] [Google Scholar]
- 11.Spickett CM. The lipid peroxidation product 4-hydroxy-2-nonenal: Advances in chemistry and analysis. Redox biology. 2013;1:145–152. doi: 10.1016/j.redox.2013.01.007. [DOI] [PMC free article] [PubMed] [Google Scholar]
- 12.De Bont R, van Larebeke N. Endogenous DNA damage in humans: a review of quantitative data. Mutagenesis. 2004;19:169–185. doi: 10.1093/mutage/geh025. [DOI] [PubMed] [Google Scholar]
- 13.Dalle-Donne I, Rossi R, Giustarini D, Milzani A, Colombo R. Protein carbonyl groups as biomarkers of oxidative stress. Clinica chimica acta; international journal of clinical chemistry. 2003;329:23–38. doi: 10.1016/s0009-8981(03)00003-2. [DOI] [PubMed] [Google Scholar]
- 14.Berlett BS, Stadtman ER. Protein oxidation in aging, disease, and oxidative stress. The Journal of biological chemistry. 1997;272:20313–20316. doi: 10.1074/jbc.272.33.20313. [DOI] [PubMed] [Google Scholar]
- 15.Moller IM, Rogowska-Wrzesinska A, Rao RS. Protein carbonylation and metal-catalyzed protein oxidation in a cellular perspective. Journal of proteomics. 2011;74:2228–2242. doi: 10.1016/j.jprot.2011.05.004. [DOI] [PubMed] [Google Scholar]
- 16.Tamarit J, de Hoogh A, Obis E, Alsina D, Cabiscol E, Ros J. Analysis of oxidative stress-induced protein carbonylation using fluorescent hydrazides. Journal of proteomics. 2012;75:3778–3788. doi: 10.1016/j.jprot.2012.04.046. [DOI] [PubMed] [Google Scholar]
- 17.Halliwell B, Chirico S. Lipid peroxidation: its mechanism, measurement, and significance. The American journal of clinical nutrition. 1993;57:715S–724S. doi: 10.1093/ajcn/57.5.715S. discussion 724S-725S. [DOI] [PubMed] [Google Scholar]
- 18.Gueraud F, Atalay M, Bresgen N, Cipak A, Eckl PM, Huc L, Jouanin I, Siems W, Uchida K. Chemistry and biochemistry of lipid peroxidation products. Free radical research. 2010;44:1098–1124. doi: 10.3109/10715762.2010.498477. [DOI] [PubMed] [Google Scholar]
- 19.Del Rio D, Stewart AJ, Pellegrini N. A review of recent studies on malondialdehyde as toxic molecule and biological marker of oxidative stress. Nutrition, metabolism, and cardiovascular diseases. 2005;15:316–328. doi: 10.1016/j.numecd.2005.05.003. NMCD. [DOI] [PubMed] [Google Scholar]
- 20.Levine RL, Garland D, Oliver CN, Amici A, Climent I, Lenz AG, Ahn BW, Shaltiel S, Stadtman ER. Determination of carbonyl content in oxidatively modified proteins. Methods in enzymology. 1990;186:464–478. doi: 10.1016/0076-6879(90)86141-h. [DOI] [PubMed] [Google Scholar]
- 21.Yan LJ, Sohal RS. Gel electrophoretic quantitation of protein carbonyls derivatized with tritiated sodium borohydride. Analytical Biochemistry. 1998;265:176–182. doi: 10.1006/abio.1998.2868. [DOI] [PubMed] [Google Scholar]
- 22.Gladstone IM, Jr, Levine RL. Oxidation of proteins in neonatal lungs. Pediatrics. 1994;93:764–768. [PubMed] [Google Scholar]
- 23.Paromov V, Qui M, Yang H, Smith M, Stone WL. The influence of N-acetyl-L-cysteine on oxidative stress and nitric oxide synthesis in stimulated macrophages treated with a mustard gas analogue. BMC cell biology. 2008;9:33. doi: 10.1186/1471-2121-9-33. [DOI] [PMC free article] [PubMed] [Google Scholar]
- 24.Jia L, Liu Z, Sun L, Miller SS, Ames BN, Cotman CW, Liu J. Acrolein, a toxicant in cigarette smoke, causes oxidative damage and mitochondrial dysfunction in RPE cells: protection by (R)- alpha-lipoic acid. Investigative ophthalmology & visual science. 2007;48:339–348. doi: 10.1167/iovs.06-0248. [DOI] [PMC free article] [PubMed] [Google Scholar]
- 25.Zheng J, Bizzozero OA. Accumulation of protein carbonyls within cerebellar astrocytes in murine experimental autoimmune encephalomyelitis. Journal of neuroscience research. 2010;88:3376–3385. doi: 10.1002/jnr.22488. [DOI] [PMC free article] [PubMed] [Google Scholar]
- 26.Wehr NB, Levine RL. Quantification of protein carbonylation. Methods in molecular biology. 2013;965:265–281. doi: 10.1007/978-1-62703-239-1_18. [DOI] [PubMed] [Google Scholar]
- 27.Yan LJ, Forster MJ. Chemical probes for analysis of carbonylated proteins: a review. Journal of chromatography B, Analytical technologies in the biomedical and life sciences. 2011;879:1308–1315. doi: 10.1016/j.jchromb.2010.08.004. [DOI] [PMC free article] [PubMed] [Google Scholar]
- 28.Ahn B, Rhee SG, Stadtman ER. Use of fluorescein hydrazide and fluorescein thiosemicarbazide reagents for the fluorometric determination of protein carbonyl groups and for the detection of oxidized protein on polyacrylamide gels. Analytical Biochemistry. 1987;161:245–257. doi: 10.1016/0003-2697(87)90448-9. [DOI] [PubMed] [Google Scholar]
- 29.Buss H, Chan TP, Sluis KB, Domigan NM, Winterbourn CC. Protein carbonyl measurement by a sensitive ELISA method. Free radical biology & medicine. 1997;23:361–366. doi: 10.1016/s0891-5849(97)00104-4. [DOI] [PubMed] [Google Scholar]
- 30.Key JA, Li C, Cairo CW. Detection of cellular sialic acid content using nitrobenzoxadiazole carbonyl-reactive chromophores. Bioconjugate Chemistry. 2012;23:363–371. doi: 10.1021/bc200276k. [DOI] [PubMed] [Google Scholar]
- 31.Shi X, Jung Y, Lin LJ, Liu C, Wu C, Cann IK, Ha T. Quantitative fluorescence labeling of aldehyde-tagged proteins for single-molecule imaging. Nature methods. 2012;9:499–503. doi: 10.1038/nmeth.1954. [DOI] [PMC free article] [PubMed] [Google Scholar]
- 32.Banerjee A, Panosian TD, Mukherjee K, Ravindra R, Gal S, Sackett DL, Bane S. Site-Specific Orthogonal Labeling of the Carboxy Terminus of alpha-Tubulin. Acs Chemical Biology. 2010;5:777–785. doi: 10.1021/cb100060v. [DOI] [PMC free article] [PubMed] [Google Scholar]
- 33.Zanella F, Lorens JB, Link W. High content screening: seeing is believing. Trends in Biotechnology. 2010;28:237–245. doi: 10.1016/j.tibtech.2010.02.005. [DOI] [PubMed] [Google Scholar]
- 34.Buss IH, Winterbourn CC. Protein carbonyl measurement by ELISA. Methods in molecular biology. 2002;186:123–128. doi: 10.1385/1-59259-173-6:123. [DOI] [PubMed] [Google Scholar]
- 35.Folch J, Lees M, Sloane Stanley GH. A simple method for the isolation and purification of total lipides from animal tissues. The Journal of biological chemistry. 1957;226:497–509. [PubMed] [Google Scholar]
- 36.Walzl A, Unger C, Kramer N, Unterleuthner D, Scherzer M, Hengstschlager M, Schwanzer-Pfeiffer D, Dolznig H. The Resazurin Reduction Assay Can Distinguish Cytotoxic from Cytostatic Compounds in Spheroid Screening Assays. Journal of biomolecular screening. 2014 doi: 10.1177/1087057114532352. [DOI] [PubMed] [Google Scholar]
- 37.Anoopkumar-Dukie S, Carey JB, Conere T, O'Sullivan E, van Pelt FN, Allshire A. Resazurin assay of radiation response in cultured cells. The British journal of radiology. 2005;78:945–947. doi: 10.1259/bjr/54004230. [DOI] [PubMed] [Google Scholar]
- 38.Vichai V, Kirtikara K. Sulforhodamine B colorimetric assay for cytotoxicity screening. Nature protocols. 2006;1:1112–1116. doi: 10.1038/nprot.2006.179. [DOI] [PubMed] [Google Scholar]
- 39.Dilek Ö, Bane SL. Synthesis of boron dipyrromethene fluorescent probes for bioorthogonal labeling. Tetrahedron Letters. 2008;49:1413–1416. doi: 10.1016/j.tetlet.2007.12.052. [DOI] [PMC free article] [PubMed] [Google Scholar]
- 40.Banerjee A. Harnessing the flexibility of tubulin tyrosine ligase to site-specifically label C-terminus of alpha-tubulin. ProQuest UMI. 2010 [Google Scholar]
- 41.Finkel T, Holbrook NJ. Oxidants, oxidative stress and the biology of ageing. Nature. 2000;408:239–247. doi: 10.1038/35041687. [DOI] [PubMed] [Google Scholar]
- 42.Atamna H, Cheung I, Ames BN. A method for detecting abasic sites in living cells: age-dependent changes in base excision repair. Proceedings of the National Academy of Sciences of the United States of America. 2000;97:686–691. doi: 10.1073/pnas.97.2.686. [DOI] [PMC free article] [PubMed] [Google Scholar]
- 43.Melton D, Lewis CD, Price NE, Gates KS. Covalent adduct formation between the antihypertensive drug hydralazine and abasic sites in double- and single-stranded DNA. Chemical research in toxicology. 2014;27:2113–2118. doi: 10.1021/tx5003657. [DOI] [PMC free article] [PubMed] [Google Scholar]
- 44.Cooke MS, Evans MD, Dizdaroglu M, Lunec J. Oxidative DNA damage: mechanisms, mutation, and disease. FASEB journal: official publication of the Federation of American Societies for Experimental Biology. 2003;17:1195–1214. doi: 10.1096/fj.02-0752rev. [DOI] [PubMed] [Google Scholar]
- 45.Giorgio M, Trinei M, Migliaccio E, Pelicci PG. Hydrogen peroxide: a metabolic by-product or a common mediator of ageing signals? Nature reviews Molecular cell biology. 2007;8:722–728. doi: 10.1038/nrm2240. [DOI] [PubMed] [Google Scholar]
- 46.Wijeratne SS, Cuppett SL, Schlegel V. Hydrogen peroxide induced oxidative stress damage and antioxidant enzyme response in Caco-2 human colon cells. Journal of agricultural and food chemistry. 2005;53:8768–8774. doi: 10.1021/jf0512003. [DOI] [PubMed] [Google Scholar]
- 47.Lash LH, Hagen TM, Jones DP. Exogenous glutathione protects intestinal epithelial cells from oxidative injury. Proceedings of the National Academy of Sciences of the United States of America. 1986;83:4641–4645. doi: 10.1073/pnas.83.13.4641. [DOI] [PMC free article] [PubMed] [Google Scholar]
- 48.Ghelli A, Porcelli AM, Zanna C, Martinuzzi A, Carelli V, Rugolo M. Protection against oxidantinduced apoptosis by exogenous glutathione in Leber hereditary optic neuropathy cybrids. Investigative ophthalmology & visual science. 2008;49:671–676. doi: 10.1167/iovs.07-0880. [DOI] [PubMed] [Google Scholar]
- 49.Kang YJ, Feng Y, Hatcher EL. Glutathione stimulates A549 cell proliferation in glutaminedeficient culture: the effect of glutamate supplementation. Journal of cellular physiology. 1994;161:589–596. doi: 10.1002/jcp.1041610323. [DOI] [PubMed] [Google Scholar]
- 50.Kuznetsov AV, Kehrer I, Kozlov AV, Haller M, Redl H, Hermann M, Grimm M, Troppmair J. Mitochondrial ROS production under cellular stress: comparison of different detection methods. Analytical and bioanalytical chemistry. 2011;400:2383–2390. doi: 10.1007/s00216-011-4764-2. [DOI] [PubMed] [Google Scholar]
- 51.Wang H, Joseph JA. Quantifying cellular oxidative stress by dichlorofluorescein assay using microplate reader. Free radical biology & medicine. 1999;27:612–616. doi: 10.1016/s0891-5849(99)00107-0. [DOI] [PubMed] [Google Scholar]
Associated Data
This section collects any data citations, data availability statements, or supplementary materials included in this article.