Abstract
Purpose
To characterize the fundamental limits of MRI near metallic implants on RF excitation, frequency encoding, and chemical shift-encoding water-fat separation.
Methods
Multicomponent 3D digital models of a total hip and a total knee replacement were used to construct material specific susceptibility maps. The fundamental limits and spatial relationship of imaging near metallic prostheses were investigated as a function of distance from the prosthetic surface by calculating 3D field-map perturbations using a well-validated k-space based dipole kernel.
Results
Regions limited by the bandwidth of RF excitation overlap substantially with those fundamentally limited by frequency encoding. Rapid breakdown of water-fat separation occurs once the intra-voxel off-resonance exceeds ~6 ppm over a full range of fat-fractions (0 to 100%) and SNR (5-100).
Conclusion
Current 3D multispectral imaging methods would not benefit greatly from exciting spins beyond ±12 kHz despite the presence of signal that lies outside of this range from tissue directly adjacent to the metallic implants. Methods such as phase encoding in all three spatial dimensions are necessary to spatially resolve spins beyond an excitation bandwidth of ±12 kHz. The approach described in this work provides a benchmark for the capabilities of current imaging techniques to guide development of new MRI methods for imaging near metal.
Keywords: metallic implants, prostheses, off-resonance, water-fat separation, B0 inhomogeneity, magnetic resonance imaging
Introduction
Over the past decades, the prevalence of osteoarthritis in our aging population has resulted in a rapidly increasing number of surgical joint replacements (1,2). These trends are expected to continue, with annual total knee and hip replacement surgeries expected to exceed 4.4 million by 2030 (3).
Conventional magnetic resonance imaging (MRI) methods provide excellent soft tissue contrast for the diagnosis of many musculoskeletal abnormalities. Accurate diagnosis for musculoskeletal applications requires high resolution imaging of all relevant tissue and fluid collections. It is also desirable to have homogeneous fat-suppression to distinguish fat from enhancing tissue or non-adipose tissue with tissue that has an inherently short T1 (eg. proteinacious fluid, blood products, etc).
Due to the large susceptibility difference between metal and tissue, however, metallic implants induce large perturbations in the magnetic field (B0). This poses several challenges for MR imaging with regards to both scan time and image quality. First, the extremely wide spectrum of off-resonance frequencies is a challenge with respect to radiofrequency (RF) excitation. The high flip angles used with fast spin echo imaging limits the RF excitation bandwidth (due to hardware limits in the peak B1 that can be achieved) resulting in incomplete excitation. Frequency encoding presents additional challenges in the presence of metal leading to bulk distortion (4) and a new class of artifacts recently described by Koch et al. (5). Specifically, signal loss and signal pileup occur when the static local field from metal exceeds the applied readout gradient used for spatial encoding. Finally, significant intra-voxel dephasing due to severe off-resonance adjacent to metal poses challenges for conventional fat suppression methods including chemical shift encoded water-fat separation methods (6). These challenges affect scan efficiency as well as the diagnostic capability of the images with these artifacts.
Recent development of 3D multispectral imaging (MSI) techniques such as MAVRIC (7,8) and SEMAC (9) have addressed the broad off-resonance frequencies for imaging near metal by acquiring multiple 3D-FSE acquisitions at different RF frequency offsets. The data are then combined into a composite data set. For each RF frequency offset, a relatively narrow RF excitation bandwidth, high readout bandwidth, and view-angle tilting are typically used to minimize image distortion. This approach has dramatically improved MRI near metallic prostheses as confirmed by recent studies indicating enhanced diagnostic potential (10-14). However, these approaches use frequency encoding and therefore are susceptible to the signal distortion artifacts described above. It is for this reason as well as scan time considerations that 3D-MSI techniques typically limit the excitation range to ±12 kHz at both 1.5T and 3T despite the presence of a significant amount of off-resonance signal outside of this range from tissue adjacent to the metallic implants.
Phase-encoding in all three spatial dimensions can avoid the signal distortion related to frequency encoding, although fully-sampled acquisitions historically require very long scan times (hours). A unique advantage of 3D phase-encoding is the ability to perform parallel imaging in three dimensions (15). For example, Artz et al. recently demonstrated how a spectrally-resolved fully phase-encoded (SR-FPE) 3D-FSE technique can be accelerated from four hours to 12 minutes (15). This method collects multiple temporal samples across each spin-echo, that can be recombined using spectral modeling to facilitate very high signal-to-noise ratio (SNR) performance. Further acceleration will be necessary to perform SR-FPE at multiple RF offsets, similar to MAVRIC and SEMAC, but the high SNR could enable additional scan time reduction techniques (eg. multiband RF (16), off-resonance encoding (17), compressed sensing (18), etc). SR-FPE is also attractive and unique compared to MAVRIC and SEMAC because the spectral data enable water-fat separation (15). However, the ability to perform water-fat separation will be limited in areas near metal when extreme local field gradients cause severe intra-voxel signal dephasing that fundamentally limits water-fat separation.
RF excitation, frequency encoding, and water-fat separation near metal depend on numerous factors such as field strength, material susceptibility, geometry, orientation with respect to B0, and image spatial resolution. To further develop MR imaging capabilities near metal, it is critical to identify the relationship of these fundamental limits with respect to each other and also the spatial relationship of these limits with respect to the metallic implants. Further, these limitations should be explored at both 1.5T and 3T, the two most commonly used field strengths in modern clinical practice. Therefore, the purpose of this work was to perform simulations using 3D digital models of a total knee and total hip prostheses to analyze the fundamental limitations of MRI near metal, related to RF excitation, frequency encoding and fat-water separation, at both 1.5T and 3T.
Methods
Validation of Linear Magnetization Assumption and Simulation Code
Simulations in this study assume that specific metallic alloys are highly paramagnetic materials and, therefore, the induced magnetization within the metal scales linearly with B0 field strength up to 3T. Under this assumption, B0 field perturbations at 1.5T should be twice as severe at 3.0T. The magnetic properties of metal used in prostheses are not well defined and with limited reports in the literature (4). Therefore, to verify this assumption and to validate the code used for these simulations, an imaging experiment was performed comparing off-resonance effects at 1.5T and 3T.
The head of a cobalt-chromium-molybdenum (CoCrMo) hip prosthesis (Integral Hip System, Biomet, Inc., Warsaw, IN) was submerged in an undoped water bath, positioned in the center (coronal view), and secured to the bottom of the phantom. Hash marks in the superior/inferior (S/I) and left/right dimensions marked the position of alignment laser lights, allowing the phantom setup to be replicated at both field strengths. Glass vials were also secured in two corners of the phantom to aid in spatial registration.
Three SR-FPE scans, each at a different RF offset, were performed at 1.5T (MR450w, GE Healthcare, Waukesha, WI) and 3T (MR750, GE Healthcare, Waukesha, WI) using a 16-channel wrap array coil (NeoCoil, Pewaukee, WI). Gaussian RF pulses with full-width-half-maximum 2.25 kHz excitation bandwidth were centered at −2000, 0, and +2000 Hz at 1.5T. In an attempt to excite spins at those same spatial locations at 3T, Gaussian RF pulses were played with twice the excitation bandwidth, 4.5 kHz, and centered at −4000, 0, and +4000 Hz. Acquisition parameters at 1.5T and 3T included: field-of-view = 24×12×10 cm3, matrix = 240×120×50, ADC samples = 1, receiver BW = ±2.5 kHz, TR = 1.55 s, echo train length = 120, echo spacing = 7 ms, TEeff = 420 ms, linear k-space encoding, with scan time of 16:37 min. SR-FPE was prospectively undersampled for all scans using 3D ellipsoid k-space corner cutting and parallel imaging in all three spatial dimensions (Rx×Ry×Rz=3×2×2). A 3D-GRAPPA (19) reconstruction was performed using an auto-calibration region of 25×25×25 and a kernel size of 7×5×5.
The images acquired with a center frequency with 0 Hz off-resonance were used to manually register the two datasets at 1.5T and 3T. A single coronal slice was displayed for each RF band and compared. For a more rigorous comparison, line profiles were measured and normalized to the maximum signal intensity across the negative and positive off-resonance images to determine whether the respective RF bands were at the same spatial locations at 1.5T and 3T.
In order to validate the simulations of off-resonance used in this study, B0 inhomogeneity was estimated (described below) using a 3D digital model of the same femoral head prosthesis obtained via 3D laser scanning with sub millimeter resolution (ShapeGrabber, Ottawa, ON, Canada). A susceptibility value of 1300 ppm was assumed based on literature values for CoCrMo (20,21).
3D Models of Knee and Hip Prostheses
Three-dimensional digital models of a total hip and total knee replacement (Figure 1) were supplied by Biomet Orthopedics (Warsaw, IN). Each digital model, comprised of multiple subcomponents (see Table I), was assigned a coordinate system to reflect the typical anatomical position with respect to the B0 field and exported as a stereolithography (STL) file format using SolidWorks (SolidWorks Corp., Waltham, MA). The model was then imported into Matlab (Mathworks, Natick, MA), where a high-resolution (350 μm) mask of each sub-component of the model was created using a ray tracing technique. Each sub-component mask was then assigned a susceptibility value before combining into a susceptibility distribution map. Table 1 lists and Figure 1 displays the values used based on the material composition of the model (4,20,21).
Figure 1.
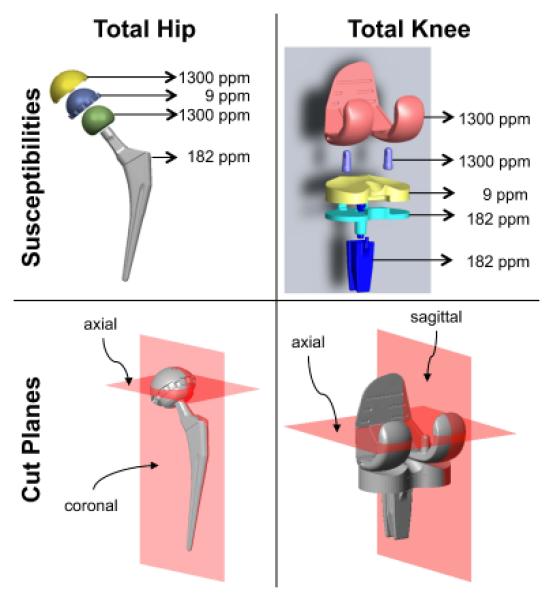
Digital models obtained from manufacturer displayed to visualize the susceptibility values used for each component and also the cut-planes used below for subsequent analysis. Each subcomponent was assigned a material specific susceptibility value. The combination of susceptibility maps produced an overall susceptibility distribution that was used to generate the metal-induced field-maps. The total hip implant consisted of a femoral stem (silver, titanium alloy, Ti-6Al-4V, 182 ppm), femoral head (green, CoCrMo, 1300 ppm), plastic liner (blue, ultra high molecular weight polyethylene, 9 ppm), and acetabular cup (yellow, CoCrMo, 1300 ppm). The total knee implant consisted of a tibial component (cyan and blue, titanium alloy, Ti-6Al-4V, 182 ppm), plastic liner (yellow, ultra high molecular weight polyethylene, 9 ppm), and femoral component (pink, CoCrMo, 1300 ppm).
Table I.
Digital models obtained from the manufacturer.
| Prosthesis | Component | Product | Size (mm) |
Material | Susceptibility (ppm) |
|---|---|---|---|---|---|
| Hip | |||||
| Femoral | Taperloc® Complete High Offset |
10 | Ti-6Al-4V | 182 | |
| Modular Head |
Standard | 36 | CoCrMo | 1300 | |
| Liner | Arcom® Max-rom™ | UHMWPE | 9 | ||
| Acetabular | Ranawat/Burstein® Ringloc® | 54 | Ti-6Al-4V | 182 | |
| Knee | |||||
| Femoral | Vanguard® | 70 | CoCrMo | 1300 | |
| Tibial Tray | Vanguard® Interlok® | 71 | UHMWPE | 9 | |
| Tibial Bearing |
Vanguard® Cruciate Retaining |
12 × 71 | Ti-6Al-4V | 182 | |
| Modular Stem |
I-Beam Modular | 40 | Ti-6Al-4V | 182 | |
| All products from Biomet Inc. (Warsaw, IN) | |||||
| Ti-6A1-4V is a titanium alloy | |||||
| CoCrMo = cobalt-chromium-molybdenum | |||||
| UHMWPE = ultra high molecular weight polyethylene | |||||
Simulating Magnetic Field Inhomogeneity
The magnetic field inhomogeneity (ψ) can be estimated from the susceptibility distribution (χ) according to Salomir et al. (22).
where γ/2π is the gyromagnetic ratio (i.e. 42.58 MHz/T for 1H), B0 is the main magnetic field strength (Tesla), k = [kx, ky, kz] denotes the k-space coordinate, H represents the Hermitian transpose operation, and tilde represents a variable that has undergone three-dimensional Fourier transform. The z-axis is assumed parallel with the bore of the MRI scanner, per usual convention.
This calculation was performed efficiently (without “virtual” zero-padding) as described by Bouwman et al. (23) using Matlab (implementation available on Matlab Central’s file exchange). All simulations in this study at both 1.5T and 3T were performed on a Macbook Pro (2.3 GHz Intel Core i5, 10 GB RAM).
RF Excitation
The metal-induced off-resonance was displayed in two different orientations (Figure 1) for both models. Line plots were also drawn normal to the implant surface in three locations for the hip (superior acetabular cup, lateral femoral head, superior femoral neck) and for the knee (central femoral trochlea, superior posterior femoral condyle, posterior femoral condyle) to improve the depiction of the non-linear off-resonance in different areas adjacent to the metal.
Frequency Encoding
The local induced gradient field was calculated with the spatial gradient of the B0 inhomogeneity field in the readout direction (x, for R/L, for example). The chosen readout direction was S/I for coronal (hip) and sagittal (knee) orientations and R/L for axial orientations of both models. For reference, iso-distance contour lines were overlaid on the gradient maps at 5, 10, and 15 mm from the implant surface. All calculations assumed 320 pixels in the readout dimension, 22.4 cm frequency field-of-view, and ±125 kHz readout bandwidth (ie: 781 Hz/pixel), which is a relatively high readout bandwidth often used for imaging near metal (12).
The hip model was then used to distinguish any gradient map differences if the frequency encoding direction was changed.
Water-Fat Decomposition
Bloch simulations were performed for a spin-echo experiment assuming a one-dimensional voxel with varying fat-fractions (0% - 100%, resolution: 25%) and varying degrees of off-resonance across the voxel (range: 0 ppm – 7.38 ppm, resolution: 0.38 ppm). Off-resonance was simulated as linear across the voxel, modulated by a Gaussian point spread function. Signal for water (0 ppm) and each of the multiple fat peaks (24,25) were simulated separately and subsequently summed. Complex zero-mean Gaussian noise (2048 trials) was added to the simulated signal such that the signal to noise ratio (SNR) at the center of the spin echo was 5, 10, 20, 50, or 100.
Water-fat estimates for each trial were obtained using a non-linear least squares curve-fitting algorithm (lsqnonlin, The Mathworks Inc, Natick, MA) to fit the following signal model:
where Sn = simulated signal, tn = time at sample n relative to the spin echo, ρw,f = water or fat signal, Δfj = frequency offset of the jth fat spectral component relative to water, αj = relative amplitudes of the jth fat spectral component, ψ = off-resonance (Hz) due to the B0 field inhomogeneity, and β = width of the spin echo envelope caused by intravoxel off-resonance. B0 offsets were initialized to the correct value to provide a best-case scenario for water-fat separation.
The mean estimated fat-fraction across all noise trials was subtracted from the true fat-fraction to determine bias. Bias of the fat fraction estimate was plotted against the full-width-at-half-max (in ppm) of the off-resonance at different fat-fractions and SNR values. In order to visualize the spatial distribution of water-fat limitations near metal, a local B0 gradient map was calculated for both hip and knee by taking the difference between the lowest and highest off-resonance frequencies within each voxel.
Results
Figure 2 displays images of the hip prosthesis head (CoCrMo) acquired at ±2 kHz off-resonance at 1.5T with signal at the same spatial locations as the ±4 kHz images at 3T. The dipole signal locations agreed well with simulated field-map. Excellent agreement of the line profiles drawn across the 1.5T and 3T images confirms the assumption of linear magnetization up to 3T that was used in the simulation code used to generate B0 inhomogeneity maps.
Figure 2.
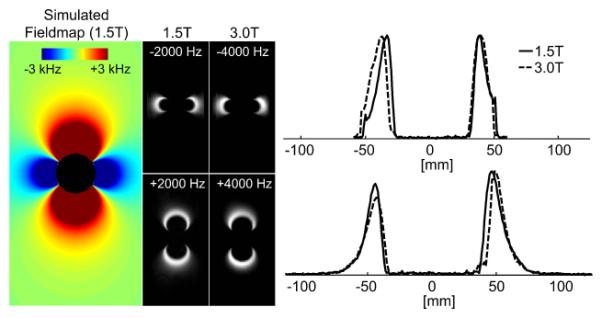
The magnetization of CoCrMo is linear up to 3T based on acquired RF bands at 1.5T (±2000 Hz) and 3.0T (±4000 Hz) with full width half max of 1.5 kHz and 3.0 kHz bandwidth respectively. The bands appear in the same spatial location as demonstrated by the line plots of the normalized signal and agree well with the simulated field-map using a susceptibility value of 1300 ppm.
Figure 3 displays metal-induced field-maps at 1.5T and 3T. For reference, iso-distance contour lines were overlaid on the field-maps at several distances from the implant surface. The color-map was chosen to saturate (rendered black) where off-resonance was greater than the RF excitation range of ±12 kHz used in clinical 3D-MSI protocols such as MAVRIC-SL (7). In the coronal plane, superior to the acetabular cup of the total hip prosthesis, the maximum spatial gap due to lack of excited signal exceeds 5 mm at 1.5T and 10 mm at 3T. The axial plane at the level of the femoral head demonstrates an almost circumferential gap of signal loss of 2-5 mm at 1.5T and 5-10 mm at 3T. For the knee prosthesis, off-resonance outside of the ±12 kHz RF excitation bandwidth reaches ~5 mm from the implant surface only at the superior and posterior aspects of the femoral condyle at 1.5T. At those locations at 3T, the RF excitation gap extends to ~10 mm and becomes more appreciable at many other areas around the total knee prosthesis.
Figure 3.
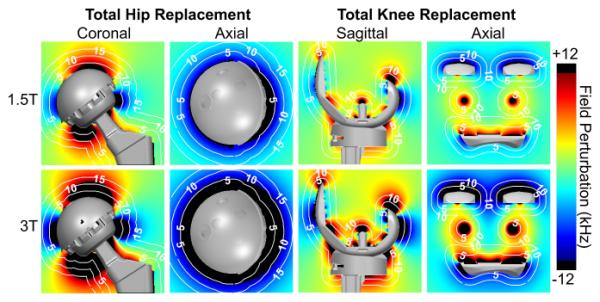
B0 field-maps demonstrate the spatial distribution and magnitude of the off-resonance induced by a total hip implant at 1.5T (top row) and 3T (bottom row). Off-resonance beyond ±12 kHz occurs greater than 5 mm away at 1.5T and 10 mm at 3T from the total hip replacement. Off-resonance beyond ±12 kHz occurs up to 5 mm away at 1.5T and up to 10 mm at 3T from the total knee replacement. Upper and lower limits of the color-map (black) were intentionally chosen to depict the off-resonance that occurs beyond the excitation bandwidth of ±12 kHz, which is the excitation bandwidth typically used by 3D-MSI methods at both 1.5T and 3T. White, dotted contour lines represent labeled iso-distances (mm) from the implant surface.
Figure 4 shows line plots that demonstrate the extreme metal-induced off-resonance. Directly superior to the acetabular cup of the hip prosthesis, the positive off-resonance exceeded +19 kHz at 1.5T and +38 kHz at 3T. Directly lateral to the femoral head, the negative off-resonance was greater than −35 kHz at 1.5T and −70 kHz at 3T. The extremes of off-resonance induced by the hip prosthesis were −70 kHz and +38 kHz located at 0.35 mm from the prosthetic surface at 1.5T. Directly superior to the femoral condyle of the knee prosthesis, off-resonance exceeded 38 kHz at 1.5T and 72 kHz at 3T. Directly posterior to the femoral condyle, the negative off-resonance was greater than −18 kHz at 1.5T and −36 kHz at 3T. The extremes of off-resonance induced by the knee prosthesis were −18 kHz and +38 kHz at 0.35 mm from the prosthetic surface at 1.5T.
Figure 4.
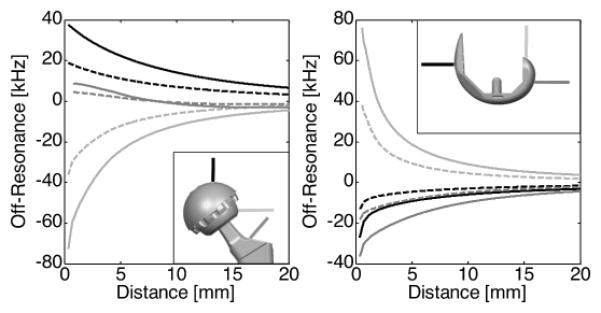
Line plots from regions adjacent to the implant are helpful to visualize the severity of the off-resonance directly adjacent to the implants. Plots represent off-resonance at 1.5T (dotted) and 3.0T (solid) as a function of distance for three different lines perpendicular to the implant surface as shown in the subplots. The lines in the left line-plots represent off-resonance superior to the acetabular cup (black), lateral to the femoral head (light gray), and superior/lateral to the femoral neck (dark gray) of the total hip implant. The lines in the right plot represent off-resonance anterior to the femoral trochlea (black), superior to the posterior femoral condyles (light gray), and posterior to the posterior femoral condyles (dark gray) of the total knee implant.
Local gradient maps in the readout direction (Figure 5) depict regions subject to frequency encoding artifacts (signal loss, signal distortion). The color-map was chosen to saturate (rendered black) when the absolute value of the metal-induced local gradient exceeded the readout gradient (781 Hz/pixel) in the frequency encoding direction. The femoral neck produced an RF excitation gap of less than 5 mm, and almost no frequency encoding artifact (distortion) at 1.5T, but exceeds the readout gradient to greater than 10 mm at 3T. Regions around the knee prosthesis with frequency encoding artifacts were less than 6 mm from the implant surface except around the femoral condyle, which exceeded 5 mm at 1.5T and 10 mm at 3T.
Figure 5.
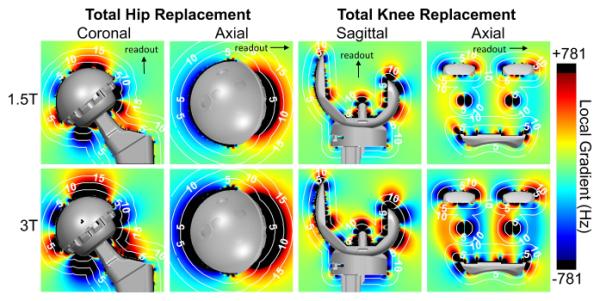
The gradient in the readout direction of the metal-induced B0 field inhomogeneity demonstrates regions limited by frequency encoding artifact. Upper and lower limits of the color-map (black) were chosen to depict the local gradients exceeding a readout gradient of 781 Hz/pixel where significant frequency encoding distortion artifacts would appear. White, dotted contour lines represent labeled iso-distances (mm) from the implant surface.
Figure 6 demonstrates changes in the gradient maps if the frequency encoding direction was altered. Frequency encoding in anterior/posterior (A/P) direction creates minimal regions of signal distortion in the coronal view at a center slice through the prosthesis. The axial view of the A/P frequency encoding direction displays the regions of distortion near the anterior and posterior aspects of the prosthesis.
Figure 6.
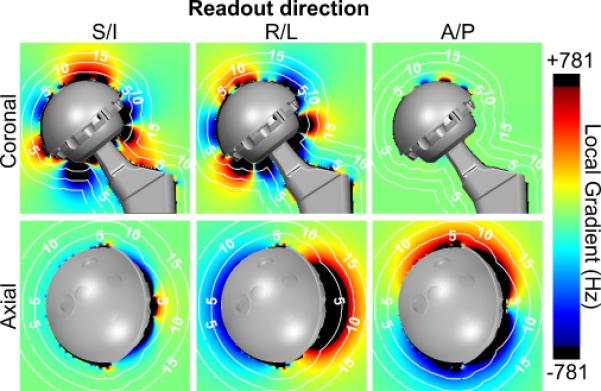
Frequency encoding direction influences the regions of signal distortion for 3D-MSI techniques. Gradient maps are 3D and must be analyzed in multiple planes and orientations to depict this signal loss. Results are shown for 1.5T.
Figure 7a shows spectra of water and fat for intra-voxel off-resonance of 1 ppm, 3.4 ppm and 6.5 ppm. As intra-voxel off-resonance increases, the water and fat spectral peaks broaden. Figure 7b shows the effect of spectral broadening on water-fat separation. For various fat fractions (0-100%) and SNRs (5-100), the mean bias across all noise trials was plotted against intra-voxel off-resonance. For low and moderate intra-voxel off-resonances such as 1ppm and 3.4 ppm, minimal bias was observed over all fat fraction estimates. There was minimal bias because, despite line broadening from the intravoxel dephasing, there is sufficient separation of water and fat peaks (figure 7a), and the simultaneous estimation of T2* decay accounts for this broadening. However, at very high intra-voxel off-resonance such as 6.5 ppm, the water and fat spectra overlap to such a degree that they appear as a single peak, resulting in break-down of water-fat separation and significant bias. Figure 8 depicts regions (shown as black) where the local intra-voxel off-resonance is greater than 6 ppm. The local B0 gradient map is displayed with a color-map that saturates (rendered black) where the local metal-induced gradient field exceeded 6 ppm (383 Hz at 1.5T, 766 Hz at 3T), a threshold value based on the Monte Carlo results. For reference, iso-distance contour lines were overlaid on the gradient maps to indicate distance from the implant surface.
Figure 7.
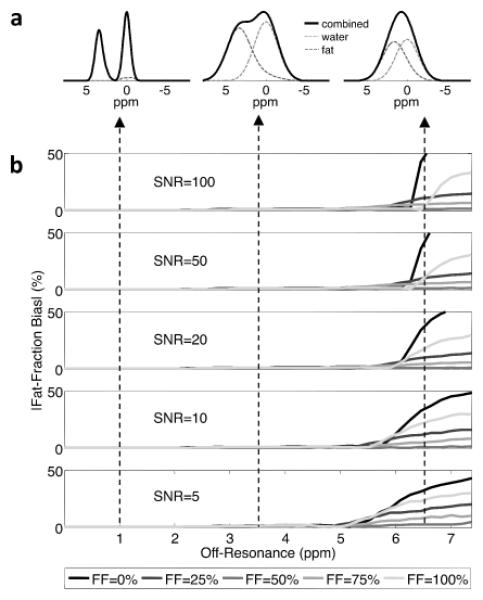
a) Spectral broadening of water and fat peaks due to an intra-voxel off-resonance of 1 ppm, 3.4 ppm and 6.5 ppm. b) Simulations to determine the bias in fat-fraction estimation due to the effects of spectral broadening on water-fat separation. The bias in the estimate fat fraction was plotted against intra-voxel off-resonance for fat fractions ranging from 0 to 100% and SNR values ranging from 5 to 100.
Figure 8.
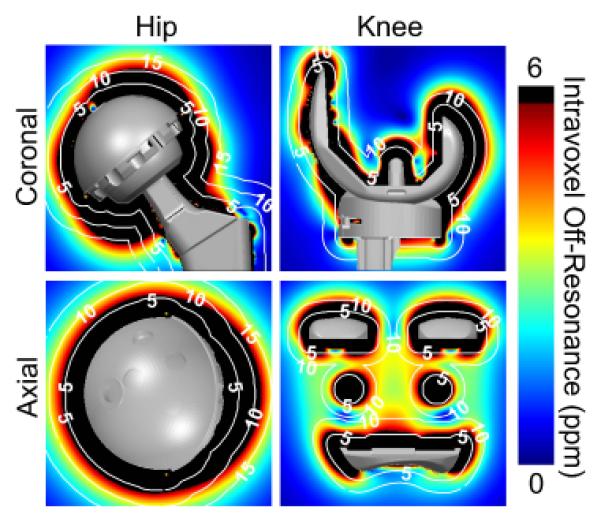
Intra-voxel dephasing due to magnetic field inhomogeneities leads to break-down of chemical shift encoded water-fat separation directly adjacent to metallic prostheses in areas where the gradient of the inhomogeneity is most severe. Based on the results shown in figure 7, upper limits of the color-map (black) were chosen to depict regions where the local intra-voxel off-resonance exceeds 6 ppm (383 Hz at 1.5T, 766 Hz at 3T), the point at which intra-voxel off-resonance causes water-fat separation to break down for SNR = 20. White, dotted contour lines represent labeled iso-distances (mm) from the implant surface.
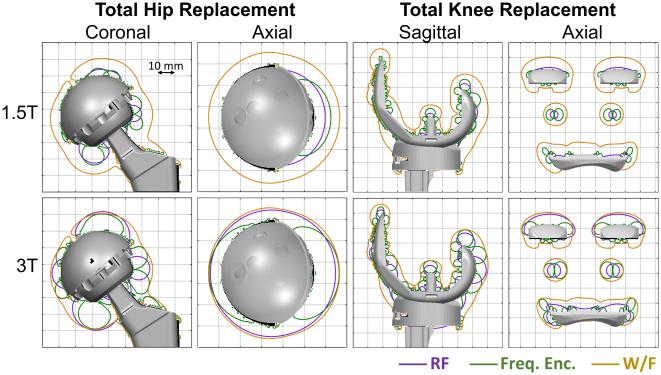
Figure 9 summarizes the spatial limitations due to RF excitation, frequency encoding, and water-fat separation and demonstrates substantial overlap indicating that current 3D-MSI methods would not benefit greatly from using a wider bandwidth to excite off-resonance spins. Frequency encoding regions are similar in spatial extent to the RF excitation gap, but with a slightly different spatial distribution. Water-fat separation fails at a further distance from the implant, indicating that it is more challenging than RF excitation or distortion from frequency encoding artifact.
Figure 9.
Combined results for RF excitation, frequency encoding, and water-fat separation near metal shown to synthesize which factor(s) are most limiting. There is close overlap with regions limited RF excitation and frequency encoding related artifacts. This implies minimal benefit to exciting a wider bandwidth of off-resonance spins for methods such as 3D-MSI that use frequency encoding. Water-fat separation, however, fails farther from the implant, indicating that it is a more limiting challenge than either RF excitation or distortion from frequency encoding artifact due to magnetic field inhomogeneities. Contour lines represent the extent of signal excitation and artifact free imaging using an RF excitation of ±12 kHz, a readout gradient of 781 Hz/pixel, and a 6 ppm intra-voxel off-resonance threshold for water-fat separation. Gridlines are spaced 10 mm apart.
Discussion
In this work, we presented an approach to characterize capabilities of MR imaging near metal with respect to RF excitation, frequency encoding, and water-fat separation. We simulated the off-resonance induced by a total hip and total knee implant at 1.5T and 3T using high-resolution 3D models and material-specific susceptibility values. This framework can be extended to any metallic prosthesis so long as the magnetic susceptibility of the material is known. As shown in this study, off-resonance maps can be produced for prosthetics that consist of multiple components with various materials and susceptibility values.
The approach presented in this study provides a mean to quantify spatial gaps near metallic prostheses that cannot be visualized using standard 3D-MSI imaging parameters. Identification of remaining gaps is clinically relevant because many relevant pathologies, such as infection, loosening and particle disease occur directly adjacent to the metal. Importanly, this study demonstrated that many of the challenging regions for RF excitation and distortion from frequency encoding closely overlap. Importantly, water-fat separation methods will fundamentally fail at a further distance from the implant, indicating that it is more challenging than RF excitation or distortion from frequency encoding artifact due to magnetic field inhomogeneities. We have also demonstrated with experiments that CoCrMo, an alloy with very high susceptibility that is commonly used in metallic implants, displays a linear magnetization at clinical field strengths up to 3T.
Based on the results of our study it appears that current 3D-MSI methods that use frequency encoding would not benefit from exciting a broader range of off-resonance. These results indicate that regions that fall outside of ±12 kHz off-resonance overlap heavily with regions corrupted by frequency encoding related distortion. Therefore, performing RF excitation beyond ±12 kHz with 3D-MSI methods appears to have limited benefit at either 1.5T or 3T.
Fully phase encoded (FPE) techniques may be necessary to image regions very close to the metal (usually within 15 mm) and they must be capable of providing RF excitation beyond ±12 kHz. This presents additional challenge for FPE techniques since they already suffer from long scan times. However, FPE techniques afford some important opportunities that may enable increased RF coverage. FPE avoids frequency encoding and is therefore not limited to narrow excitation bandwidths or high readout bandwidths. For example, much wider RF excitation bands are possible with FPE techniques, although hardware and safety limitations in peak B1 may curb this advantage. Multiband RF excitation that acquires multiple frequency bands simultaneously to increase the off-resonance spectrum of a single acquisition may improve scan efficiency (16). The off-resonance characterized using this approach can aid in making decisions regarding tradeoffs between spatial/frequency coverage and scan time.
This analysis may also be a useful guide for the development of future imaging approaches. For example, based on the off-resonance estimated from simulations, an appropriate RF excitation schedule could be developed to excite signal at a known distance from the surface (e.g. 2 mm away from the implant surface). Another potential area for sequence development is the selection of targeted areas of suspected pathology based on the clinical history of the patient or other imaging studies (eg. radiographs). Off-resonance in those areas can be easily characterized to produce a sequence that only acquires the relevant portions of off-resonance, minimizing the necessary scan to image only those areas of interest.
There are some limitations of this work. Although prior work has shown excellent agreement between the dipole approximation and experimental measurements (26,27), the characterization of B0 inhomogeneities in this study were mostly simulated. In addition, only first-order terms of B0 perturbations were considered in this analysis. Further, this work did not address the challenges associated with gradient switching (28) or B1 effects near metal (29,30). However, we believe that the B0 effects modeled here are relatively accurate and that we have investigated the most challenging aspects of MRI near metal.
An additional limitation is that the linear relationship of induced magnetization with B0 field strength was only measured and confirmed for the femoral head. The exact susceptibility value for the femoral head was unknown, which may account for the minor discrepancies observed between the simulated and measured RF bands. Although it is possible that other materials may experience saturation effects, CoCrMo, which is a commonly used material for implants, is believed to have the highest susceptibility of all materials used for metallic prostheses other than stainless steel (20). For this reason, we believe that it is a good choice for these simulations, and we also assumed that the induced magnetization of CoCrMo used for the simulated knee prosthesis also had a linear dependence on field strength.
Our simulations also examined the effect of spectral broadening of the fat and water peaks due to intra-voxel off-resonance and the effect of this spectral broadening on chemical shift encoded water-fat separation. These simulations assumed that an accurate estimate of the local field-map inhomogeneity can be obtained, providing a best-case scenario for water-fat separation. In practice, however, difficulty in obtaining an accurate estimate of the average field-map may be the limiting factor in water-fat imaging near metallic implants (31-33), although newer pre-initialization approaches that model the local field-map based on known or assumed susceptibility values (34), or approaches that rely primarily on the spectral complexity of fat to calculate the local field-map (35), rather than local field-map smoothness may be helpful.
Future work will incorporate this analysis into the development of new approaches to account for the unique challenges presented by these results. These results will also assist clinical decision-making of tradeoffs between signal coverage and scan time. In addition, this framework can be applied to a broader range of metallic implants of varying shapes, sizes and material composition.
In conclusion, we have presented a characterization of the fundamental MR imaging capabilities around metallic implants with respect to RF excitation, frequency encoding, and water-fat separation. These results demonstrate that increasing the RF excitation bandwidth beyond ±12 kHz will require new methods such as fully phase encoding to excite signal in areas directly adjacent to the metallic implants that cannot be imaged using current 3D-MSI techniques. Simulations such as those presented in this work can be used to provide a benchmark to characterize the shortcomings of current techniques and guide development of future techniques that address these shortcomings.
Acknowledgements
The authors wish to thank Dr. Rick Kijowski for helpful clinical discussions, Biomet Orthopedics for sharing the digital models, and acknowledge support from the NIH (UL1-TR00427, R01 DK083380, R01 DK088925, R01 DK100651) as well GE Healthcare who provides research support to the University of Wisconsin.
References
- 1.Centers for Disease Control National Center for Health Statistics FastStats inpatient surgery. http://wwwcdcgov/nchs/fastats/insurghtm; Accessed February 19, 2013. [Google Scholar]
- 2.Kurtz S, Mowat F, Ong K, Chan N, Lau E, Halpern M. Prevalence of primary and revision total hip and knee arthroplasty in the United States from 1990 through 2002. J Bone Joint Surg Am. 2005;87(7):1487–1497. doi: 10.2106/JBJS.D.02441. [DOI] [PubMed] [Google Scholar]
- 3.Kurtz S, Ong K, Lau E, Mowat F, Halpern M. Projections of primary and revision hip and knee arthroplasty in the United States from 2005 to 2030. J Bone Joint Surg Am. 2007;89(4):780–785. doi: 10.2106/JBJS.F.00222. [DOI] [PubMed] [Google Scholar]
- 4.Schenck JF. The role of magnetic susceptibility in magnetic resonance imaging: MRI magnetic compatibility of the first and second kinds. Med Phys. 1996;23(6):815–850. doi: 10.1118/1.597854. [DOI] [PubMed] [Google Scholar]
- 5.Koch KM, King KF, Carl M, Hargreaves BA. Imaging near metal: The impact of extreme static local field gradients on frequency encoding processes. Magn Reson Med. 2014;71(6):2024–2034. doi: 10.1002/mrm.24862. [DOI] [PubMed] [Google Scholar]
- 6.Bley TA, Wieben O, François CJ, Brittain JH, Reeder SB. Fat and water magnetic resonance imaging. J Magn Reson Imaging. 2010;31(1):4–18. doi: 10.1002/jmri.21895. [DOI] [PubMed] [Google Scholar]
- 7.Koch KM, Brau AC, Chen W, Gold GE, Hargreaves BA, Koff M, McKinnon GC, Potter HG, King KF. Imaging near metal with a MAVRIC-SEMAC hybrid. Magn Reson Med. 2011;65(1):71–82. doi: 10.1002/mrm.22523. [DOI] [PubMed] [Google Scholar]
- 8.Koch KM, Lorbiecki JE, Hinks RS, King KF. A multispectral three-dimensional acquisition technique for imaging near metal implants. Magn Reson Med. 2009;61(2):381–390. doi: 10.1002/mrm.21856. [DOI] [PubMed] [Google Scholar]
- 9.Lu W, Pauly KB, Gold GE, Pauly JM, Hargreaves BA. SEMAC: Slice Encoding for Metal Artifact Correction in MRI. Magn Reson Med. 2009;62(1):66–76. doi: 10.1002/mrm.21967. [DOI] [PMC free article] [PubMed] [Google Scholar]
- 10.Hayter CL, Koff MF, Potter HG. Magnetic resonance imaging of the postoperative hip. J Magn Reson Imaging. 2012;35(5):1013–1025. doi: 10.1002/jmri.23523. [DOI] [PubMed] [Google Scholar]
- 11.Chen CA, Chen W, Goodman SB, Hargreaves BA, Koch KM, Lu W, Brau AC, Draper CE, Delp SL, Gold GE. New MR imaging methods for metallic implants in the knee: artifact correction and clinical impact. J Magn Reson Imaging. 2011;33(5):1121–1127. doi: 10.1002/jmri.22534. [DOI] [PMC free article] [PubMed] [Google Scholar]
- 12.Hayter CL, Koff MF, Shah P, Koch KM, Miller TT, Potter HG. MRI after arthroplasty: comparison of MAVRIC and conventional fast spin-echo techniques. AJR Am J Roentgenol. 2011;197(3):W405–411. doi: 10.2214/AJR.11.6659. [DOI] [PubMed] [Google Scholar]
- 13.Nawabi DH, Hayter CL, Su EP, Koff MF, Perino G, Gold SL, Koch KM, Potter HG. Magnetic resonance imaging findings in symptomatic versus asymptomatic subjects following metal-on-metal hip resurfacing arthroplasty. J Bone Joint Surg Am. 2013;95(10):895–902. doi: 10.2106/JBJS.K.01476. [DOI] [PubMed] [Google Scholar]
- 14.Cho ZH, Kim DJ, Kim YK. Total inhomogeneity correction including chemical shifts and susceptibility by view angle tilting. Med Phys. 1988;15(1):7–11. doi: 10.1118/1.596162. [DOI] [PubMed] [Google Scholar]
- 15.Artz NS, Hernando D, Taviani V, Samsonov A, Brittain JH, Reeder SB. Spectrally resolved fully phase-encoded three-dimensional fast spin-echo imaging. Magn Reson Med. 2013 doi: 10.1002/mrm.24704. doi: 10.1002/mrm.24704. [DOI] [PMC free article] [PubMed] [Google Scholar]
- 16.Artz N, Smith M, Reeder S. Multiband RF Excitation for Accelerating Magnetic Resonance Imaging in the Presence of Metal; Proceedings of the 22nd Annual Meeting of the ISMRM; Milan, Italy. 2014. p. 650. [Google Scholar]
- 17.Smith MR, Artz NS, Koch KM, Samsonov A, Reeder SB. Accelerating sequences in the presence of metal by exploiting the spatial distribution of off-resonance. Magn Reson Med. 2014 doi: 10.1002/mrm.25087. doi: 10.1002/mrm.25087. [DOI] [PMC free article] [PubMed] [Google Scholar]
- 18.Lustig M, Donoho D, Pauly JM. Sparse MRI: The application of compressed sensing for rapid MR imaging. Magn Reson Med. 2007;58(6):1182–1195. doi: 10.1002/mrm.21391. [DOI] [PubMed] [Google Scholar]
- 19.Griswold MA, Jakob PM, Heidemann RM, Nittka M, Jellus V, Wang J, Kiefer B, Haase A. Generalized autocalibrating partially parallel acquisitions (GRAPPA) Magn Reson Med. 2002;47(6):1202–1210. doi: 10.1002/mrm.10171. [DOI] [PubMed] [Google Scholar]
- 20.Bartusek K, Dokoupil Z, Gescheidtova E. Magnetic field mapping around metal implants using an asymmetric spin-echo MRI sequence. Measurement Science and Technology. 2006;17(12):3293. [Google Scholar]
- 21.Koch KM, Hargreaves BA, Pauly KB, Chen W, Gold GE, King KF. Magnetic resonance imaging near metal implants. J Magn Reson Imaging. 2010;32(4):773–787. doi: 10.1002/jmri.22313. [DOI] [PubMed] [Google Scholar]
- 22.Salomir R, de Senneville BD, Moonen CTW. A fast calculation method for magnetic field inhomogeneity due to an arbitrary distribution of bulk susceptibility. Concepts in Magnetic Resonance Part B: Magnetic Resonance Engineering. 2003;19B(1):26–34. [Google Scholar]
- 23.Bouwman JG, Bakker CJ. Alias subtraction more efficient than conventional zero-padding in the Fourier-based calculation of the susceptibility induced perturbation of the magnetic field in MR. Magn Reson Med. 2012;68(2):621–630. doi: 10.1002/mrm.24343. [DOI] [PubMed] [Google Scholar]
- 24.Hamilton G, Yokoo T, Bydder M, Cruite I, Schroeder ME, Sirlin CB, Middleton MS. In vivo characterization of the liver fat ¹H MR spectrum. NMR Biomed. 2011;24(7):784–790. doi: 10.1002/nbm.1622. [DOI] [PMC free article] [PubMed] [Google Scholar]
- 25.Yu H, Shimakawa A, McKenzie CA, Brodsky E, Brittain JH, Reeder SB. Multiecho water-fat separation and simultaneous R2* estimation with multifrequency fat spectrum modeling. Magn Reson Med. 2008;60(5):1122–1134. doi: 10.1002/mrm.21737. [DOI] [PMC free article] [PubMed] [Google Scholar]
- 26.Koch KM, Papademetris X, Rothman DL, de Graaf RA. Rapid calculations of susceptibility-induced magnetostatic field perturbations for in vivo magnetic resonance. Phys Med Biol. 2006;51(24):6381–6402. doi: 10.1088/0031-9155/51/24/007. [DOI] [PubMed] [Google Scholar]
- 27.Koch KM, King KF, Carl M, Hargreaves BA. Imaging near metal: The impact of extreme static local field gradients on frequency encoding processes. Magn Reson Med. 2014 Jun;71(6):2024–34. doi: 10.1002/mrm.24862. [DOI] [PubMed] [Google Scholar]
- 28.Graf H, Steidle G, Martirosian P, Lauer UA, Schick F. Metal artifacts caused by gradient switching. Magn Reson Med. 2005;54(1):231–234. doi: 10.1002/mrm.20524. [DOI] [PubMed] [Google Scholar]
- 29.Graf H, Lauer UA, Berger A, Schick F. RF artifacts caused by metallic implants or instruments which get more prominent at 3 T: an in vitro study. Magn Reson Imaging. 2005;23(3):493–499. doi: 10.1016/j.mri.2004.12.009. [DOI] [PubMed] [Google Scholar]
- 30.Bachschmidt T, Jakob P, Vester M, Nistler J, Nittka M. Polarized multi-channel transmit MRI to reduce B1-shading near metal implants; Proceedings of the 22nd Annual Meeting of the ISMRM; Milan, Italy. 2014. p. 1675. [Google Scholar]
- 31.Yu H, Reeder SB, Shimakawa A, Brittain JH, Pelc NJ. Field map estimation with a region growing scheme for iterative 3-point water-fat decomposition. Magn Reson Med. 2005;54(4):1032–1039. doi: 10.1002/mrm.20654. [DOI] [PubMed] [Google Scholar]
- 32.Tsao J, Jiang Y. Hierarchical IDEAL: fast, robust, and multiresolution separation of multiple chemical species from multiple echo times. Magn Reson Med. 2013;70(1):155–159. doi: 10.1002/mrm.24441. [DOI] [PubMed] [Google Scholar]
- 33.Hernando D, Haldar JP, Sutton BP, Ma J, Kellman P, Liang ZP. Joint estimation of water/fat images and field inhomogeneity map. Magn Reson Med. 2008;59(3):571–580. doi: 10.1002/mrm.21522. [DOI] [PMC free article] [PubMed] [Google Scholar]
- 34.Sharma SD, Artz NS, Hernando D, Horng DE, Reeder SB. Improving chemical shift encoded water-fat separation using object-based information of the magnetic field inhomogeneity. Magn Reson Med. 2014 doi: 10.1002/mrm.25163. doi: 10.1002/mrm.25163. [DOI] [PMC free article] [PubMed] [Google Scholar]
- 35.Yu H, Reeder SB, Shimakawa A, McKenzie CA, Brittain JH. Robust multipoint water-fat separation using fat likelihood analysis. Magn Reson Med. 2012;67(4):1065–1076. doi: 10.1002/mrm.23087. [DOI] [PMC free article] [PubMed] [Google Scholar]


