

Abstract
The predominantly African origin of all modern human populations is well established, but the route taken out of Africa is still unclear. Two alternative routes, via Egypt and Sinai or across the Bab el Mandeb strait into Arabia, have traditionally been proposed as feasible gateways in light of geographic, paleoclimatic, archaeological, and genetic evidence. Distinguishing among these alternatives has been difficult. We generated 225 whole-genome sequences (225 at 8× depth, of which 8 were increased to 30×; Illumina HiSeq 2000) from six modern Northeast African populations (100 Egyptians and five Ethiopian populations each represented by 25 individuals). West Eurasian components were masked out, and the remaining African haplotypes were compared with a panel of sub-Saharan African and non-African genomes. We showed that masked Northeast African haplotypes overall were more similar to non-African haplotypes and more frequently present outside Africa than were any sets of haplotypes derived from a West African population. Furthermore, the masked Egyptian haplotypes showed these properties more markedly than the masked Ethiopian haplotypes, pointing to Egypt as the more likely gateway in the exodus to the rest of the world. Using five Ethiopian and three Egyptian high-coverage masked genomes and the multiple sequentially Markovian coalescent (MSMC) approach, we estimated the genetic split times of Egyptians and Ethiopians from non-African populations at 55,000 and 65,000 years ago, respectively, whereas that of West Africans was estimated to be 75,000 years ago. Both the haplotype and MSMC analyses thus suggest a predominant northern route out of Africa via Egypt.
Main Text
The routes followed by fully modern humans as they expanded out of Africa 50,000–100,000 years ago into Eurasia have long been a central question of anthropology1 and have important implications for understanding the evolutionary history of all non-African populations. So far, neither fossil and archaeological2–4 nor genetic5,6 evidence has been able to distinguish between an exit through Egypt and Sinai (northern route)7 or one through Ethiopia, the Bab el Mandeb strait, and the Arabian Peninsula (southern route).8–10 Genetic evidence has more often been interpreted as favoring a southern route,5,6,9 although the Neandertal admixture present in all non-Africans11 is more readily explained by a northern route given that Neandertal fossils are currently known from the Levant, but not from the southern part of the Arabian Peninsula.12 Thus, the available evidence remains inconclusive. Information to discriminate between the northern and southern routes might still be present in Africa within the full genomes of the populations inhabiting modern Egypt and the Horn of Africa, and thus further investigation is warranted. However, although it might not be easy to extract this information because of the past and recent genetic introgression experienced by these populations,13,14 full sequences of Northeast African genomes would provide the best starting point for these and other analyses.
To improve our understanding of the African gene pool that might have been ancestral to the out-of-Africa (OOA) dispersal, we sequenced the genomes of a random sample of 100 Egyptians and 125 individuals from five Ethiopian populations (25 each from Amhara, Oromo, Ethiopian Somali, Wolayta, and Gumuz) to an average depth of 8× by using an Illumina HiSeq 2000, and we analyzed these data within the context of similar data generated by the 1000 Genomes Project.15 Sample collection, export, and analysis were approved by University College London research ethics committee 0489/002, Ethiopian Ministry of Science and Technology approval no. 310/538/04, and Lebanese American University institutional review board SMPZ121307-2 (see Supplemental Data for additional information). The overall genetic landscape emerging from the sequencing data (Table S1) refines current knowledge of the high diversity in the Ethiopian region. Sequence data avoid the effect of ascertainment bias that one encounters when dealing with SNP arrays from the same populations (Figure S1). If the northern route was the predominant path followed by the ancestors of the OOA populations, and modern African populations are representative of those at the time of the exit, Egyptians should be genetically more similar to modern non-Africans. Conversely, if the southern route was the main way out of Africa, Ethiopians should be closest to the OOA populations. However, extensive historical and genetic data show that recent gene flow has drastically influenced the genomes of present-day Egyptians and Ethiopians.13,14,16 To minimize the confounding effect of this gene flow back to Africa while testing this hypothesis, we first identified and then masked the recent non-African ancestry in the Ethiopian and Egyptian genomes.
Using ADMIXTURE17 and principal-component analysis (PCA)18 (Figure 1A), we estimated the average proportion of non-African ancestry in the Egyptians to be 80% and dated the midpoint of the admixture event by using ALDER20 to around 750 years ago (Table S2), consistent with the Islamic expansion and dates reported previously.13,14 The Ethiopian populations showed, as expected, a more variable spectrum of genetic introgression (Figure 1B). Consistent with previous reports,13 the Amhara and Oromo were shown to have around 50% of their genome derived from non-Africans, the introgressed proportion in the Somali and Wolayta amounted to 40%–30%, and the Gumuz showed negligible amounts of non-African admixture. The date of the midpoint of these admixture events was 2,500–3,000 years ago (Table S2), although one notable exception was the Oromo, who have shown evidence of multiple admixture events.21 These conclusions are consistent with previous reports13,21 and fit with linguistic records.22 Furthermore, the distribution of maternal (mtDNA) and paternal (Ychr) lineages revealed sex-biased admixture patterns in Ethiopians (Figure S2), such that there was less male-mediated than female-mediated Middle Eastern backflow. The affinity of the Egyptian African component with the modern East and West African populations (green component in Figure 1B, K = 5) could be due to either a continuity of human presence in the area or recent gene flow from neighboring African regions resulting from demographic processes and slave trade over the last two millennia.23
Figure 1.
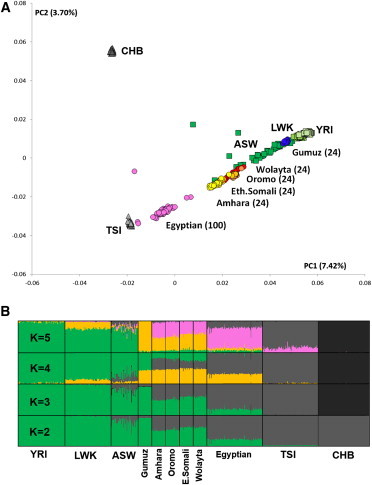
PCA and ADMIXTURE Analysis
PCA (A) and ADMIXTURE analysis (B) of the newly sequenced samples (Egyptian, pink; Amhara, yellow; Oromo and Ethiopian Somali, light orange; Wolayta, red; and Gumuz, blue) and a subset of 1000 Genomes samples (CHB, dark gray; TSI, light gray; ASW [African ancestry in Southwest USA], green; and LWK [Luhya in Webuye, Kenya] and YRI, light green). ADMIXTURE was run with different values of K (K = 5 was the smallest cross-validation error). The top ADMIXTURE plot shows five ancestral components tentatively describable as West African (green), East African (orange), European (light gray), East Asian (dark gray), and putatively Middle Eastern (pink). The phased and imputed genotypes from the low-coverage sequences were processed with PLINK19 for the removal of variants with a minor allele frequency < 1% (--maf 0.01 --geno 0.01) and pairwise linkage disequilibrium above 0.1 (--indep-pairwise 50 10 0.1). The pruned dataset was then analyzed by ADMIXTURE17 with the --cv option for assessing the most plausible value of K and also by PCA.18 The proportion of the total variance explained by each principal component is reported as a percentage next to each axis label.
In order to filter out, through masking, the Eurasian portion identified in this way, we phased the samples by using ShapeIT24 and processed them with PCAdmix.25 In the masking process, Europeans (CEU [Utah residents with ancestry from northern and western Europe from the CEPH collection])15 were used as a proxy for the non-African component, and the Gumuz (the Ethiopian population showing minimal introgression) were used as a proxy for the African component. Pairwise FST26 was calculated before and after the masking process (Table S3), highlighting the expected trend of increased distance of the admixed populations from non-Africans when we retained only their African component. After we excluded the Gumuz themselves from the subsequent analyses, we compared the African components of the masked Ethiopian and Egyptian genomes (hereafter referred to as the Ethiopian′ and Egyptian′ genomes, respectively) with a set of West African (YRI [Yoruba in Ibadan, Nigeria]) and OOA populations spanning Eurasia (East Asian CHB [Han Chinese in Beijing, China], European TSI [Toscani in Italia] and CEU [Figure 2], and South Asian GIH [Gujarati Indians in Houston, Texas] [Figure S6]) in order to look for a signature of the OOA migration. Such a signature was defined as a higher similarity between the Ethiopian′ or Egyptian′ genomes and the non-Africans than between the latter and the YRI. If we assume a stepwise differentiation out of Africa, and if the preferential route followed was the northern one, Egyptian′ samples should share the highest number of haplotypes with the Eurasian samples even after recent events of introgression are controlled for. Conversely, Ethiopian′ samples would show the highest haplotype sharing with the Eurasian samples if the southern route was preferentially followed during the OOA migration. We restricted this comparison to 18,114 genomic regions (spanning a total length of 7.1 Mb; Figure S5) containing haplotypes shared by Europeans and Asians because these were likely to predate the split between these populations. Given the broad occurrence of these regions outside Africa, we could rule out positive selection as a plausible driver of the observed linkage-disequilibrium (LD) pattern. We identified these regions by calculating LD blocks in a set of 457 non-African samples. We retrieved 41,141 haplotypes at these loci in the Egyptian′, Ethiopian′, or YRI samples (Figure 2A) and used them to estimate the genetic similarity between OOA populations CHB and TSI and each of the three African populations. 85% of the haplotypes were present in all three African populations and were discarded as non-informative. The remaining 15% of haplotypes were instead observed in only one or two African populations. For these haplotypes that could discriminate between the African populations, the combined CHB and TSI samples showed more Egyptian′-specific (1.25-fold, p = 2 × 10⁻⁶) and Ethiopian′- and Egyptian′-specific (hereafter Ethiopian′|Egyptian′-specific) (1.15-fold, p = 9 × 10⁻⁶) haplotypes than did any of the other African haplotype sets (Figure 2B). We further explored the observed enrichment of Egyptian′ haplotypes in the CHB and TSI samples by investigating the frequency of each class of haplotype in the combined CHB and TSI samples, and again, the frequencies of Egyptian′-specific and Egyptian′|Ethiopian′-specific haplotypes were highest (Figures 2C and 2D). The enrichment of Egyptian′ haplotypes in the genetic pool of the CHB and TSI samples points to a northern migration as the greater contributor to populations outside Africa.
Figure 2.
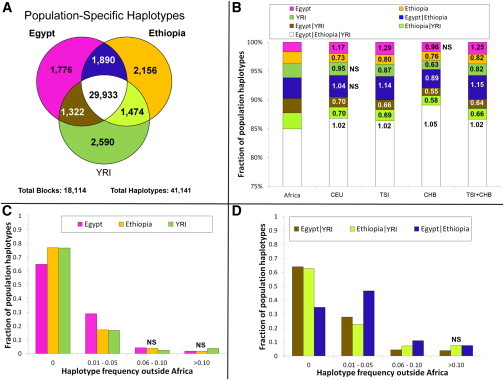
Haplotype Sharing between African and Non-African Populations
The 41,141 African haplotypes retrieved from 18,114 LD regions outside Africa were grouped according to the population of discovery (A). The haplotype composition of African and non-African (CHB + TSI) populations (B) showed more Egyptian′ (pink) and Egyptian′|Ethiopian′ (blue)-specific haplotypes in the OOA samples (relative increases from the general African population are provided for each colored section) than did the haplotype composition of the combined African populations. Non-significant (χ2i) comparisons are labeled “NS.” Of the haplotypes specific to a single African population, the Egyptian′ haplotypes (pink) showed the highest population frequency outside Africa (C), whereas the Egyptian′|Ethiopian′ haplotypes (blue) were the most frequent of those shared by two African populations (D). Bars not significantly different (tested with χ2i) from the Egyptian′ (C) or Ethiopian′|Egyptian′ (D) ones are labeled “NS.” The first bin in (C) and (D) shows the proportion of African haplotypes not present outside Africa.
This finding was robust to a wide range of potential artifacts stemming from uncertainties in the masking process (Figures S3, S4, and S6A; Table S4; note particularly the false-positive rate displayed in column 8) and was replicated in a South Asian population (GIH; Figure S6B). Furthermore, we showed with simulations that the error rate present in the masking process (Table S4) was unlikely to affect our findings (Figures S4 and S6). Even when we added a 10% misclassification error to the Ethiopians, Egyptians held as the African population showing the highest affinity to non-Africans. Alternative scenarios involving early back-to-Africa migrations27 as the source of haplotype sharing between Egyptian′ and non-African samples were considered as sources of the observed pattern. However, such confounding backflow would need to have taken place prior to the split between East Asians and Europeans (ca. ∼40,000 years ago) and, if this genetic component originated from the main OOA founding event, is likely to have been removed by the non-African masking procedure, which was designed for this purpose.
To provide an independent test of our finding, we analyzed three Egyptian and five Ethiopian high-coverage genomes with the multiple sequentially Markovian coalescent (MSMC) approach before and after masking and compared them with a set of publicly available high-coverage genomes.15,28 MSMC,29 an extension of the PSMC30 method to two or four genomes, estimates the split time between pairs of genomes. Consistent with their admixed nature, the split times of the non-masked Egyptians and the mixed Ethiopians from Europeans (CEU) and West Africans (YRI) were much closer to each other than to the same split times measured in the non-admixed Ethiopian population (Gumuz) (Figure 3; Figure S7). If we consider the genetic split between two populations as a process gradually occurring over thousands of years, two independent splits might show partial overlaps when their midpoints are less than a few thousand years apart. Keeping in mind this potential confounder, the Ethiopian′ and Egyptian′ genomes showed different patterns. In particular, the Egyptian′ genomes displayed a more recent split from both the West African (21,000 years ago) and the non-African (55,000 years ago) genomes than did the Ethiopian′ genomes (37,000 and 65,000 years ago, respectively). This suggests a higher similarity between non-African and Egyptian′ components than between non-African and Ethiopian′ components, which is consistent with the fact that Egypt is the last stop on the way out of Africa. Such split dates21 also hint at a recent interaction between Egyptians and West Africans (Figure 3).
Figure 3.
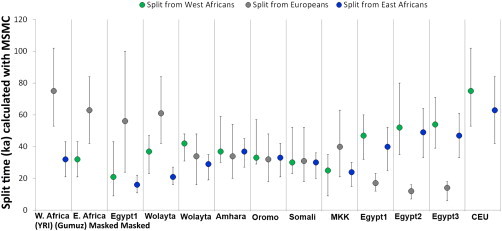
Inferred Split Times between Pairs of High-Coverage Genomes
MSMC-inferred genetic split times of a set of five Ethiopian, three Egyptian, one Maasai, one European (CEU), and one West African (YRI) randomly chosen genome from Europeans, West Africans, and East Africans (Gumuz). One Egyptian (Egypt1) and one Ethiopian (Wolayta) genome were analyzed also after their non-African component was masked out. The split time between two genomes is defined as the time when the cross-coalescence rate dropped to 50%. Cross-coalescence rates of 75% and 25% are shown by the top and bottom bars, respectively, providing references for the putative beginning and end, respectively, of the population split event. The space covered by each vertical line is therefore intended to provide a “time range” when the population split might have occurred, thus showing the split between populations as a slow rather than an instantaneous phenomenon.
In conclusion, the analysis of Ethiopian′ and Egyptian′ whole-genome sequence data identifies modern Egyptians as the African population whose genome and haplotype frequency most closely resemble those of non-African populations. The fact that we could identify in Egyptians an African genomic component that is distinct from West and East African components further supports a minor degree of population continuity in Egypt since the OOA dispersal. These findings point to the northern route as the preferential direction taken out of Africa. In doing this, they resolve the puzzles of archaeological similarities and Neandertal admixture, which are readily accommodated by a northern-exit model, but not by a southern exit, and fit well with the recent discovery of human remains dating to around 55,000 years ago in Israel (close to the northern route).31 Furthermore, the data generated here provide a better source of information for spatially explicit demographic models.32,33 Our analysis does not address controversies about the timing and possible complexities of the expansion out of Africa and highlights the need for further analyses, ideally including ancient DNA, as well as Near Eastern and Papuan or Australian genomes representative of an early coastal expansion, to further resolve these issues.
Acknowledgments
The authors would like to acknowledge all the donors who kindly contributed samples to this study. L.P., S.S., D.G., P.D., Y.C., Y.X., M.H., R.D., and C.T.-S. were funded by Wellcome Trust grant 098051. T.K. was funded by European Research Council (ERC) Starting Grant FP7-261213, and D.L. was funded by ERC Advanced Grant FP7-295733. R.D. is a founder and non-executive director of Congenica. N.B. is the senior trustee, settlor, and principal donor of Melford Charitable Trust and the director and beneficial owner of the entire share capital of Cordell Homes, a company that provided the financial support for the collection of the Ethiopian samples analyzed in this paper.
Published: May 28, 2015
Footnotes
This is an open access article under the CC BY-NC-ND license (http://creativecommons.org/licenses/by-nc-nd/4.0/).
Accession Numbers
The European Genome-phenome Archive (EGA) accession numbers for the Egyptian and Ethiopian sequences reported in this paper are EGA: EGAS00001000480 (Egyptian low coverage), EGAS00001000482 (Egyptian high coverage), EGAS00001000238 (Ethiopian low coverage), EGAS00001000237 (Ethiopian high coverage). SNPchip data (.bed, .bim, and .fam) and called genotype files (.vcf) are available from the corresponding author upon request.
Supplemental Data
Web Resources
The URL for data presented in this paper is as follows:
European Genome-phenome Archive (EGA), https://www.ebi.ac.uk/ega/home
References
- 1.Jobling M.A., Hollox E., Hurles M., Kivisild T., Tyler-Smith C. Garland Science; New York: 2013. Human evolutionary genetics. [Google Scholar]
- 2.Armitage S.J., Jasim S.A., Marks A.E., Parker A.G., Usik V.I., Uerpmann H.P. The southern route “out of Africa”: evidence for an early expansion of modern humans into Arabia. Science. 2011;331:453–456. doi: 10.1126/science.1199113. [DOI] [PubMed] [Google Scholar]
- 3.Petraglia M.D., Haslam M., Fuller D.Q., Boivin N., Clarkson C. Out of Africa: new hypotheses and evidence for the dispersal of Homo sapiens along the Indian Ocean rim. Ann. Hum. Biol. 2010;37:288–311. doi: 10.3109/03014461003639249. [DOI] [PubMed] [Google Scholar]
- 4.Stringer C.B., Grün R., Schwarcz H.P., Goldberg P. ESR dates for the hominid burial site of Es Skhul in Israel. Nature. 1989;338:756–758. doi: 10.1038/338756a0. [DOI] [PubMed] [Google Scholar]
- 5.Soares P., Alshamali F., Pereira J.B., Fernandes V., Silva N.M., Afonso C., Costa M.D., Musilová E., Macaulay V., Richards M.B. The Expansion of mtDNA Haplogroup L3 within and out of Africa. Mol. Biol. Evol. 2012;29:915–927. doi: 10.1093/molbev/msr245. [DOI] [PubMed] [Google Scholar]
- 6.Quintana-Murci L., Semino O., Bandelt H.J., Passarino G., McElreavey K., Santachiara-Benerecetti A.S. Genetic evidence of an early exit of Homo sapiens sapiens from Africa through eastern Africa. Nat. Genet. 1999;23:437–441. doi: 10.1038/70550. [DOI] [PubMed] [Google Scholar]
- 7.Campbell M.C., Tishkoff S.A. African genetic diversity: implications for human demographic history, modern human origins, and complex disease mapping. Annu. Rev. Genomics Hum. Genet. 2008;9:403–433. doi: 10.1146/annurev.genom.9.081307.164258. [DOI] [PMC free article] [PubMed] [Google Scholar]
- 8.Cavalli-Sforza L.L., Menozzi P., Piazza A. Princeton University Press; Princeton, N.J.: 1994. The history and geography of human genes. [Google Scholar]
- 9.Cavalli-Sforza L.L., Piazza A., Menozzi P., Mountain J. Reconstruction of human evolution: bringing together genetic, archaeological, and linguistic data. Proc. Natl. Acad. Sci. USA. 1988;85:6002–6006. doi: 10.1073/pnas.85.16.6002. [DOI] [PMC free article] [PubMed] [Google Scholar]
- 10.Lahr M., Foley R. Multiple Dispersals and Modern Human Origin. Evol. Anthropol. 1994;3:48–60. [Google Scholar]
- 11.Green R.E., Krause J., Briggs A.W., Maricic T., Stenzel U., Kircher M., Patterson N., Li H., Zhai W., Fritz M.H. A draft sequence of the Neandertal genome. Science. 2010;328:710–722. doi: 10.1126/science.1188021. [DOI] [PMC free article] [PubMed] [Google Scholar]
- 12.Krause J., Orlando L., Serre D., Viola B., Prüfer K., Richards M.P., Hublin J.J., Hänni C., Derevianko A.P., Pääbo S. Neanderthals in central Asia and Siberia. Nature. 2007;449:902–904. doi: 10.1038/nature06193. [DOI] [PubMed] [Google Scholar]
- 13.Pagani L., Kivisild T., Tarekegn A., Ekong R., Plaster C., Gallego Romero I., Ayub Q., Mehdi S.Q., Thomas M.G., Luiselli D. Ethiopian genetic diversity reveals linguistic stratification and complex influences on the Ethiopian gene pool. Am. J. Hum. Genet. 2012;91:83–96. doi: 10.1016/j.ajhg.2012.05.015. [DOI] [PMC free article] [PubMed] [Google Scholar]
- 14.Henn B.M., Botigué L.R., Gravel S., Wang W., Brisbin A., Byrnes J.K., Fadhlaoui-Zid K., Zalloua P.A., Moreno-Estrada A., Bertranpetit J. Genomic ancestry of North Africans supports back-to-Africa migrations. PLoS Genet. 2012;8:e1002397. doi: 10.1371/journal.pgen.1002397. [DOI] [PMC free article] [PubMed] [Google Scholar]
- 15.Abecasis G.R., Auton A., Brooks L.D., DePristo M.A., Durbin R.M., Handsaker R.E., Kang H.M., Marth G.T., McVean G.A., 1000 Genomes Project Consortium An integrated map of genetic variation from 1,092 human genomes. Nature. 2012;491:56–65. doi: 10.1038/nature11632. [DOI] [PMC free article] [PubMed] [Google Scholar]
- 16.Haber M., Gauguier D., Youhanna S., Patterson N., Moorjani P., Botigué L.R., Platt D.E., Matisoo-Smith E., Soria-Hernanz D.F., Wells R.S. Genome-wide diversity in the levant reveals recent structuring by culture. PLoS Genet. 2013;9:e1003316. doi: 10.1371/journal.pgen.1003316. [DOI] [PMC free article] [PubMed] [Google Scholar]
- 17.Alexander D.H., Novembre J., Lange K. Fast model-based estimation of ancestry in unrelated individuals. Genome Res. 2009;19:1655–1664. doi: 10.1101/gr.094052.109. [DOI] [PMC free article] [PubMed] [Google Scholar]
- 18.Price A.L., Patterson N.J., Plenge R.M., Weinblatt M.E., Shadick N.A., Reich D. Principal components analysis corrects for stratification in genome-wide association studies. Nat. Genet. 2006;38:904–909. doi: 10.1038/ng1847. [DOI] [PubMed] [Google Scholar]
- 19.Purcell S., Neale B., Todd-Brown K., Thomas L., Ferreira M.A., Bender D., Maller J., Sklar P., de Bakker P.I., Daly M.J., Sham P.C. PLINK: a tool set for whole-genome association and population-based linkage analyses. Am. J. Hum. Genet. 2007;81:559–575. doi: 10.1086/519795. [DOI] [PMC free article] [PubMed] [Google Scholar]
- 20.Loh P.R., Lipson M., Patterson N., Moorjani P., Pickrell J.K., Reich D., Berger B. Inferring admixture histories of human populations using linkage disequilibrium. Genetics. 2013;193:1233–1254. doi: 10.1534/genetics.112.147330. [DOI] [PMC free article] [PubMed] [Google Scholar]
- 21.Pickrell J.K., Patterson N., Loh P.R., Lipson M., Berger B., Stoneking M., Pakendorf B., Reich D. Ancient west Eurasian ancestry in southern and eastern Africa. Proc. Natl. Acad. Sci. USA. 2014;111:2632–2637. doi: 10.1073/pnas.1313787111. [DOI] [PMC free article] [PubMed] [Google Scholar]
- 22.Kitchen A., Ehret C., Assefa S., Mulligan C.J. Bayesian phylogenetic analysis of Semitic languages identifies an Early Bronze Age origin of Semitic in the Near East. Proc. Biol. Sci. 2009;276:2703–2710. doi: 10.1098/rspb.2009.0408. [DOI] [PMC free article] [PubMed] [Google Scholar]
- 23.Serjeant G.R. Sickle-cell disease. Lancet. 1997;350:725–730. doi: 10.1016/S0140-6736(97)07330-3. [DOI] [PubMed] [Google Scholar]
- 24.Delaneau O., Marchini J., Zagury J.F. A linear complexity phasing method for thousands of genomes. Nat. Methods. 2012;9:179–181. doi: 10.1038/nmeth.1785. [DOI] [PubMed] [Google Scholar]
- 25.Brisbin A., Bryc K., Byrnes J., Zakharia F., Omberg L., Degenhardt J., Reynolds A., Ostrer H., Mezey J.G., Bustamante C.D. PCAdmix: principal components-based assignment of ancestry along each chromosome in individuals with admixed ancestry from two or more populations. Hum. Biol. 2012;84:343–364. doi: 10.3378/027.084.0401. [DOI] [PMC free article] [PubMed] [Google Scholar]
- 26.Wright S. Evolution in Mendelian Populations. Genetics. 1931;16:97–159. doi: 10.1093/genetics/16.2.97. [DOI] [PMC free article] [PubMed] [Google Scholar]
- 27.Hodgson J.A., Mulligan C.J., Al-Meeri A., Raaum R.L. Early back-to-Africa migration into the Horn of Africa. PLoS Genet. 2014;10:e1004393. doi: 10.1371/journal.pgen.1004393. [DOI] [PMC free article] [PubMed] [Google Scholar]
- 28.Drmanac R., Sparks A.B., Callow M.J., Halpern A.L., Burns N.L., Kermani B.G., Carnevali P., Nazarenko I., Nilsen G.B., Yeung G. Human genome sequencing using unchained base reads on self-assembling DNA nanoarrays. Science. 2010;327:78–81. doi: 10.1126/science.1181498. [DOI] [PubMed] [Google Scholar]
- 29.Schiffels S., Durbin R. Inferring human population size and separation history from multiple genome sequences. Nat. Genet. 2014;46:919–925. doi: 10.1038/ng.3015. [DOI] [PMC free article] [PubMed] [Google Scholar]
- 30.Li H., Durbin R. Inference of human population history from individual whole-genome sequences. Nature. 2011;475:493–496. doi: 10.1038/nature10231. [DOI] [PMC free article] [PubMed] [Google Scholar]
- 31.Hershkovitz I., Marder O., Ayalon A., Bar-Matthews M., Yasur G., Boaretto E., Caracuta V., Alex B., Frumkin A., Goder-Goldberger M. Levantine cranium from Manot Cave (Israel) foreshadows the first European modern humans. Nature. 2015;520:216–219. doi: 10.1038/nature14134. [DOI] [PubMed] [Google Scholar]
- 32.Eriksson A., Manica A. Effect of ancient population structure on the degree of polymorphism shared between modern human populations and ancient hominins. Proc. Natl. Acad. Sci. USA. 2012;109:13956–13960. doi: 10.1073/pnas.1200567109. [DOI] [PMC free article] [PubMed] [Google Scholar]
- 33.Gronau I., Hubisz M.J., Gulko B., Danko C.G., Siepel A. Bayesian inference of ancient human demography from individual genome sequences. Nat. Genet. 2011;43:1031–1034. doi: 10.1038/ng.937. [DOI] [PMC free article] [PubMed] [Google Scholar]
Associated Data
This section collects any data citations, data availability statements, or supplementary materials included in this article.