

Abstract
The relationship between growth factor-dependent cell growth and proliferation and the up-regulation of cellular metabolism required to support these processes remains poorly defined. Here, we demonstrate that cell growth, proliferation, and glucose metabolism are coordinately regulated by interleukin-3 (IL-3) in cytokine-dependent cells. Surprisingly, glycolytic activity is stimulated to a greater extent than would be expected based on the rate of cell growth or proliferation. IL-3 signaling exerts a direct effect on glycolytic commitment independent of cell growth control. These results are not restricted to IL-3 as the cytokines IL-7 and IL-2 have similar effects on glucose metabolism when assayed in factor-dependent cell lines or primary lymphocytes, respectively. Growth factor stimulation leads cells to consume less oxygen and produce more lactate per glucose, indicative of conversion from oxidative to glycolytic metabolism. The enforced rate of glucose metabolism is in excess of that required to support cell growth; accordingly, if extracellular glucose is reduced, cells retain the ability to grow and proliferate by derepressing oxidative metabolism. These data suggest that the high rate of glycolysis observed in response to growth factor stimulation is a primary effect rather than a homeostatic response to increased cell growth.
Keywords: growth factor, interleukin-3, glucose metabolism, cell size
The growth, proliferation, and survival of cells within multicellular organisms depend on the presence of appropriate extracellular signals (1). These cues maintain the delicate balance between cell accumulation and cell death necessary for normal development and tissue homeostasis. These signals can arise from cellular interactions with soluble proteins such as cytokines, with other cells, or with the extracellular matrix. Extracellular signals that promote cell growth also result in increased glucose utilization. For example, early studies demonstrated that lectin stimulation of lymphocytes increased their glucose uptake, rate of glycolysis, and pentose phosphate shunt activity (2–4).
Growth factor stimulated cell growth and proliferation result in the consumption of energy and macromolecular precursors, which might therefore stimulate glycolysis as a cell-intrinsic response to a decline in an intracellular metabolic indicator such as ATP/ADP ratio, NADH/NAD+ ratio, or mitochondrial membrane potential (3, 5). Bioenergetic demand can stimulate compensatory increases in glucose metabolism in specific settings. For instance, glycolytic rates rise in cells in which ATP consumption is increased or in which respiration is impaired (6–10). However, recent studies in our laboratory have indicated that growth factor signals serve to maintain levels of intracellular bioenergetic indicators such as ATP/ADP, NADH/NAD+, and mitochondrial membrane potential (11, 12). This suggested that receptors that promote cell growth might directly regulate the cellular uptake and utilization of essential nutrients, such as glucose, rather than indirectly via increased bioenergetic demand.
The immortalized but nontumorigenic cell line FL5.12, which is dependent on IL-3, was used to investigate the relationship between growth factor signaling and glucose utilization. IL-3 has been described as a prototypical survival factor (13). The IL-3 receptor uses the common β chain (βc) to transduce signals (14). Effects of activated βc receptors on the expression and activity of proteins directly responsible for cell cycle regulation, cellular differentiation, and inhibition of apoptosis have been described (14–16). In addition, IL-3 stimulation has been demonstrated to result in enhanced glucose uptake and metabolism, but whether this is a primary or secondary effect of IL-3 signaling has not been addressed (12, 17).
We report that increased IL-3 availability correlates with increased glycolytic enzyme activity that cannot be accounted for as a compensatory response to cell growth. As growth factor availability increases, glycolytic metabolism rises in excess of apparent cellular demand, resulting in the accumulation of unused energy equivalents both in the cytosol and as secreted metabolic products in the medium. Growth factor-dependent increases in glycolysis result in dose-dependent increases in mitochondrial potential and cellular NADH. At levels of glucose available in standard tissue culture media, IL-3 stimulation of glycolysis leads to glucose-mediated suppression of oxidative metabolism. Thus IL-3 promotes a dose-dependent stimulation of aerobic glycolysis, beyond what is necessary to fuel cell growth and proliferation.
Methods
Cell culture
FL5.12 cells were cultured in RPMI 1640 (Invitrogen) supplemented with 10% dialyzed fetal calf serum (FCS) (Invitrogen), 10 mM HEPES (Invitrogen), 50 U/ml penicillin, 50 μg/ml streptomycin (Invitrogen), 50 μM 2-mercaptoethanol (2-ME; Sigma), and recombinant IL-3 at 0.01, 0.05, or 0.35 ng/ml (R&D Systems, Minneapolis, Minnesota). Cells were grown in the stated concentration of IL-3 for at least four days before any experiment unless otherwise stated. B23 cells were cultured as described previously (18) in OptiMEM (Gibco, Carlsbad, California) supplemented with 10% FCS, 50 μM 2-ME, 2.4 g/L NaHCO3, 100 μg/ml penicillin, 100 μg/ml streptomycin, and 1.5 ng/ml recombinant IL-7 (BD PharMingen, San Diego, California). Cells were washed three times and resuspended in media lacking IL-7 18 hours before stimulation. Cells were stimulated for four hours with 50 ng/ml IL-7 in the presence or absence of 5 ng/ml cycloheximide. Primary human CD4 T cells were isolated and stimulated with anti-CD3, anti-CD28-antibody coated beads as described previously (19). Cells were cultured in RPMI 1640 supplemented with 10% FCS, 10 mM HEPES, 50 U/ml penicillin, 50 μg/ml streptomycin, and 50 μM 2-ME for 12–14 days. Rested cells were washed and resuspended in media with 1% FBS two hours before stimulation. Cells were stimulated for 4 hours with 300 U/ml recombinant IL-2 (Chiron) in the presence or absence of 0.5 μg/ml cycloheximide.
Cell number, cell size, and flow cytometry
Cells were counted using a Coulter Z2 particle analyzer, which also measured cell volume. Alternately, relative cell size was measured in forward scatter units on an LSR flow cytometer (Becton Dickinson). For cell-cycle analysis, cells were stained with 10 μg/ml Hoechst 33342 (Molecular Probes) and 10 μg/ml prospidinum iodide (Molecular Probes) for 30 min at 37°C. Cells were run on an LSR flow cytometer, and dead cells were excluded from the analysis. For Glut1 staining, cells were fixed in 1% paraformaldehyde, permeabilized in 0.3% saponin, and stained with a polyclonal rabbit anti-Glut1 antibody (Research Diagnostics). This was followed by secondary staining with a goat anti-rabbit antibody conjugated to fluorescein. Cells were analyzed on a FACS Calibur flow cytometer (Becton Dickinson). For mitochondrial potential analysis, cells were stained with 20 nM tetramethyl rhodamine ethyl ester (TMRE; Molecular Probes) in the presence or absence of 50 μM CCCP (Sigma) for 30 min at 37°C followed by analysis with a FACS Calibur flow cytometer. To assess cell viability, cells were pelleted, resuspended in PBS with 2 μg/ml prospidinum iodide, and analyzed by flow cytometry.
Glucose and lactate measurements
Media samples were collected and stored at −20°C from cells in culture over the course of four days. Glucose and lactate were measured using kits from Sigma Diagnostics according to the manufacturer's instructions. These assays were analyzed using a SpectraMax 190 spectrophotometer and SoftMax Pro software (Molecular Devices, Sunnyvale, California).
Enzymatic assays
Hexokinase assay was based on the method of Wilson (20). Briefly, cells were lysed in 0.05 M sodium phosphate, 0.1% Triton X-100 and incubated on ice for 15 min. Then 100 μl of sample was mixed with 105 μl of reaction buffer: 90 μl of reaction solution (45 mM Tris Base, 7.4 mM MgCl2, 3.7 mM glucose, pH 8.5), 10 μl NADP+ (Sigma, 5 mg/ml in 0.1 M sodium phosphate, pH 7), 1 μl glucose 6-phosphate dehydrogenase (Worthington Biochemical Corp., Lakewood, New Jersey, 100 units/ml in 0.02 M Tris, 0.2% BSA), 3 μl ATP (220 mM, pH 7), 1 μl monothiolglycerol (Sigma). Change in absorbance at 340 nm was read every 10 s over 30 min on a SpectraMax 190 spectrophotometer. Data are expressed as the change in absorbance at 340 nm/sec/106 cells × 10−4. Phosphofructokinase assay was based on the method of Sapico et al. (21). Briefly, cells were resuspended in 50 μl homogenization buffer (50 mM HEPES pH 7.0, 100 mM KF, 15 mM EGTA pH 7.4), frozen in a dry ice/ethanol bath and thawed at 37°C. Cells were spun at 30,000 × g for 30 min at 4°C. Cell supernatant was then added to 950 μl reaction buffer (50 mM HEPES pH 7.0, 100 mM KCl, 5 mM MgCl2, 1.5 mM ATP, 0.15 mM NADH, 5 mM NaHPO4, 0.1 mM AMP, 1 mM NH4Cl, 5 U/ml triose phosphate isomerase, 0.5 U/ml aldolase, 0.5 U/ml α-glycerophosphate dehydrogenase, and 5 mM fructose 6-phosphate). Change in absorbance at 340 nm was read every 10 s over 30 min in a SpectraMax 190 spectrophotometer. Data are expressed as the change in absorbance at 340 nm/sec/106 cells × 10−5.
Oxygen consumption
Oxygen consumption of whole cells was measured as described previously (22). Briefly, oxygen consumption was measured using a water-jacketed, airtight chamber with a 3 ml volume fitted with a polarographic oxygen electrode. Measurements were made at 37°C with constant stirring.
NADH measurement
Cells cultured in different concentrations of IL-3 were washed in Krebs buffer and resuspended in Krebs buffer (115 mM NaCl, 2 mM KCl, 25 mM NaHCO3, 1 mM Mg Cl2, 2 mM CaCl2, 0.25% BSA pH 7.4, equilibrated with 5% CO2) with 10 mM glucose. NADH fluorescence was measured at an excitation of 340 ± 2.5 nm and an emission of 461 ± 2.5 nm using a Fluoromax 2 spectrofluorimeter (Jobin Yvon-Spex) with constant stirring. Where appropriate, noise editing was used to improve readability of the tracing. The final concentration of FCCP and rotenone was 5 μM. The final concentration of iodoacetic acid was 1 μM. The final concentration of KCN was 500 μM.
Glycolysis
Glycolytic rate was determined by measuring the conversion of 5-3H-glucose to 3H2O. Cells were incubated with 10 μCi 5-3H-glucose (PerkinElmer Life Sciences, Boston, Massachusetts) at 37°C for one hour. Following incubation, the reaction was stopped with 0.2 N HCl, and 3H2O was separated from 5-3H-glucose by diffusion in an airtight container. Diffused and undiffused tritium was measured using a 1450 Microbeta scintillation counter (Wallac, Turku, Finland) and compared with controls of 5-3H-glucose only and 3H2O only to determine the rate of glycolysis.
Results
IL-3 stimulation results in a dose-dependent increase in glycolytic activity
IL-3 regulates cell growth and proliferation in multiple cell types (23). FL5.12 cells are an immortalized hematopoietic cell line dependent on IL-3 for growth, proliferation, and survival (24). This cell line fails to form tumors in nude mice and appears to have intact Rb, p53, and PTEN tumor suppressor pathways (25). A detailed analysis of FL5.12 cells grown in different concentrations of growth factor was performed. Cells were cultured in 0.01, 0.05, or 0.35 ng/ml recombinant IL-3. These concentrations were above the threshold necessary to inhibit apoptosis in culture (data not shown). As expected, the rate of cell accumulation in culture increased with increasing levels of IL-3 (Fig. 1A).
Figure 1. IL-3 stimulation results in increases in cell number, cell size, and glycolytic rate.
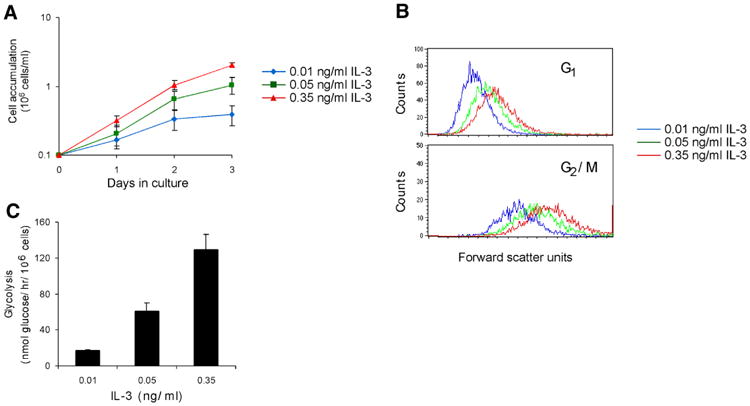
A) Cell accumulation in culture increases with higher concentrations of IL-3. The concentration of cells was measured over three days in culture with 0.01, 0.05, or 0.35 ng/ml of IL-3. Average of eight independent experiments ± sem is shown. B) Cell size increases throughout the cell cycle with higher concentrations of IL-3. Unfixed cells were stained with the cell permeable DNA dye Hoechst 33342 to measure cell cycle as well as propidium iodide to measure viability. Viable cells were analyzed for cell cycle, and a histogram of the forward scatter values of cells in either G1 or G2/M was plotted. A representative experiment is shown. C) Glycolytic rate increases dramatically when the concentration of IL-3 is increased. Glycolytic rate was measured by the specific conversion of glucose to water. Average of three independent experiments ± sem is shown.
To determine whether or not there was an increase in cell growth independent of the increase in proliferation, cell size in different phases of the cell cycle was evaluated. The size of cells in both G1 and G2/M was measured by forward scatter analysis of cells stained with the cell-permeable DNA dye Hoechst 33342 (Fig. 1B). This analysis revealed that with each increment of IL-3, cells became larger at each stage of the cell cycle. Thus, IL-3 stimulated cell growth to a greater extent than cell proliferation. Concomitant with these increases in growth and proliferation, cells can up-regulate nutrient uptake and metabolism. Measurement of cellular rates of glycolysis indicated that cells dramatically increased their rate of glycolysis when stimulated with increasing IL-3 (Fig. 1C).
To examine the increased glycolysis in response to IL-3 in greater detail, potential regulatory steps of glycolysis were investigated (26). Glut1 is the major glucose transporter present on the surface of FL5.12 cells. Staining with an anti-Glut1 antibody followed by FACS analysis indicated that Glut1 expression increased with increasing amounts of growth factor (Fig. 2A). Hexokinase is the enzyme that phosphorylates glucose, thus capturing it intracellularly, while phosphofructokinase-1 (PFK-1) is thought to be the rate-limiting enzyme of glycolysis. Enzymatic measurements of hexokinase and PFK-1 activities both demonstrated higher activities with higher growth factor availability (Fig. 2B and 2C). These data confirm that the increase in glucose consumption brought about by IL-3 stimulation is accompanied by activation of glycolysis at multiple steps.
Figure 2. IL-3 stimulation results in activation of glycolysis at multiple steps.
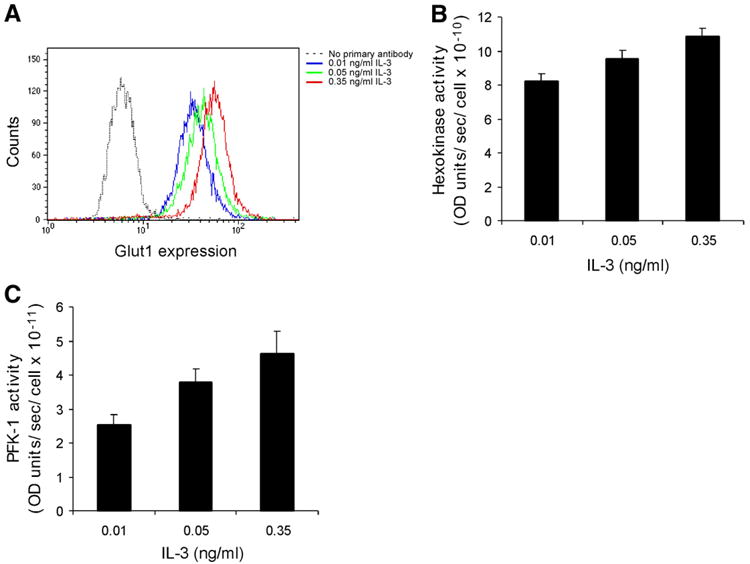
A) ells grown in higher concentrations of IL-3. The Glut1 content of cells was measured via flow cytometry. A representative experiment is shown. B) Hexokinase activity increases in cells grown in higher concentrations of IL-3. Hexokinase activity was determined in whole cell lysates by a spectrophotometric assay in which glucose 6-phosphate formation is coupled to NADPH production. Average of four independent experiments ± sem is shown. The mean hexokinase activity was significantly greater for cells stimulated with 0.35 than for 0.01 ng/ml IL-3 (paired t test, two-tailed P value, P < 0.01). C) Phosphofructokinase-1 (PFK-1) activity increases in cells grown in higher concentrations of IL-3. PFK-1 activity was determined in whole-cell lysates by a spectrophotometric assay in which fructose 1,6-bisphosphate formation was coupled to NADH consumption. Average of five independent experiments ± sem is shown. The mean PFK-1 activity was significantly greater for cells stimulated with 0.35 than for 0.01 ng/ml IL-3 (paired t test, two-tailed P value, P < 0.05).
IL-3 stimulation results in increased cellular NADH, elevated mitochondrial membrane potential, and a shift from glucose oxidation to lactate production
Glycolysis results in the net consumption of one molecule of glucose and two molecules each of NAD+ and ADP and production of two molecules each of pyruvate, NADH, and ATP. In cells with high ATP demand, cytosolic pyruvate and NADH can both be oxidized in mitochondria to produce additional ATP. If the bioenergetic requirements for cell growth and proliferation were driving the observed increase in glycolysis, then an increased percentage of the pyruvate and NADH produced by glycolysis would be expected to be used by mitochondria. Alternatively, if the glycolytic rate of pyruvate and NADH production exceeded the rate of consumption by mitochondria, these glycolytic end-products would accumulate in the cytosol.
To distinguish between these possibilities, cellular NAD(P)H fluorescence was measured. Cells cultured in increasing concentrations of IL-3 displayed increased levels of NAD(P)H fluorescence (Fig. 3A). However, NADH and NADPH have similar excitation and emission spectra, so in order to determine the level of NADH available to mitochondria, the protonophore FCCP was added to the cells, and the change in NAD(P)H fluorescence was measured. FCCP dissipates the electrochemical potential generated by the electron transport chain across the mitochondrial inner membrane. In response, electron transport proceeds at its maximal rate and mitochondria consume available NADH. In standard tissue culture medium, a greater quantity of NADH was available to the mitochondria of cells grown in higher concentrations of growth factor.
Figure 3. IL-3 stimulates a shift away from oxidative toward glycolytic metabolism.
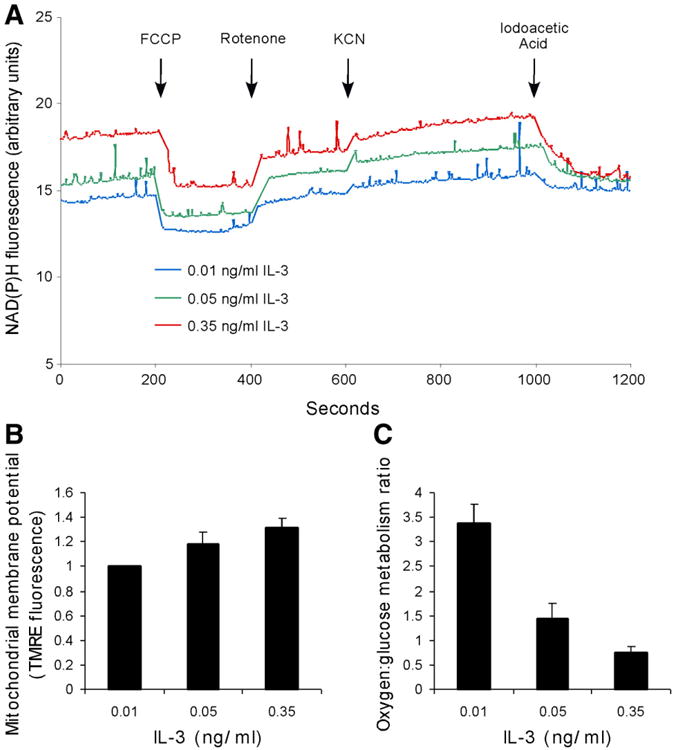
A) NADH levels were measured in a spectrofluorometer with constant stirring at an excitation wavelength of 340 nm and an emission wavelength of 461 nm. Drugs were added at the indicated times. The final concentrations of FCCP and rotenone were each 5 μM; the final concentration of IAA was 1 μM; the final concentration of KCN was 500 μM. A representative experiment is shown. B) Mitochondrial membrane potential rises with increasing concentrations of IL-3. Mitochondrial membrane potential was measured by flow cytometry using the potentiometric dye TMRE, and baseline TMRE staining was measured in cells treated with the uncoupling agent CCCP. The difference between these measurements was calculated and normalized to mitochondrial membrane potential determined in 0.01 ng/ml IL-3. Average of three independent experiments ± sem is shown. The mean mitochondrial membrane potential was significantly greater for cells stimulated with 0.35 than for 0.01 ng/ml IL-3 (paired t test, two-tailed P value, P < 0.05). C) The oxygen:glucose metabolism ratio declines with increasing concentrations of IL-3. The oxygen:glucose metabolism ratio was calculated by dividing the rate of oxygen consumption by the rate of glycolysis. Oxygen consumption rate was measured using an oxygen electrode in a heated, airtight chamber. Glycolytic rate was measured by the specific conversion of glucose to water. Average of three independent experiments ± sem is shown.
To further characterize NADH metabolism in these cells, several inhibitors were added to the cells following FCCP treatment. Rotenone, a mitochondrial complex I inhibitor, was added 200 s following the addition of FCCP. The addition of rotenone elicited a substantial recovery of NADH in the cells grown in the lowest concentration of growth factor, but less than a 50% recovery of NADH in cells grown in the highest concentration of growth factor, suggesting that in these cells mitochondria can consume NADH via a mechanism that does not involve complex I.
To address the consumption of NADH by the electron transport chain downstream of complex I, potassium cyanide, a complex IV inhibitor, was added 200 s following the addition of rotenone. The prevention of all mitochondrial NADH oxidation by cyanide returned the NAD(P)H fluorescence of cells grown in high growth factor to its initial level, suggesting that complex I-independent oxidation is a significant contributor to the electron transport chain in cells grown in high concentrations of IL-3.
NADH generated from glycolysis may donate electrons to the mitochondria downstream of complex I via the glycerol phosphate shuttle (27). To confirm the contribution of NADH derived from glycolysis in cells grown in different concentrations of growth factor, iodoacetic acid (IAA), an inhibitor of glyceraldehyde 3-phosphate dehydrogenase and thus of glycolytic NADH production, was added to the cells. The addition of IAA caused a reduction in NAD(P)H fluorescence that was greatest in the cells grown in the highest concentration of IL-3. Therefore, as cells are cultured with increasing levels of growth factor, glycolytic NADH and NADH supporting electron transport downstream of complex I make progressively larger contributions to total NAD(P)H charge.
Another bioenergetic indicator is the level of mitochondrial membrane potential, which reflects both production by electron transport as well as consumption by oxidative phosphorylation (28). Elevated bioenergetic demand could decrease mitochondrial potential either by decreasing availability of substrates for electron transport or by increasing consumption of the electrochemical gradient. However, cells cultured with higher levels of IL-3 demonstrated increased mitochondrial potential, consistent with the excess production of substrates for electron transport (Fig. 3B).
Bioenergetic demand was also assessed by measuring cellular oxygen consumption in response to growth factor stimulation. The oxygen:glucose metabolism ratio was calculated by dividing the rate of oxygen consumption by the rate of glycolysis (Fig. 3C). Maximal oxidation of glucose would yield an oxygen:glucose metabolism ratio of 6:1, while incomplete oxidation would result in lower values. Cells cultured in 0.01 ng/ml IL-3 consumed 3.3 moles of oxygen per glucose, while those cultured in 0.35 ng/ml IL-3 consumed only 0.7 moles of oxygen per glucose. This result suggests that growth factor receptor engagement shifts cells away from an oxidative toward a glycolytic form of metabolism.
Since glucose is incompletely oxidized and NADH accumulates as cells are stimulated with IL-3, available pyruvate might be converted to lactate to allow NADH reoxidation and continued glycolytic throughput. On the other hand, if IL-3 signaling directly stimulates metabolic demand for pyruvate, less lactate would be produced. Cellular lactate can be secreted down its concentration gradient across the plasma membrane. To address how cells used their glycolytic end-products in response to increased IL-3 stimulation, the consumption of glucose and accumulation of lactate in the culture medium were measured. The glucose consumption and lactate accumulation over time both increased as cells were cultured with higher levels of IL-3 in the medium (Fig. 4A and 4B). The relationship between the IL-3 mediated stimulation of glycolysis, and the utilization of NADH and pyruvate by mitochondria was evaluated by calculating the amount of lactate produced per glucose consumed. These calculations showed that the amount of lactate produced per glucose consumed increased as cells were grown in higher concentrations of IL-3 (Fig. 4C). In other words, cells used a progressively smaller fraction of their metabolized glucose for either macromolecular synthesis or mitochondrial oxidation as they were exposed to increasing concentrations of growth factor.
Figure 4. Lactate production increases as cells are grown in higher concentrations of IL-3.
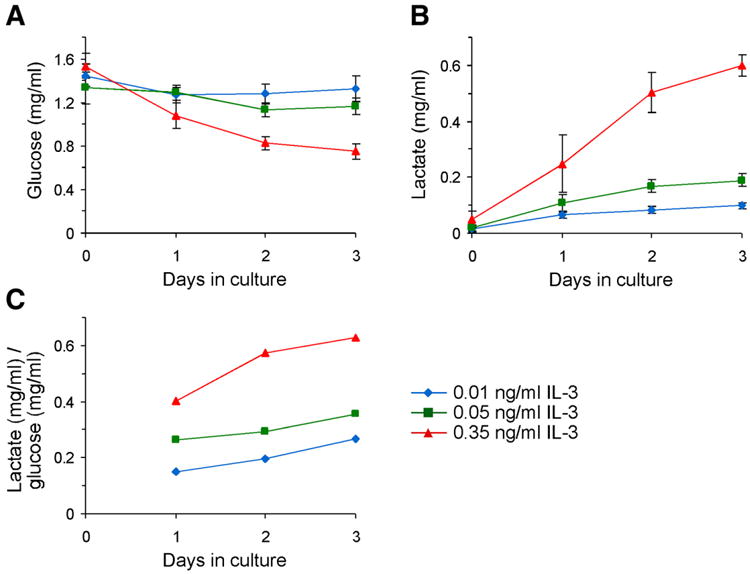
Cells were cultured in 0.01, 0.05, or 0.35 ng/ml IL-3 for three days. A) Cells consume more of the glucose in their media when grown in higher concentrations of IL-3. Average of at least four independent experiments ± sem is shown. B) Lactate accumulation in the media increases as cells are grown in higher concentrations of growth factor. Average of at least four independent experiments ± sem is shown. C) The amount of lactate produced per glucose consumed increases as cells are grown in higher concentrations of IL-3. Lactate production data were divided by glucose consumption data. The theoretical maximum, if all glucose were converted into lactate, is 1 mg of lactate produced per 1 mg of glucose consumed.
IL-3 stimulation of glycolysis is independent of cell growth
Increased accumulation of glycolytic NADH, mitochondrial membrane potential, and secretion of lactate in response to IL-3 signaling suggested a primary stimulation of glycolysis and not merely a demand for glycolytic products. To directly test the role of demand by cell growth on the up-regulation of glycolysis, cells were stimulated by IL-3 under conditions in which growth was prevented. Cells cultured in the lowest concentration of IL-3 were switched to the highest concentration of IL-3 for four hours in the presence or absence of the protein synthesis inhibitor cycloheximide. Cells switched to high IL-3 displayed a statistically significant increase in cell size, while the cells switched to high IL-3 in the presence of cycloheximide remained the same size as cells grown in low IL-3 (Fig. 5A). However, the PFK-1 activity of cells switched to high IL-3 increased significantly in four hours to a similar extent in the presence or absence of cycloheximide (Fig. 5B). Similarly, IL-3 acutely stimulated a significant increase in glycolytic rate in the presence or absence of cycloheximide (Fig. 5C). That is, although the cells did not grow in response to IL-3 in the presence of cycloheximide, they still showed a 69% increase in PFK-1 activity and a 110% increase in glycolytic rate. Thus, the observed up-regulation of glycolysis was not dependent on new protein synthesis. Furthermore, these results demonstrate that the increase in glycolytic activity observed when cells are grown in high concentrations of growth factor was not simply a secondary response to cell growth.
Figure 5. IL-3 increases glycolysis independently of changes in cell size.
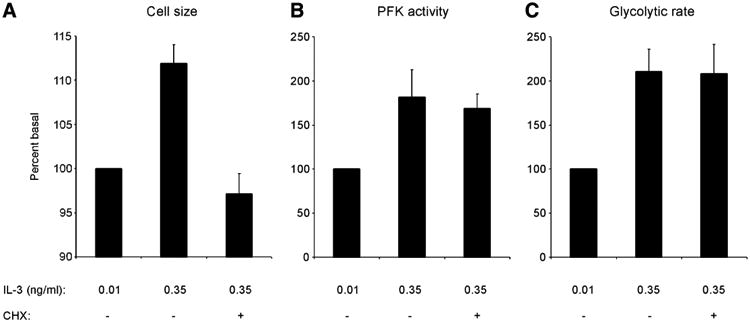
Cells cultured in 0.01 ng/ml IL-3 were switched to media containing 0.35 ng/ml IL-3 for four hours, with or without 5 μg/ml cycloheximide (CHX), or kept in 0.01 ng/ml IL-3. A) Cell growth stimulation by IL-3 is prevented by CHX. After four hours in the new media, cell size was measured by Coulter analysis. Average of four independent experiments ± sem is shown, normalized to cell size in cells maintained in 0.01 ng/ml IL-3. The mean cell size was significantly greater for cells stimulated with 0.35 than for 0.01 ng/ml IL-3 (paired t test, two-tailed P value, P < 0.01). B) PFK-1 activity stimulation by IL-3 is not prevented by CHX. After four hours, PFK-1 activity in whole-cell lysates was measured. Average of four independent experiments ± sem is shown, normalized to PFK-1 activity in cells maintained in 0.01 ng/ml IL-3. C) Glycolytic rate stimulation by IL-3 is not prevented by CHX. After four hours, glycolytic rate was measured by the specific conversion of glucose to water. Average of four independent experiments ± sem is shown, normalized to glycolytic rate of cells maintained in 0.01 ng/ml IL-3.
Hematopoietic cytokine control of glycolysis
To determine if direct growth factor stimulation of glycolysis was unique to FL5.12 cells or to immortalized murine IL-3-dependent cells in general, additional hematopoietic cell types were tested. The responses of primary human T cells to IL-2 (29) and immortalized murine B cell progenitors to IL-7 (18) were assayed. In primary T cells, acute stimulation with IL-2 caused significant increases in both cell size and glycolytic rate (Fig. 6A and 6B). Moreover, in the presence of cycloheximide, IL-2 stimulated glycolysis but not cell growth. Similarly, in response to IL-7, the B cell progenitor line B23 both increased in size and glycolytic rate but displayed cycloheximide-insensitive glycolytic activation (Fig. 6C and 6D). Therefore, primary regulation of glycolysis independent of cell growth is not limited to FL5.12 cells in response to IL-3, but may be observed in other cell types, including primary cells, in response to a number of growth factors.
Figure 6. Glycolytic regulation is independent of cell growth control.
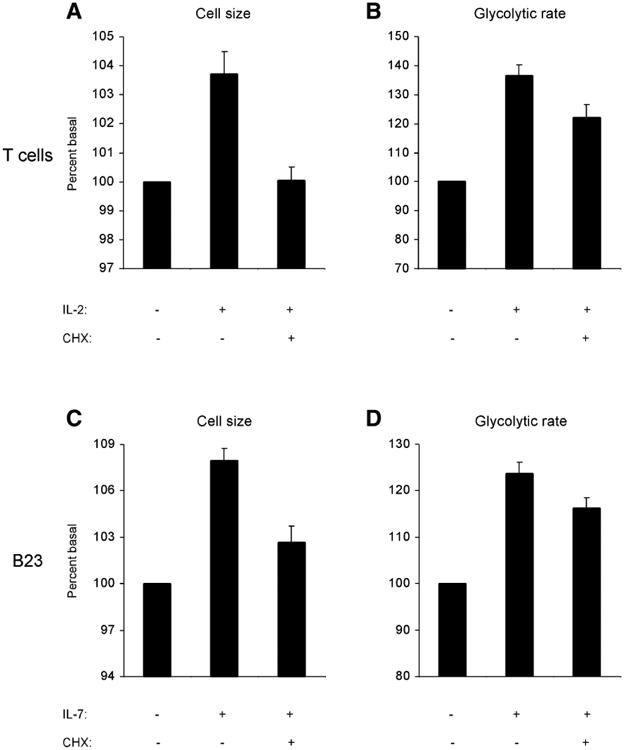
A, B) Human primary T cells were stimulated for four hours with IL-2 in the presence or absence of cycloheximide. A) Cell size was measured by Coulter analysis. Average of three independent experiments ± sem is shown, normalized to cell size of cells unstimulated with IL-2. The mean cell size was significantly greater for cells stimulated with IL-2 (paired t test, two-tailed P value, P < 0.05). B) Glycolytic rate was measured by the specific conversion of glucose to water. Average of three independent experiments ± sem is shown, normalized to glycolytic rate of cells unstimulated with IL-2. C, D) B23 cells, immortalized murine B cell progenitors, were stimulated for four hours with IL-7 in the presence or absence of cycloheximide. C) Cell size was measured by Coulter analysis. Average of four independent experiments ± sem is shown, normalized to cell size of cells unstimulated with IL-7. The mean cell size was significantly greater for cells stimulated with IL-7 (paired t test, two-tailed P value, P < 0.001). D) Glycolytic rate was measured by the specific conversion of glucose to water. Average of four independent experiments ± sem is shown, normalized to glycolytic rate of cells unstimulated with IL-7.
Growth factor-stimulated glycolysis suppresses oxidative metabolism and exceeds proliferative demand
To determine the metabolic and cellular consequences of elevated rates of glycolysis, FL5.12 cells were cultured in 0.35 ng/ml IL-3 in a reduced level of glucose. When cells were switched from 10 mM to 0.4 mM glucose, glycolytic rates significantly decreased (Fig. 7A). Despite the decrease in glycolysis, and a slower rate of production of mitochondrial substrates such as NADH and pyruvate, cellular oxygen consumption did not decline in response to a reduction in extracellular glucose. Rather, oxygen consumption increased significantly when extracellular glucose was reduced to 0.4 mM (Fig. 7B). Thus, although glycolysis is directly controlled by extrinsic signals, mitochondrial oxygen consumption appears to be regulated homeostatically by intracellular bioenergetic conditions. In other words, under glucose-replete conditions, elevated rates of glycolysis are able to suppress oxidative phosphorylation below maximal rates.
Figure 7. IL-3 directed glycolysis suppresses cellular oxygen consumption and exceeds proliferative demand.
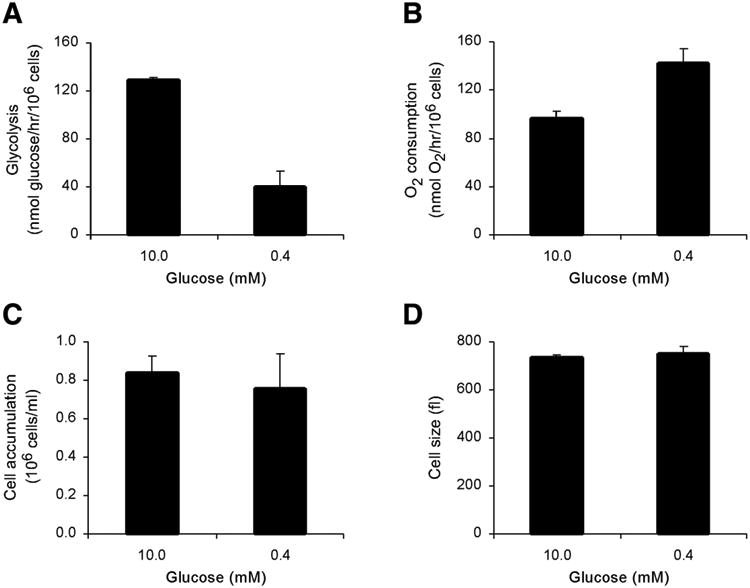
Cells were cultured in 0.35 ng/ml IL-3 and 10 or 0.4 mM glucose. A) Glycolytic rate is suppressed when cells are shifted from 10 mM glucose to 0.4 mM glucose. Glycolytic rate was measured after two days in culture by measuring the specific conversion of tritiated glucose to tritiated water. Average of three independent experiments ± sem is shown. B) Oxygen consumption rate is derepressed when cells are shifted from 10 mM glucose to 0.4 mM glucose. Oxygen consumption was measured after two days in culture using an oxygen electrode in a heated, airtight chamber. Average of three independent experiments ± sem is shown. C) Cell accumulation in culture is maintained when cells are shifted from 10 mM glucose to 0.4 mM glucose. The concentration of cells was measured after three days in culture. Average of three independent experiments ± sem is shown. D) Cell size is maintained when cells are shifted from 10 mM glucose to 0.4 mM glucose. Cell size was measured after two days in culture by Coulter analysis. Average of three independent experiments ± sem is shown.
The effect of the metabolic switch caused by glucose limitation on cell growth and proliferation was investigated. Surprisingly, cell number after three days in culture was unaffected by a 25-fold reduction in glucose availability (Fig. 7C). In addition, glucose limitation had no effect on cell size (Fig. 7D). Cells appeared fully able to compensate for reduced rates of glycolysis by derepressing oxidative metabolism to maintain growth factor-directed rates of growth and proliferation. IL-3-directed glycolysis is evidently in excess of that needed to support cell growth and proliferation.
Discussion
The metabolism of mammalian cells is frequently described as being under homeostatic control: in response to increased demand for ATP or biosynthetic precursors, cells up-regulate glycolysis and oxidative phosphorylation to maintain a stable ATP/ADP ratio. However we have recently reported that mammalian cells have a limited intrinsic ability to take up extracellular nutrients despite abundant supply. This observation prompted us to consider the alternative possibility that mammalian metabolism is regulated primarily through extrinsic growth factor signal transduction. The data presented here suggest that IL-3 is a dose-dependent regulator of glycolytic metabolism in FL5.12 cells. The data also show that this regulation is a direct effect of IL-3, and not a compensatory result of growth factor stimulation of cell growth and proliferation. In response to high levels of IL-3, FL5.12 cells take up and metabolize glucose beyond that needed to support cellular bioenergetics or biosynthesis. This excess metabolism is reflected in the buildup of intracellular NADH, the elevation of mitochondrial membrane potential, and increased secretion of lactate.
One consequence of direct growth factor control over glycolysis is that cellular metabolism becomes less efficient as growth factor stimulation increases. Elevated rates of glycolysis suppress maximal rates of oxidative phosphorylation. This effect may be due to the known inhibition by a high matrix NADH/NAD+ ratio of multiple TCA cycle enzymes, including isocitrate dehydrogenase, α-ketoglutarate dehydrogenase, and malate dehydrogenase. The increased reliance on complex I-independent transport of electrons from NADH to the electron transport chain, presumably by the glycerol phosphate shuttle, highlights this inefficiency. For example, while the malate–aspartate shuttle generates 2.25 molecules of ATP per NADH, the glycerol phosphate shuttle generates only 1.5 molecules of ATP per NADH (30). Though less efficient, the glycerol phosphate shuttle permits rapid energy generation: the tissue best known for using the glycerol phosphate shuttle, insect flight muscle, also has the highest known power output (31). In general, glycolytic metabolism is thought to produce ATP at a higher rate, albeit at a lower yield, as compared with the ability of the TCA cycle to produce ATP through oxidative phosphorylation (32).
Under the conditions studied, growth factor-controlled elevated rates of glycolysis were in excess of proliferative demand. Depressing glycolytic rates by reducing extracellular glucose did not disrupt the growth or proliferation of the cells in culture. In vivo, however, other nutrients such as amino acids or lipids may not be readily available or bioenergetic demands may be greater so that the rate of glycolysis becomes limiting. Under these circumstances, the dose-dependent regulation of glucose metabolism by growth factors may serve to ensure that cells once engaged in an extracellularly determined process are not bioenergetically or biosynthetically constrained during their response. Additionally, the growth factor directed shift to high glycolytic rates might be beneficial to cells under conditions of stress. Increased glucose-dependent production of NADPH may make cells less susceptible to oxidative damage. In the context of a multicellular organism, externally controlled glucose metabolism may facilitate tissue homeostasis, such that nutrients are appropriately distributed and individual cells are prevented from autonomously using extracellular glucose.
The extrinsically regulated metabolic shift from oxidative phosphorylation to glycolysis may also inform disease processes such as cancer. It has long been noted that tumor cells display elevated rates of glycolysis, despite oxygen availability (33, 34). Crabtree observed that even though most tumor cells are capable of oxidative phosphorylation, extracellular glucose represses oxidative phosphorylation in tumor cells via an unknown mechanism (35). Self-sufficiency in growth signals has been postulated to be a primary acquired capability of cancer (13). We propose that growth factor-independent growth factor signaling may be sufficient to explain the altered metabolism of cancer cells. For example, we have recently identified the proto-oncogene Akt as an IL-3 effector capable of partially substituting for IL-3 in maintenance of cell survival, mitochondrial membrane potential and glycolytic metabolism (36). In addition, the proto-oncogene Pim-2 is another IL-3-responsive kinase that can stimulate glycolysis (37). Although these pathways regulate both cell growth and glucose metabolism, it is likely that unique downstream effectors may underlie these effects. For example, the PI3K/Akt pathway has been reported to enhance glucose uptake via increasing Glut1 expression and surface localization (38, 39); increase hexokinase activity (39); and allosterically activate PFK-1 via phosphorylation of PFK-2 (40). Future studies will determine the precise signaling targets that mediate IL-3's specific effects on glucose metabolism.
In summary, IL-3 coordinately controls cell survival, the cell cycle, cell size, and glucose metabolism in cytokine-dependent cells. IL-3 directly stimulates a shift away from oxidative toward glycolytic metabolism in excess of proliferative demand. Glycolysis is an extrinsically regulated process downstream of growth factor signaling in parallel to growth and proliferation (Fig. 8).
Figure 8. IL-3 directs glycolysis in parallel to growth and proliferation.
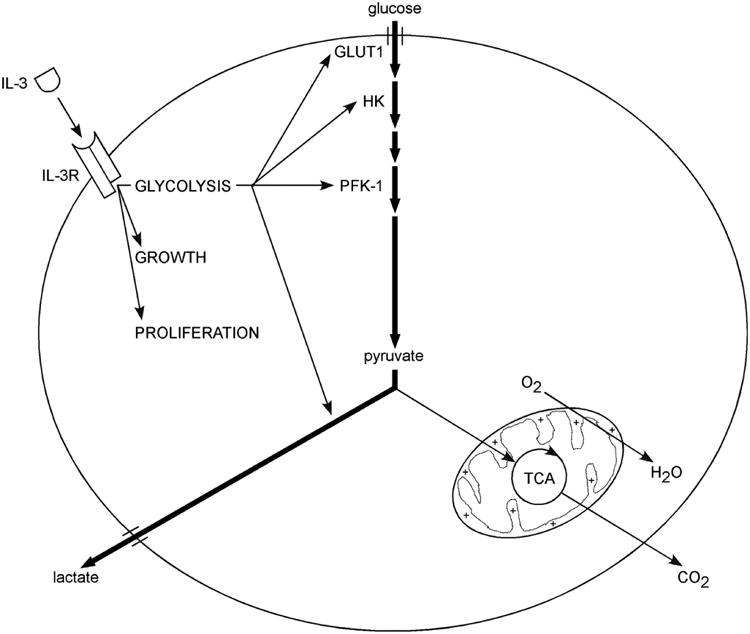
Growth factors independently but coordinately regulate multiple processes in metazoan cells, including growth and proliferation. Data presented here suggest that glycolysis is another extrinsically directed process. Glycolysis is regulated at numerous steps, including glucose transport (GLUT1), hexokinase (HK), phosphofructokinase-1 (PFK-1), and lactate dehydrogenase. Furthermore, IL-3 stimulates a shift away from oxidative toward glycolytic metabolism. Elevation of glycolytic rates inhibits mitochondrial oxygen consumption below maximal levels, implying that mitochondrial metabolism is a homeostatic sensor of intracellular bioenergetics.
Acknowledgments
We thank Ryan Cinalli for technical assistance, Goro Osawa of the CFAR Immunology Core for T cell isolation, and members of the Thompson laboratory, especially Monica Buzzai, Ralph DeBerardinis, Georgia Hatzivassiliou, Mei Kong, and Fangping Zhao, for helpful discussions and critical reading of the manuscript. In addition, we thank the University of Pennsylvania Combined Degree Program for their support. J.C.R. was supported by the Irvington Institute for Immunological Research and a Howard Temin K01 Career Development Award from the National Cancer Institute (K01 CA91905-01).
References
- 1.Conlon I, Raff M. Size control in animal development. Cell. 1999;96:235–244. doi: 10.1016/s0092-8674(00)80563-2. [DOI] [PubMed] [Google Scholar]
- 2.Cooper EH, Barkhan P, Hale AJ. Observations on the proliferation of human leucocytes cultured with phytohaemagglutinin. Br J Haematol. 1963;9:101–111. doi: 10.1111/j.1365-2141.1963.tb05446.x. [DOI] [PubMed] [Google Scholar]
- 3.Hedeskov CJ. Early effects of phytohaemagglutinin on glucose metabolism of normal human lymphocytes. Biochem J. 1968;110:373–380. doi: 10.1042/bj1100373. [DOI] [PMC free article] [PubMed] [Google Scholar]
- 4.Sagone AL, Jr, LoBuglio AF, Balcerzak SP. Alterations in hexose monophosphate shunt during lymphoblastic transformation. Cell Immunol. 1974;14:443–452. doi: 10.1016/0008-8749(74)90195-6. [DOI] [PubMed] [Google Scholar]
- 5.Roos D, Loos JA. Changes in the carbohydrate metabolism of mitogenically stimulated human peripheral lymphocytes. I Stimulation by phytohaemagglutinin. Biochim Biophys Acta. 1970;222:565–582. doi: 10.1016/0304-4165(70)90182-0. [DOI] [PubMed] [Google Scholar]
- 6.Kutchai H, Geddis LM. Regulation of glycolysis in rat aorta. Am J Physiol. 1984;247:C107–C114. doi: 10.1152/ajpcell.1984.247.1.C107. [DOI] [PubMed] [Google Scholar]
- 7.Koebmann BJ, Westerhoff HV, Snoep JL, Nilsson D, Jensen PR. The glycolytic flux in Escherichia coli is controlled by the demand for ATP. J Bacteriol. 2002;184:3909–3916. doi: 10.1128/JB.184.14.3909-3916.2002. [DOI] [PMC free article] [PubMed] [Google Scholar]
- 8.Garcia-Martinez C, Sibille B, Solanes G, Darimont C, Mace K, Villarroya F, Gomez-Foix AM. Overexpression of UCP3 in cultured human muscle lowers mitochondrial membrane potential, raises ATP/ADP ratio, and favors fatty acid vs. glucose oxidation. FASEB J. 2001;15:2033–2035. doi: 10.1096/fj.00-0828fje. [DOI] [PubMed] [Google Scholar]
- 9.Peuchen S, Duchen MR, Clark JB. Energy metabolism of adult astrocytes in vitro. Neuroscience. 1996;71:855–870. doi: 10.1016/0306-4522(95)00480-7. [DOI] [PubMed] [Google Scholar]
- 10.Guppy M, Abas L, Arthur PG, Whisson ME. The Pasteur effect in human platelets: Implications for storage and metabolic control. Br J Haematol. 1995;91:752–757. doi: 10.1111/j.1365-2141.1995.tb05381.x. [DOI] [PubMed] [Google Scholar]
- 11.Rathmell JC, Vander Heiden MG, Harris MH, Frauwirth KA, Thompson CB. In the absence of extrinsic signals, nutrient utilization by lymphocytes is insufficient to maintain either cell size or viability. Mol Cell. 2000;6:683–692. doi: 10.1016/s1097-2765(00)00066-6. [DOI] [PubMed] [Google Scholar]
- 12.Vander Heiden MG, Plas DR, Rathmell JC, Fox CJ, Harris MH, Thompson CB. Growth factors can influence cell growth and survival through effects on glucose metabolism. Mol Cell Biol. 2001;21:5899–5912. doi: 10.1128/MCB.21.17.5899-5912.2001. [DOI] [PMC free article] [PubMed] [Google Scholar]
- 13.Hanahan D, Weinberg RA. The hallmarks of cancer. Cell. 2000;100:57–70. doi: 10.1016/s0092-8674(00)81683-9. [DOI] [PubMed] [Google Scholar]
- 14.Gadina M, Hilton D, Johnston JA, Morinobu A, Lighvani A, Zhou YJ, Visconti R, O'Shea JJ. Signaling by type I and II cytokine receptors: Ten years after. Curr Opin Immunol. 2001;13:363–373. doi: 10.1016/s0952-7915(00)00228-4. [DOI] [PubMed] [Google Scholar]
- 15.Gu H, Maeda H, Moon JJ, Lord JD, Yoakim M, Nelson BH, Neel BG. New role for Shc in activation of the phosphatidylinositol 3-kinase/Akt pathway. Mol Cell Biol. 2000;20:7109–7120. doi: 10.1128/mcb.20.19.7109-7120.2000. [DOI] [PMC free article] [PubMed] [Google Scholar]
- 16.Guthridge MA, Stomski FC, Barry EF, Winnall W, Woodcock JM, McClure BJ, Dottore M, Berndt MC, Lopez AF. Site-specific serine phosphorylation of the IL-3 receptor is required for hemopoietic cell survival. Mol Cell. 2000;6:99–108. [PubMed] [Google Scholar]
- 17.Whetton AD, Bazill GW, Dexter TM. Stimulation of hexose uptake by haemopoietic cell growth factor occurs in WEHI-3B myelomonocytic leukaemia cells: A possible mechanism for loss of growth control. J Cell Physiol. 1985;123:73–78. doi: 10.1002/jcp.1041230112. [DOI] [PubMed] [Google Scholar]
- 18.Fleming HE, Paige CJ. Pre-B cell receptor signaling mediates selective response to IL-7 at the pro-B to pre-B cell transition via an ERK/MAP kinase-dependent pathway. Immunity. 2001;15:521–531. doi: 10.1016/s1074-7613(01)00216-3. [DOI] [PubMed] [Google Scholar]
- 19.Parry RV, Rumbley CA, Vandenberghe LH, June CH, Riley JL. CD28 and inducible costimulatory protein Src homology 2 binding domains show distinct regulation of phosphatidylinositol 3-kinase, Bcl-xL, and IL-2 expression in primary human CD4 T lymphocytes. J Immunol. 2003;171:166–174. doi: 10.4049/jimmunol.171.1.166. [DOI] [PubMed] [Google Scholar]
- 20.Wilson JE. Rapid purification of mitochondrial hexokinase from rat brain by a single affinity chromatography step on Affi-Gel blue. Prep Biochem. 1989;19:13–21. doi: 10.1080/10826068908544893. [DOI] [PubMed] [Google Scholar]
- 21.Sapico V, Anderson RL. Regulation of D-fructose 1-phosphate kinase by potassium ion. J Biol Chem. 1970;245:3252–3256. [PubMed] [Google Scholar]
- 22.Schumacker PT, Chandel N, Agusti AG. Oxygen conformance of cellular respiration in hepatocytes. Am J Physiol. 1993;265:L395–L402. doi: 10.1152/ajplung.1993.265.4.L395. [DOI] [PubMed] [Google Scholar]
- 23.Guthridge MA, Stomski FC, Thomas D, Woodcock JM, Bagley CJ, Berndt MC, Lopez AF. Mechanism of activation of the GM-CSF, IL-3, and IL-5 family of receptors. Stem Cells. 1998;16:301–313. doi: 10.1002/stem.160301. [DOI] [PubMed] [Google Scholar]
- 24.Nunez G, London L, Hockenbery D, Alexander M, McKearn JP, Korsmeyer SJ. Deregulated Bcl-2 gene expression selectively prolongs survival of growth factor-deprived hemopoietic cell lines. J Immunol. 1990;144:3602–3610. [PubMed] [Google Scholar]
- 25.Karnauskas R, Niu Q, Talapatra S, Plas DR, Greene ME, Crispino JD, Rudin CM. Bcl-x(L) and Akt cooperate to promote leukemogenesis in vivo. Oncogene. 2003;22:688–698. doi: 10.1038/sj.onc.1206159. [DOI] [PubMed] [Google Scholar]
- 26.Culvenor JG, Weidemann MJ. Phytohaemagglutinin stimulation of rat thymus lymphocytes glycolysis. Biochim Biophys Acta. 1976;437:354–363. doi: 10.1016/0304-4165(76)90005-2. [DOI] [PubMed] [Google Scholar]
- 27.Eto K, Tsubamoto Y, Terauchi Y, Sugiyama T, Kishimoto T, Takahashi N, Yamauchi N, Kubota N, Murayama S, Aizawa T, et al. Role of NADH shuttle system in glucose-induced activation of mitochondrial metabolism and insulin secretion. Science. 1999;283:981–985. doi: 10.1126/science.283.5404.981. [DOI] [PubMed] [Google Scholar]
- 28.Krauss S, Brand MD. Quantitation of signal transduction. FASEB J. 2000;14:2581–2588. doi: 10.1096/fj.00-0064com. [DOI] [PubMed] [Google Scholar]
- 29.Riley JL, Blair PJ, Musser JT, Abe R, Tezuka K, Tsuji T, June CH. ICOS costimulation requires IL-2 and can be prevented by CTLA-4 engagement. J Immunol. 2001;166:4943–4948. doi: 10.4049/jimmunol.166.8.4943. [DOI] [PubMed] [Google Scholar]
- 30.Salway JG. Metabolism at a glance. Blackwell Science Ltd.; Oxford: 1999. [Google Scholar]
- 31.Voet D, Voet JG, Pratt CW. Fundamentals of Biochemistry. John Wiley and Sons, Inc.; New York: 2002. [Google Scholar]
- 32.Pfeiffer T, Schuster S, Bonhoeffer S. Cooperation and competition in the evolution of ATP-producing pathways. Science. 2001;292:504–507. doi: 10.1126/science.1058079. [DOI] [PubMed] [Google Scholar]
- 33.Warburg O. On the origin of cancer cells. Science. 1956;123:309–314. doi: 10.1126/science.123.3191.309. [DOI] [PubMed] [Google Scholar]
- 34.Dang CV, Semenza GL. Oncogenic alterations of metabolism. Trends Biochem Sci. 1999;24:68–72. doi: 10.1016/s0968-0004(98)01344-9. [DOI] [PubMed] [Google Scholar]
- 35.Crabtree HG. Observations on the carbohydrate metabolism of tumours. Biochem J. 1929;23:536–545. doi: 10.1042/bj0230536. [DOI] [PMC free article] [PubMed] [Google Scholar]
- 36.Plas DR, Talapatra S, Edinger AL, Rathmell JC, Thompson CB. Akt and Bcl-xL promote growth factor-independent survival through distinct effects on mitochondrial physiology. J Biol Chem. 2001;276:12,041–12,048. doi: 10.1074/jbc.M010551200. [DOI] [PubMed] [Google Scholar]
- 37.Fox CJ, Hammerman PS, Cinalli RM, Master SR, Chodosh LA, Thompson CB. The serine/threonine kinase Pim-2 is a transcriptionally regulated apoptotic inhibitor. Genes Dev. 2003;17:1841–1854. doi: 10.1101/gad.1105003. [DOI] [PMC free article] [PubMed] [Google Scholar]
- 38.Kohn AD, Summers SA, Birnbaum MJ, Roth RA. Expression of a constitutively active Akt Ser/Thr kinase in 3T3-L1 adipocytes stimulates glucose uptake and glucose transporter 4 translocation. J Biol Chem. 1996;271:31,372–31,378. doi: 10.1074/jbc.271.49.31372. [DOI] [PubMed] [Google Scholar]
- 39.Rathmell JC, Fox CJ, Plas DR, Hammerman PS, Cinalli RM, Thompson CB. Akt-directed glucose metabolism can prevent Bax conformation change and promote growth factor-independent survival. Mol Cell Biol. 2003;23:7315–7328. doi: 10.1128/MCB.23.20.7315-7328.2003. [DOI] [PMC free article] [PubMed] [Google Scholar]
- 40.Deprez J, Vertommen D, Alessi DR, Hue L, Rider MH. Phosphorylation and activation of heart 6-phosphofructo-2-kinase by protein kinase B and other protein kinases of the insulin signaling cascades. J Biol Chem. 1997;272:17,269–17,275. doi: 10.1074/jbc.272.28.17269. [DOI] [PubMed] [Google Scholar]