

Abstract
Aims
Myoglobin is a haem protein produced in skeletal muscles. Serum concentrations of myoglobin have been proposed as a surrogate marker of muscle mass and function in both cachectic cancer patients and healthy non-cancer individuals. Creatinine, a metabolite of creatine phosphate, an energy store found in skeletal muscle, is produced at a constant rate from skeletal muscle. Urinary and plasma creatinine have been used in clinical practice as indicators of skeletal muscle mass in health and disease. Our study aimed to test the hypothesis that plasma myoglobin and creatinine concentration could accurately predict skeletal muscle mass and aerobic capacity in colorectal cancer (CRC) patients and matched healthy controls and thereby an indicative of aerobic performance.
Methods
We recruited 47 patients with CRC and matching number of healthy volunteers for this study. All participants had their body composition measured by dual-energy X-ray absorptiometry scan, aerobic capacity measured to anaerobic threshold (AT) by cardiopulmonary exercise testing and filled in objective questionnaires to assess the qualitative functions. This study was carried out in accordance with the Declaration of Helsinki, after approval by the local National Health Service (NHS) Research Ethics Committee.
Results
Age-matched groups had similar serum myoglobin and creatinine concentrations in spite of differences in their aerobic capacity. AT was significantly lower in the CRC group compared with matched controls (1.18 ± 0.44 vs. 1.41 ± 0.71 L/min; P < 0.01). AT had significant correlation with lean muscle mass (LMM) among these groups, but myoglobin and creatinine had poor correlation with LMM and AT.
Conclusions
Serum myoglobin is a poor predictor of muscle mass, and serum myoglobin and creatinine concentrations do not predict aerobic performance in CRC patients or healthy matched controls.
Keywords: Myoglobin, Cancer, Muscle, Creatinine, Colorectal, Performance
Introduction
The most common gastrointestinal cancer, colorectal cancer (CRC)1,2 accounts for almost 16 000 deaths in the UK per annum,3 making it the country's third most common cancer and the second most common cause of cancer-related death. Rare below the age of 50, the incidence of CRC rises exponentially after 60 years.4 Therefore, most patients who have CRC are elderly and often have significant co-morbidities.
Optimization of peri-operative care, chemo-radiotherapy, and operative techniques has resulted in improved survival for patients undergoing CRC resection,5 with operative mortality decreasing year on year and currently between 2.3 and 4.3%.6 Morbidity rates, however, remain high (approximately 24%), negatively impacting on hospital length of stay (LoS), critical care dependency, and long-term outcomes.7,8 Identification of those individuals at risk of complications and increased LoS is important, not only in trying to reduce morbidity but in risk stratification, targeted post-surgical care, and discharge planning. Current risk stratification tools such as the Physiological and Operative Severity Score for the enUmeration of Mortality and morbidity commonly fail to accurately predict surgical morbidity, especially at extremes of age and functional status9 and are only valid after operation and not pre-operatively. Accurate pre-operative risk prediction therefore remains a significant clinical challenge.
One approach to the identification of the high-risk surgical patient that has shown promise is the evaluation of cardiorespiratory performance. Although estimation of exercise tolerance based on verbal history or static cardiac and pulmonary functions is unreliable as a predictor of peri-operative performance, cardiopulmonary exercise testing (CPET), used to measure the capacity for oxygen delivery, has been identified as a good predictor of mortality and morbidity following major surgery.10–12 Unfortunately, CPET is not universally available and exposes the patient to a small risk of non-fatal adverse event, of approximately one in 2000, dependent upon pre-existing comorbidity.13,14
Similarly, skeletal muscle mass has also been shown to be an important predictor of post-operative LoS and complications, serving as a prognostic factor for surgical outcome.15 The muscle wasting seen in cancer patients is most aggressive in those with gastrointestinal solid tumours, where weight loss is experienced by over half of patients.16,17 Indeed, up to 60% of patients display some degree of muscle atrophy and approximately a quarter lose 5% of their body weight in the 6 months before diagnosis.15,18,19 Previous research has revealed a close correlation between aerobic performance and muscle mass in health,20–22 and indicated that pre-operative muscle loss may influence peri-operative outcome, increasing mortality and morbidity in cancer patients undergoing major gastrointestinal surgery.23,24 Furthermore, surgery itself places metabolic demands upon the body,25 resulting in marked changes in body composition with further losses of lean muscle mass (LMM) in already cachectic patients.26 However, muscle wasting is not easily recognized pre-operatively by clinical examination and body weight changes, as variations are frequently masked by oedema, ascites, or increased adiposity due to altered nutrition.
There is therefore a need for a clinically applicable marker of muscle mass that can be easily acquired in the clinical environment pre-operatively, with predictive value for physical performance, post-operative outcome, and risk stratification, before major intra-abdominal surgery in cancer patients. Two metabolites of skeletal muscle, myoglobin and creatinine, have previously been suggested as surrogate markers fulfilling the aforementioned criteria.20,27–29
Myoglobin is a haem protein produced within skeletal muscle, which binds oxygen and acts as the primary oxygen delivery protein in skeletal muscle. It is also most prevalent in Type 1 and 2a muscle fibres,30 the fibres intimately involved in aerobic exercise performance.31 It has been proposed as a surrogate marker of muscle mass and function in cachectic cancer patients and healthy non-cancer individuals.20,32,33 Creatinine a metabolite of creatine phosphate, an energy store found in skeletal muscles, is produced at a constant rate from skeletal muscles. Similarly, urinary and plasma creatinine have been used in clinical practice as indicators of skeletal muscle mass in health and disease.28,29
Using a prospective study design, this study aimed to test the hypothesis that plasma myoglobin and creatinine concentration could accurately predict skeletal muscle mass [assessed by dual-energy X-ray absorptiometry (DXA)] and aerobic capacity (measured by CPET) in CRC patients and matched healthy controls and that these measures were, by extension, indicative of aerobic performance.
Materials and methods
Subject characteristics and study protocol
The study was carried out in accordance with the Declaration of Helsinki, after approval by the local NHS Research Ethics Committee (REC 08/H0401/101). All subjects gave their written, informed consent to participate in the study. Two groups of subjects were recruited; one consisting of CRC patients without distant metastasis on pre-operative staging and the other consisting of healthy volunteers. Consecutive CRC patients eligible to be included were approached in a clinic to be included in the study. The two groups were matched by age, sex, and weight. Before commencing the study, all subjects were screened for metabolic, respiratory, or cardiovascular disorders using a medical questionnaire, physical examination, and resting ECG. Exclusion criteria for both groups were the following: neoadjuvant chemoradiotherapy, strenuous exercise, intramuscular injection in the 48 h preceding assessment, known neuropathy or myopathy, wheelchair-bound individuals or those with mobility problems and pregnancy. Subjects were also required to have normal blood chemistry results and to have blood pressure within normal limits (BP < 140/90). Individuals with well-controlled hypertension were not excluded from the study. All subjects were studied on one occasion; for the CRC patients, this was pre-operatively within 4 weeks of surgery.
A required sample size of 92 subjects was estimated based on previously published work,41 assuming a variation of 0.12 with a power of 80% and significance level of 5% (nQuery Advisor Version 5, Statistical Solutions Ltd, Ireland). Previous experience in our unit yielded a recruitment rate of 25% of total eligible patients. Therefore, we aimed to recruit 46 CRC patients in 18 months concurrently with matched volunteer controls, making a total of 92 recruits. Potential CRC subjects were identified in the colorectal multidisciplinary team meeting after a diagnosis of CRC had been made and absence of distant metastasis confirmed. Healthy volunteers were recruited through advertisements placed in the surgical outpatients department and throughout the Derby Hospitals NHS Foundation Trust and University of Nottingham.
Measurement of body composition
Subjects were instructed to refrain from unaccustomed exercise for 48 h and from alcohol and caffeine for 24 h before study days. All subjects fasted from 9 p.m. the night before, with water ad libitum. Studies began at 9 a.m. with measurement of body weight, height, and body composition, measured by DXA (Lunar Prodigy II, GE Medical Systems).34 DXA is well accepted, precise, and reproducible (±5%) in the measurement of whole body and regional (e.g. limb) muscle mass. Although not as precise or sensitive as computed tomography (CT) or magnetic resonance imaging (MRI), DXA is much cheaper and more accessible than CT or MRI and avoids relatively high doses of ionizing radiation in the case of CT.35–37 DXA also compares well with other recognized methods of body composition measurement such as neutron activation and total body K analysis.28,38–42
Measurement of anaerobic threshold
After the DXA scan, CPET was performed using a Lode Corival cycle ergometer (Lode Corival, Lode, Groningen, Netherlands) and an online gas analysis system (ZAN 680, nSpire Health, Longmont, CO, USA) using a standard protocol while supervised by a medically qualified doctor. In brief, after equipment calibration and explanation of the study protocol, subjects were seated on the ergometer, and the position was adjusted to fit. Subjects were then fitted with a face-mask from which inspired and expired gases were sampled during exercise. In order to ensure accurate gas analysis, masks were checked for any leaks prior to exercise. Following this, participants sat at rest on the bike for 2 min, then, following a 2 min warm-up period, cycling workload was increased in a ramped step-wise manner by 20 W/min (4 W 12 s−1), with individuals encouraged to maintain a cadence of 60–70 rpm. Subjects were verbally encouraged to exercise to 85% or more of predicted maximal heart rate and to a respiratory exchange ratio (VCO2/VO2) above 1.1. Tests were deemed complete once the attending clinician was sure that AT had been achieved. A 12-lead ECG was measured continuously throughout the test (CardioCollect12S, DelMar Reynolds) and non-invasive blood pressure collected every 2 min. Tests were terminated in the event of severe dyspnoea, systolic blood pressure reduction >20 mmHg, significant arrhythmias, ischaemic ECG changes, angina pain, exercise blood pressure >250 mmHg systolic or 115 mmHg diastolic, or inability to maintain a cycling cadence of 60–70 rpm. On completion of the study, AT was calculated from the data recorded, by two independent trained observers blinded to participant group, using the dual criteria of the V-slope and ventilatory equivalents methods12 from graphs generated using ZAN 680 software and determined as the mean of these two values.
Venous blood
For collection of serum, a sample of whole venous blood was drawn into a BD vacutainer serum separator tube (Becton, Dickinson and Company, Franklin Lakes, New Jersey, USA) and immediately centrifuged at 3000 rpm for 10 min at 4°C to separate the serum fraction of the sample. Serum was then removed and stored at −80°C in for analysis (within 6 months). In addition, further bloods were also drawn from volunteer and patient groups, including for routine pre-operative assessment in the patient group. These samples were analysed for plasma creatinine and full blood count using standard automated laboratory techniques within the Derby Hospitals NHS Trust.
Myoglobin enzyme-linked immunosorbent assay
Serum myoglobin was measured using a human myoglobin enzyme-linked immunosorbent assay immunoassay kit (DRG International Inc., Springfield, NJ, USA) according to the manufacturer's instructions, by an individual unaware of participant group. In brief, after slow thawing, serum samples were diluted 10-fold with sample diluent before use. Twenty microlitres of diluted serum sample or control, of known myoglobin concentration, were dispensed into the appropriate wells on a pre-coated 96-well plate before 200 mL of enzyme conjugate reagent was added into each well. Plates were mixed thoroughly for 30 s on a plate-shaker (Multiskan Ascent plate reader, Ascent software V 2.6, Thermo Scientific, Waltham, MA, USA) and incubated at room temperature (18–25°C) for 45 min. The content of the wells was then removed and the plate washed five times with de-ionized water. During each wash, any residual water was removed by striking the wells sharply onto paper towel. After the wash step, 100 μL of tetramethyl-benzidine reagent was added to each well, and the plate was gently mixed for 5 s. Plates were then incubated at room temperature for 20 min, after which the reaction was stopped by the addition of 100 μL of stop-solution to each well. Following a gentle 30 s mix, absorbance was read within 15 min at 450 nm using a microtitre plate reader.
Statistical analysis
All statistical analyses were carried out using Statistical Package for the Social Sciences (SPSS v20; IBM Armonk, NY, USA). The significance level was set at P < 0.05. Descriptive data are presented as mean ± standard deviation (SD) or median with range. Data were tested for normal distribution using the Shapiro–Wilk test and compared using the Student's t-test or Mann–Whitney U-test as appropriate. Correlations were explored using Pearson's R correlation, with results expressed as a coefficient of determination (r2).
Results
Body composition
In total, 94 individuals were recruited to the study, 47 patients with CRC awaiting surgical resection and 47 matched controls. All individuals reached AT as defined by the study protocol with no study drop-outs. Patients with CRC were matched for age and gender with healthy controls (age: 65.04 ± 7.7 vs. 65.8 ± 7.3 years; P = 0.58; gender (M:F): 33:14 vs. 27:20; P = 0.28 (Table 1). Body mass index (BMI) was 28.46 ± 0.62 kg/m2 in the CRC patients and 26.92 ± 0.5 kg/m2 in the healthy controls (P = 0.06). There was no significant difference in LMM between CRC patients and controls (50 530 ± 1575 vs. 47 320 ± 1373 g; P = 0.13). Despite similar LMM, CRC patients were significantly heavier than controls (81.64 ± 2.19 vs. 74.94 ± 1.8 kg; P = 0.02). None of the CRC patients had distant metastases on pre-operative cross-sectional imaging (Table 2) or at operation. There was no significant difference between groups in terms of co-morbid conditions.
Table 1.
Table of participant demographics and characteristics
| Characteristic | Control | CRC | P value |
|---|---|---|---|
| n (male:female) | 47 (27:20) | 47 (33:14) | 0.28 |
| Age (years) | 65.8 ± 7.3 | 65.04 ± 7.7 | 0.58 |
| Height (cm) | 166.8 ± 1.35 | 168.6 ± 1.34 | 0.36 |
| Weight (kg) | 74.94 ± 1.87 | 81.64 ± 2.19 | 0.02 |
| BMI (kg/m2) | 26.92 ± 0.51 | 28.46 ± 0.62 | 0.06 |
| AT (L/min) | 1.41 ± 0.71 | 1.18 ± 0.44 | <0.01 |
| LMM (g) | 47320 ± 1373 | 50530 ± 1575 | 0.13 |
| Hb (g/L) | 13.1 ± 0.3 | 12.6 ± 0.4 | 0.32 |
| Myoglobin (µg/L) | 44.03 ± 4.45 | 53.64 ± 9.95 | 0.38 |
| Creatinine (mg/dL) | 80.08 ± 2.75 | 83.51 ± 2.82 | 0.39 |
| Co-morbid conditions | |||
| Respiratory | 9 | 10 | 0.24 |
| Cardiac | 15 | 15 | 1.0 |
| Renal and diabetes mellitus | 4 | 6 | 0.74 |
| Other (including controlled hypertension) | 13 | 9 | 0.47 |
AT, anaerobic threshold; BMI, body mass index; CRC, colorectal cancer; LMM, lean muscle mass.
Data presented as mean and standard deviation, with data analysed via Student's t-test, Mann–Whitney U-test, or Fisher's exact test as appropriate.
Table 2.
Tumour node metastases staging for colorectal cancer study participants
| TNM stage | Description | n |
|---|---|---|
| Tis N0 M0 | Tis: Tumour confined to mucosa; cancer-in-situ | 2 |
| T1 N0 M0 | T1: Tumour invades submucosa | 2 |
| T2 N0 M0 | T2: Tumour invades muscularis propria | 12 |
| T3 N0 M0 | T3: Tumour invades subserosa or beyond (without other organs involved) | 16 |
| T4 N0 M0 | T4: Tumour invades adjacent organs or perforates the visceral peritoneum | 3 |
| T1-2 N1 M0 | N1: metastasis to one to three regional lymph nodes. T1 or T2. | 3 |
| T3-4 N1 M0 | N1: metastasis to one to three regional lymph nodes. T3 or T4. | 8 |
| any T, N2 M0 | N2: metastasis to four or more regional lymph nodes. Any T. | 1 |
| any T, any N, M1 | M1: distant metastases present. Any T, any N. | 0 |
TNM, tumour node metastases.
Serum analytes
Serum myoglobin levels were within the normal range in both groups, and there was no significant difference between CRC patients and controls (53.64 ± 9.95 vs. 44.03 ± 4.45 ng/dL; P = 0.38). Serum creatinine levels were also within the normal range in both groups, and again there was no significant difference between groups (83.51 ± 2.82 vs. 80.08 ± 2.75 nmol/L; P = 0.39). There was a statistically significant correlation between creatinine and LMM in both groups (control: r2 = 0.22, P < 0.01; CRC: r2 = 0.14, P = 0.01) and in all participants when analysed together (r2 = 0.18, P < 0.0001). There was not a significant correlation between LMM and myoglobin in either group or when all study participants were analysed as a whole (control: r2 = 0.03, P = 0.3; CRC: r2 = 0.04, P = 0.19; all participants: r2 = 0.04, P = 0.07) (Figure 1).
Figure 1.
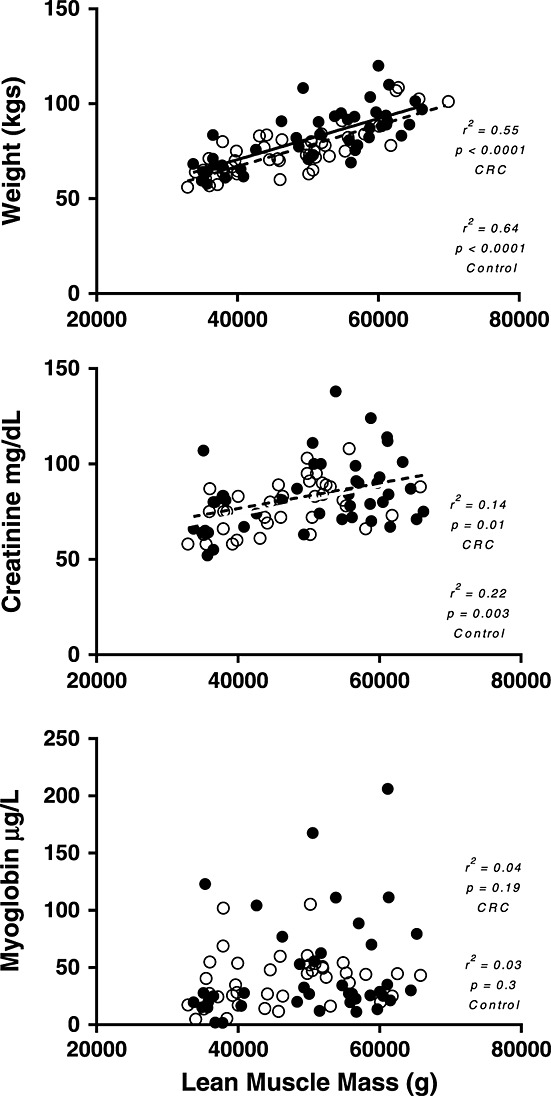
Plots of (A) weight (kg) vs. lean muscle mass (g), (B) creatinine (mg/dL) vs. lean muscle mass (g), and (C) myoglobin (µg/dL) vs. lean muscle mass (g). Open circles represent control group, while closed circles represent colorectal cancer patients (CRC).
Cardio-pulmonary exercise testing
Anaerobic threshold was significantly lower in the CRC group compared with matched controls (1.18 ± 0.44 vs. 1.41 ± 0.71 L/min; P < 0.01). In both CRC and control groups, AT showed a strong correlation with LMM (CRC: r2 = 0.38, P < 0.0001; control: r2 = 0.41, P < 0.0001; all participants: r2 = 0.26, P < 0.0001) but a weaker correlation with body weight (CRC: r2 = 0.20, P < 0.01; control: r2 = 0.19, P = 0.01). There was no significant or clinically meaningful correlation between either creatinine or myoglobin and AT in either the control group (creatinine: r2 = 0.03, P = 0.34; myoglobin: r2 < 0.01, P = 0.99) or the CRC patients (creatinine: r2 = 0.11, P = 0.04; myoglobin: r2 = 0.05, P = 0.16). Correlation between the independent observers calculation of AT was high (r = 0.79) (Figure 2).
Figure 2.
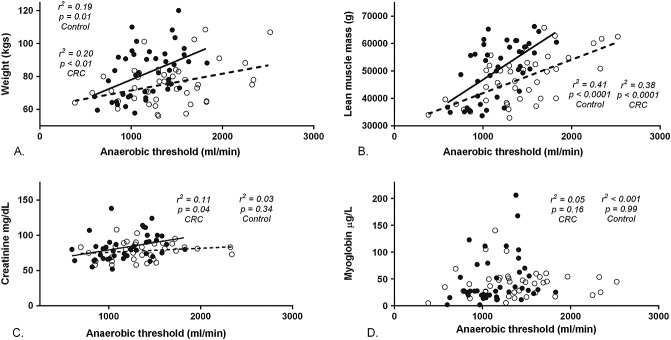
Plots of anaerobic threshold (mL/min) vs. (A) weight (kg), (B) lean muscle mass (g), (C) creatinine, (D) myoglobin (µg L−). Open circles represent control group, while closed circles represent colorectal cancer patients (CRC).
Discussion
The results of this study demonstrate that plasma myoglobin is a poor predictor of muscle mass, and that plasma myoglobin and creatinine concentrations do not predict aerobic performance in CRC patients or healthy matched controls. Conversely, weight was strongly predictive of LMM in these two populations. Moreover, both weight and LMM predict aerobic performance, with LMM closely related to aerobic performance in both health and CRC.
Despite previous smaller studies in disparate groups of cancers suggesting that myoglobin can be used as a surrogate predictive marker of functionally relevant muscle mass and aerobic performance in health and cancer states,20 using a larger cohort and homogeneous cancer location, we found no clear relationship between plasma myoglobin concentration and LMM or aerobic performance (CPET assessed AT) in healthy individuals or CRC patients. This is despite myoglobin being most highly expressed in the muscle fibres closely associated with aerobic performance.43
In tandem with previous studies, we do, however, find a significant, albeit weak, correlation between plasma creatinine concentration and LMM. This relationship was present in both healthy volunteers and individuals suffering from CRC, mirroring previous studies in the literature which report creatinine's ability to predict LMM in healthy individuals and those suffering from chronic renal disease.29,44 Plasma creatinine was, however, inconsistently related to aerobic performance, showing no correlation with aerobic performance in health and only a weak relationship in CRC, indicating its limited utility as a marker of diminished functional performance.
This study does, however, show that the simple measure of DXA-assessed LMM is strongly predictive of AT in both healthy volunteers and patients with non-disseminated CRC, demonstrating a coefficient of determination of approximately 40%. This close relationship suggests that routine quantification of LMM via DXA could help recognize those patients with a diminished aerobic capacity prior to surgery and therefore identify those who may benefit from more rigorous pre-operative testing.
We accept that there are a number of limitations in this study. Firstly, individuals were not exercised to VO2 max but to AT. This was based on a pragmatic clinical decision that many patients may find exercising to maximal effort distressing and/or unachievable. In light of the literature supporting the use of AT as an exercise end-point in the pre-operative patient45 we do not think this decision negatively impacts upon our findings. Secondly, the mean AT threshold for the CRC patients studied in this present investigation was 14.4 mL/kg/min, and above the level generally considered to elicit concern during pre-operative assessment.46 There is therefore clearly a need for further work to either confirm or refute the association between LMM and aerobic performance at lower values of AT. We have no reason to believe, given the clear relationship between aerobic performance and LMM that this relationship would not be maintained at lower anaerobic thresholds. In addition, individuals were not exercised through individually tailored protocols, but at a fixed 20 W/min ramp, introducing the possibility of error when calculating AT for those at the extremes of fitness levels. Finally, both our CRC patients and healthy controls had BMI values within the normal range for a pre-operative population. Results of this study might not extend to the sarcopenic and/or obese patient.
Conclusion
This study shows a relationship between LMM and aerobic performance in healthy individuals that is preserved in non-disseminated CRC, and refutes the suggestion that plasma myoglobin or creatinine may be a clinically useful marker of functional muscle mass, and by extension aerobic performance, in the pre-operative CRC patient or indeed healthy volunteers. Measurement of LMM is an effective surrogate for aerobic performance in health and non-disseminated CRC and could be used pre-operatively to identify individuals who would benefit from a more extensive pre-operative assessment.
Acknowledgments
The authors would like to thank all of the study participants for their time and effort. They would also like to thank M. Baker and A. Gates for their technical assistance. The authors of this manuscript certify that they comply with the ethical guidelines for authorship and publishing in the Journal of Cachexia, Sarcopenia, and Muscle 2010;1:7–8 (von Haehling S, Morley JE, Coats AJ, and Anker SD).
Conflict of interest
None declared.
References
- ONS. Mortality statistics: cause. England and Wales, 2007. LONDON, UK: National Statistics; 2007. cited 2008. [Google Scholar]
- (WCISU), T.W.C.a.I.a.S.U. 2007. Trends in incidence, 1985–2005.
- Wild SH, Fischbacher CM, Brock A, Griffiths C, Bhopal R. Mortality from all cancers and lung, colorectal, breast and prostate cancer by country of birth in England and Wales, 2001–2003. Br J Cancer. 2006;94:1079–1085. doi: 10.1038/sj.bjc.6603031. [DOI] [PMC free article] [PubMed] [Google Scholar]
- Coleman MP, Estève J, Damiecki P, Arslan A, Renard H. Trends in cancer incidence and mortality. IARC Sci Publ. 1993;121:1–806. doi: 10.3109/9780415874984-2. [DOI] [PubMed] [Google Scholar]
- Moller H, Sandin F, Robinson D, Bray F, Klint S, Linklater KM, et al. Colorectal cancer survival in socioeconomic groups in England: variation is mainly in the short term after diagnosis. Eur J Cancer. 2012;48:46–53. doi: 10.1016/j.ejca.2011.05.018. [DOI] [PubMed] [Google Scholar]
- HQIP. 2013. National Bowel Cancer Audit - Annual Report 2013.
- Kumamoto T, Nojiri K, Matsuyama R, Takeda K, Endo I. Impact of postoperative morbidity on long-term survival after resection for colorectal liver metastases. Ann Surg Oncol. 2010 doi: 10.1245/s10434-010-1352-1. [DOI] [PubMed] [Google Scholar]
- Law WL, Poon JT, Fan JK, Lo OS. Survival following laparoscopic versus open resection for colorectal cancer. Int J Colorectal Dis. 2012;27:1077–1085. doi: 10.1007/s00384-012-1424-8. [DOI] [PMC free article] [PubMed] [Google Scholar]
- Tekkis PP, Kessaris N, Kocher HM, Poloniecki JD, Lyttle J, Windsor AC. Evaluation of POSSUM and P-POSSUM scoring systems in patients undergoing colorectal surgery. Br J Surg. 2003;90:340–345. doi: 10.1002/bjs.4037. [DOI] [PubMed] [Google Scholar]
- Carlisle J, Swart M. Mid-term survival after abdominal aortic aneurysm surgery predicted by cardiopulmonary exercise testing. Br J Surg. 2007;94:966–969. doi: 10.1002/bjs.5734. [DOI] [PubMed] [Google Scholar]
- Older P, Hall A. Clinical review: how to identify high-risk surgical patients. Crit Care. 2004;8:369–372. doi: 10.1186/cc2848. [DOI] [PMC free article] [PubMed] [Google Scholar]
- Older P, Hall A, Hader R. Cardiopulmonary exercise testing as a screening test for perioperative management of major surgery in the elderly. Chest. 1999;116:355–362. doi: 10.1378/chest.116.2.355. [DOI] [PubMed] [Google Scholar]
- Balady GJ, Arena R, Sietsema K, Myers J, Coke L, Fletcher GF, et al. Clinician's guide to cardiopulmonary exercise testing in adults: a scientific statement from the American Heart Association. Circulation. 2010;122:191–225. doi: 10.1161/CIR.0b013e3181e52e69. [DOI] [PubMed] [Google Scholar]
- Skalski J, Allison TG, Miller TD. The safety of cardiopulmonary exercise testing in a population with high-risk cardiovascular diseases. Circulation. 2012;126:2465–2472. doi: 10.1161/CIRCULATIONAHA.112.110460. [DOI] [PubMed] [Google Scholar]
- Pichard C, Kyle UG, Morabia A, Perrier A, Vermeulen B, Unger P. Nutritional assessment: lean body mass depletion at hospital admission is associated with an increased length of stay. Am J Clin Nutr. 2004;79:613–618. doi: 10.1093/ajcn/79.4.613. [DOI] [PubMed] [Google Scholar]
- Fearon KC. Cancer cachexia: developing multimodal therapy for a multidimensional problem. Eur J Cancer. 2008;44:1124–1132. doi: 10.1016/j.ejca.2008.02.033. [DOI] [PubMed] [Google Scholar]
- Meyerhardt JA, Giovannucci EL, Holmes MD, Chan AT, Chan JA, Colditz GA, et al. Physical activity and survival after colorectal cancer diagnosis. J Clin Oncol. 2006;24:3527–3534. doi: 10.1200/JCO.2006.06.0855. [DOI] [PubMed] [Google Scholar]
- Fearon K, Strasser F, Anker SD, Bosaeus I, Bruera E, Fainsinger RL, et al. Definition and classification of cancer cachexia: an international consensus. Lancet Oncol. 2011;12:489–495. doi: 10.1016/S1470-2045(10)70218-7. [DOI] [PubMed] [Google Scholar]
- Fearon KC. Cancer cachexia and fat-muscle physiology. N Engl J Med. 2011;365:565–567. doi: 10.1056/NEJMcibr1106880. [DOI] [PubMed] [Google Scholar]
- Weber MA, Kinscherf R, Krakowski-Roosen H, Aulmann M, Renk H, Künkele A, et al. Myoglobin plasma level related to muscle mass and fiber composition - a clinical marker of muscle wasting? J Mol Med. 2007;85:887–896. doi: 10.1007/s00109-007-0220-3. [DOI] [PubMed] [Google Scholar]
- Proctor DN. Joyner MJ. Skeletal muscle mass and the reduction of VO2max in trained older subjects. J Appl Physiol. 1997;82:1411–1415. doi: 10.1152/jappl.1997.82.5.1411. (1985) [DOI] [PubMed] [Google Scholar]
- Bassett DR, Jr, Howley ET. Limiting factors for maximum oxygen uptake and determinants of endurance performance. Med Sci Sports Exerc. 2000;32:70–84. doi: 10.1097/00005768-200001000-00012. [DOI] [PubMed] [Google Scholar]
- Garth AK, Newsome CM, Simmance N, Crowe TC. Nutritional status, nutrition practices and post-operative complications in patients with gastrointestinal cancer. J Hum Nutr Diet. 2010;23:393–401. doi: 10.1111/j.1365-277X.2010.01058.x. [DOI] [PubMed] [Google Scholar]
- Brown SC, Abraham JS, Walsh S, Sykes PA. Risk factors and operative mortality in surgery for colorectal cancer. Ann R Coll Surg Engl. 1991;73:269–272. [PMC free article] [PubMed] [Google Scholar]
- Brunelli A, Charloux A, Bolliger CT, Rocco G, Sculier JP, Varela G, et al. ERS/ESTS clinical guidelines on fitness for radical therapy in lung cancer patients (surgery and chemo-radiotherapy) Eur Respir J. 2009;34:17–41. doi: 10.1183/09031936.00184308. [DOI] [PubMed] [Google Scholar]
- Carli F, Schricker T. Modulation of the catabolic response to surgery. Nutrition. 2000;16:777–780. doi: 10.1016/s0899-9007(00)00385-3. [DOI] [PubMed] [Google Scholar]
- Forbes GB, Bruining GJ. Urinary creatinine excretion and lean body mass. Am J Clin Nutr. 1976;29:1359–1366. doi: 10.1093/ajcn/29.12.1359. [DOI] [PubMed] [Google Scholar]
- Heymsfield SB, Arteaga C, McManus C, Smith J, Moffitt S. Measurement of muscle mass in humans: validity of the 24-hour urinary creatinine method. Am J Clin Nutr. 1983;37:478–494. doi: 10.1093/ajcn/37.3.478. [DOI] [PubMed] [Google Scholar]
- Schutte JE, Longhurst JC, Gaffney FA, Bastian BC, Blomqvist CG. Total plasma creatinine: an accurate measure of total striated muscle mass. J Appl Physiol Respir Environ Exerc Physiol. 1981;51:762–766. doi: 10.1152/jappl.1981.51.3.762. [DOI] [PubMed] [Google Scholar]
- Wittenberg BA, Wittenberg JB. Transport of oxygen in muscle. Annu Rev Physiol. 1989;51:857–878. doi: 10.1146/annurev.ph.51.030189.004233. [DOI] [PubMed] [Google Scholar]
- Westerblad H, Bruton JD, Katz A. Skeletal muscle: energy metabolism, fiber types, fatigue and adaptability. Exp Cell Res. 2010;316:3093–3099. doi: 10.1016/j.yexcr.2010.05.019. [DOI] [PubMed] [Google Scholar]
- Minetto MA, Lanfranco F, Botter A, Motta G, Mengozzi G, Giordano R, et al. Do muscle fiber conduction slowing and decreased levels of circulating muscle proteins represent sensitive markers of steroid myopathy? A pilot study in Cushing's disease. Eur J Endocrinol. 2011;164:985–993. doi: 10.1530/EJE-10-1169. [DOI] [PubMed] [Google Scholar]
- Cicoira M, Zanolla L, Franceschini L, Rossi A, Golia G, Zamboni M, et al. Skeletal muscle mass independently predicts peak oxygen consumption and ventilatory response during exercise in noncachectic patients with chronic heart failure. J Am Coll Cardiol. 2001;37:2080–2085. doi: 10.1016/s0735-1097(01)01306-7. [DOI] [PubMed] [Google Scholar]
- Holmes JD, Andrews DM, Durkin JL, Dowling JJ. Predicting in vivo soft tissue masses of the lower extremity using segment anthropometric measures and DXA. J Appl Biomech. 2005;21:371–382. doi: 10.1123/jab.21.4.371. [DOI] [PubMed] [Google Scholar]
- Khan AA, Brown J, Faulkner K, Kendler D, Lentle B, Leslie W, et al. Standards and guidelines for performing central dual X-ray densitometry from the Canadian Panel of International Society for Clinical Densitometry. J Clin Densitom. 2002;5:435–445. doi: 10.1385/jcd:5:4:435. [DOI] [PubMed] [Google Scholar]
- Khan AA, Colquhoun A, Hanley DA, Jankowski LG, Josse RG, Kendler DL, et al. Standards and guidelines for technologists performing central dual-energy X-ray absorptiometry. J Clin Densitom. 2007;10:189–195. doi: 10.1016/j.jocd.2007.01.005. [DOI] [PubMed] [Google Scholar]
- Simonelli C, Adler RA, Blake GM, Caudill JP, Khan A, Leib E, et al. Dual-energy X-ray absorptiometry technical issues: the 2007 isCd official positions. J Clin Densitom. 2008;11:109–122. doi: 10.1016/j.jocd.2007.12.009. [DOI] [PubMed] [Google Scholar]
- Heymsfield SB. Anthropometric measurements: application in hospitalized patients. Infusionstherapie. 1990;17:48–51. doi: 10.1159/000222552. (Suppl 3): [DOI] [PubMed] [Google Scholar]
- Heymsfield SB, Lichtman S. New approaches to body composition research: a reexamination of two-compartment model assumptions. Infusionstherapie. 1990;17:4–8. doi: 10.1159/000222544. (Suppl 3): [DOI] [PubMed] [Google Scholar]
- Heymsfield SB, Lichtman S, Baumgartner RN, Wang J, Kamen Y, Aliprantis A, et al. Body composition of humans: comparison of two improved four-compartment models that differ in expense, technical complexity, and radiation exposure. Am J Clin Nutr. 1990;52:52–58. doi: 10.1093/ajcn/52.1.52. [DOI] [PubMed] [Google Scholar]
- Heymsfield SB, Smith R, Aulet M, Bensen B, Lichtman S, Wang J, et al. Appendicular skeletal muscle mass: measurement by dual-photon absorptiometry. Am J Clin Nutr. 1990;52:214–218. doi: 10.1093/ajcn/52.2.214. [DOI] [PubMed] [Google Scholar]
- Heymsfield SB, Wang J, Aulet M, Kehayias J, Lichtman S, Kamen Y, et al. Dual photon absorptiometry: validation of mineral and fat measurements. Basic Life Sci. 1990;55:327–337. doi: 10.1007/978-1-4613-1473-8_45. [DOI] [PubMed] [Google Scholar]
- Wittenberg JB, Wittenberg BA. Myoglobin function reassessed. J Exp Biol. 2003;206:2011–2020. doi: 10.1242/jeb.00243. (Pt 12): [DOI] [PubMed] [Google Scholar]
- Noori N, Kopple JD, Kovesdy CP, Feroze U, Sim JJ, Murali SB, et al. Mid-arm muscle circumference and quality of life and survival in maintenance hemodialysis patients. Clin J Am Soc Nephrol. 2010;5:2258–2268. doi: 10.2215/CJN.02080310. [DOI] [PMC free article] [PubMed] [Google Scholar]
- Older P. Anaerobic threshold, is it a magic number to determine fitness for surgery? Perioperat Med. 2013;2:2. doi: 10.1186/2047-0525-2-2. (Lond) [DOI] [PMC free article] [PubMed] [Google Scholar]
- Wilson RJ, Davies S, Yates D, Redman J, Stone M. Impaired functional capacity is associated with all-cause mortality after major elective intra-abdominal surgery. Br J Anaesth. 2010;105:297–303. doi: 10.1093/bja/aeq128. [DOI] [PubMed] [Google Scholar]