

Abstract
Malaise trap sampling of Hemiptera (Heteroptera; Auchenorrhyncha) was conducted at 500 m intervals along an elevational gradient from 200 m to 3,700 m on the east slope of Mount Wilhelm, Madang Province, Papua New Guinea. Hemiptera had a decrease in morphospecies richness and overall abundance with increasing elevation, however, the Heteroptera did not exhibit either pattern. A few species were relatively abundant at each elevation, whereas the majority of species were represented by ≤5 specimens. Morphospecies richness of Auchenorrhyncha, Cicadomorpha, Fulgoromorpha, Cicadellidae, Cixiidae, and Derbidae also decreased with increasing elevation but abundance decline was not significant due to the large number of specimens captured at 200 m relative to those captured at higher elevations. The percentage of Cicadomorpha specimens decreased with increasing elevation relative to that of the Fulgoromorpha which increased with increasing elevation. Environmental factors that may influence patterns of species richness along the elevational gradient are discussed.
Keywords: Altitude, Biodiversity, Cicadomorpha, Fulgoromorpha, Elevational gradient
Introduction
The high organismic diversity of tropical rainforests has been the focus of numerous studies including those that document the diversity of selected taxa and others that seek to elucidate patterns. One type of pattern that emerges is the change in species richness and differences in the composition of insect communities with increasing elevation (Whittaker, 1952; Brühl, Mohamed & Linsenmair, 1999; Van Ingen, Campos & Andersen, 2008). Some studies found a decrease in species richness with increasing elevation (Hunter & Yonzon, 1992; Vázquez & Givnish, 1998) whereas some found the opposite—an increase in species richness with increasing elevation (Sanders, Moss & Wagner, 2003; Hodkinson, 2005). About half of the studies evaluated by Rahbek (2005) indicate that species richness increases, reaches a peak, then declines with increasing elevation, but this or other patterns can result from differences in spatial grain and sampling methodology (Janzen et al., 1976; Grytnes & Vetaas, 2002; Grytnes, Heegaard & Ihlen, 2006; Wiens et al., 2007; Guo et al., 2013). Suggested reasons for these patterns include: size of the habitat; isolation from similar communities; primary productivity as affected by temperature, length of the growing season and organism response to changing environmental conditions; and resource and habitat suitability (Hodkinson, 2005; McCain & Grytnes, 2010).
Papua New Guinea, which has the third largest expanse of tropical rainforest in the world (Brooks et al., 2006), provides opportunities to examine patterns of species richness and elevation in numerous taxa. Mount Wilhelm (4,509 m) has been the focus of studies of plant communities and elevational gradients (Brass, 1964; Hope, 1976; Munzinger et al., 2013), but few studies of the structure of phytophagous insect communities relative to their host plants have been conducted (Novotny et al., 2005; Dem, 2011).
Studies of taxa within the Hemiptera can provide useful insights about the ecological bases for distribution. Members of the Suborder Auchenorrhyncha are particularly suitable for study because, with the exception of some fungivores, almost all species are sap-feeders on xylem, phloem, or mesophyll as larvae and adults (Tonkyn & Whitcomb, 1987; Della Giustina, 1989; McKamey, 1999; Attié et al., 2008). Furthermore, they are basal heterotrophs which, relative to their host plant associations, have been treated as members of sap-feeding guilds (Denno, 1980), and many are monophagous or have a limited host plant range (Wilson et al., 1994). As well, measures of their species richness and diversity have been used as indicators of habitat quality —the “Auchenorrhyncha Quality Index” (Wallner, Molano-Flores & Dietrich, 2012; Spagnolo et al., 2014). However, relatively few studies have focused on the Auchenorrhyncha (McCoy, 1990; Novotný, 1992; Novotný, 1993; McKamey, 1999).
Studies of biodiversity and elevational gradients are “natural experiments” that can evaluate ecological theories on climate change as they are keys to understanding how changes in abiotic factors, especially temperature, can affect faunal and floral distribution (Guo et al., 2013; Sundqvist, Sanders & Wardle, 2013).
The focus of our study is to document the distribution of Auchenorrhyncha and Heteroptera along a rainforest elevational gradient, to determine the effect of elevation on species richness and abundance, and to discuss the factors affecting distribution.
Materials and Methods
Study area
The study was conducted along an elevational transect on the northeast aspect of Mount Wilhelm in Papua New-Guinea (Fig. 1). The transect followed the crests of the east slope of the mountain from 5°44′14.89″S, 145°19′56.13″E to 5°47′27.23″S, 145°3′29.58″E and began at 200 m elevation and extended to 3,700 m (Table 1), which represents the limit of the forest. The zonation of vegetation along the mountain slope (Hope, 1976) corresponds to changes in temperature and humidity. At elevations less than 1,000 m the tropical rainforest is dominated by Dipterocarpaceae, the average daily temperature fluctuates between 25 and 30 °C, and rainfall is greater than 4,000 mm/year. Between 1,000 m and 2,500 m, Lauraceae and Fagaceae are dominant and the average daily temperature ranges from 15 to 20 °C. From 2,500 m to 3,000 m, Podocarpaceae become increasingly abundant and the average daily temperature is ca. 12 °C. Above 3,000 m the sub-alpine vegetation is dominated by tree ferns, Cyatheaceae, the average daily temperature is ca. 8 °C, and rainfall is <3,400 mm/year (Table 2) (Hope, 1976; Munzinger et al., 2013; Duvot, 2013). Ninety-seven percent of the land in Papua new Guinea is owned by village communities. As such, they are important players in the preservation of the enormous biodiversity on their lands. Deforestation pressure is high but remote communities, height clans in total, from Wanang and Mt Wilhelm villages decided to be involved in the project and opted for conservation instead of logging. Thus, the collecting sites were chosen according to the possibilities to access them and their qualities. Even if the villagers have an certain impact on the primary forest, the selected sites were well preserved. The human pressure and damages on the primary vegetation were higher for the sites bellow 1,000 m.
Figure 1. Location of collecting sites in Papua New Guinea.
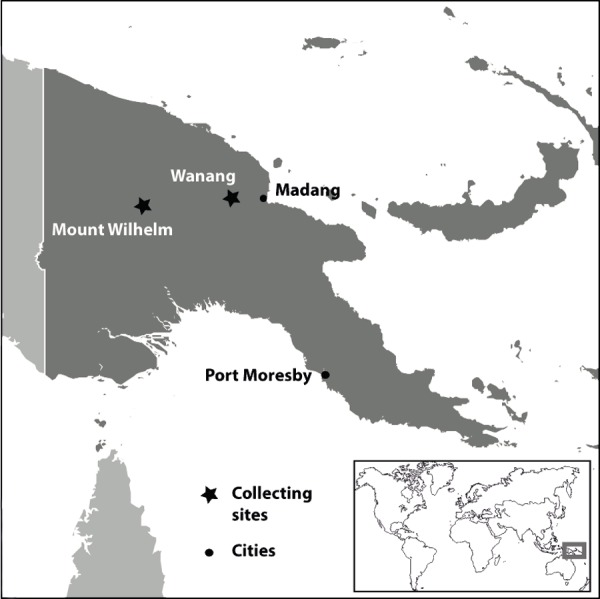
Table 1. Location of the Malaise traps.
| Latitude | Longitude | Elevation | ||
|---|---|---|---|---|
| 200 m | Plot A | 5°44′23.63″S | 145°19′47.07″E | 293 m |
| Plot B | 5°44′27.71″S | 145°19′45.79″E | 333 m | |
| Plot C | 5°44′41.24″S | 5°44′41.24″S | 375 m | |
| Plot D | 5°44′14.89″S | 145°19′56.13″E | 214 m | |
| 700 m | Plot A | 5°43′55.06″S | 145°15′7.79″E | 728 m |
| Plot B | 5°43′57.71″S | 145°15′20.04″E | 736 m | |
| Plot C | 5°43′57.05″S | 145°15′24.54″E | 757 m | |
| Plot D | 5°43′39.91″S | 145°15′28.59″E | 837 m | |
| 1,200 m | Plot A | 5°43′15.15″S | 145°16′10.07″E | 1,188 m |
| Plot B | 5°43′15.68″S | 145°16′13.09″E | 1,201 m | |
| Plot C | 5°43′15.24″S | 145°16′17.28″E | 1,223 m | |
| Plot D | 5°43′16.93″S | 145°16′13.10″E | 1,199 m | |
| 1,700 m | Plot A | 5°45′34.45″S | 145°14′8.19″E | 1872 m |
| Plot B | 5°45′35.68″S | 145°14′5.02″E | 1,874 m | |
| Plot C | 5°45′39.30″S | 145°13′24.72″E | 1,885 m | |
| Plot D | 5°45′11.56″S | 145°14′13.32″E | 1,614 m | |
| 2,200 m | Plot A | 5°45′32.32″S | 145°11′9.84″E | 2073 m |
| Plot B | 5°45′36.64″S | 145°11′10.53″E | 2,070 m | |
| Plot C | 5°45′39.70″S | 145°11′9.72″E | 2,066 m | |
| Plot D | 5°45′26.25″S | 145°11′0.29″E | 2,134 m | |
| 2,700 m | Plot A | 5°48′54.98″S | 145°9′23.28″E | 2,688 m |
| Plot B | 5°48′53.88″S | 145°9′28.66″E | 2,680 m | |
| Plot C | 5°48′53.06″S | 145°9′31.80″E | 2,654 m | |
| Plot D | 5°48′53.54″S | 145°9′20.17″E | 2,696 m | |
| 3,200 m | Plot A | 5°48′24.11″S | 145°4′22.52″E | 3,180 m |
| Plot B | 5°48′26.71″S | 145°4′25.08″E | 3,076 m | |
| Plot C | 5°48′25.00″S | 145°4′19.70″E | 3,182 m | |
| Plot D | 5°48′4.65″S | 145°4′8.61″E | 3,361 m | |
| 3,700 m | Plot A | 5°47′10.11″S | 145°3′35.44″E | 3,750 m |
| Plot B | 5°47′13.82″S | 145°3′34.46″E | 3,697 m | |
| Plot C | 5°47′8.32″S | 145°3′28.94″E | 3,746 m | |
| Plot D | 5°47′27.23″S | 145°3′29.58″E | 3,574 m |
Table 2. Temperatures along the elevational gradient.
| <1,000 m | 1,000–2,500 m | 2,500–3,000 m | >3,000 m | |
|---|---|---|---|---|
| Max. temperature (°C) | 29.7 | 27.3 | 13.1 | 6.1 |
| Min. temperature (°C) | 24.8 | 15.3 | 9.7 | 10.4 |
| Mean daily temperature (°C) | 27.38 | 18.34 | 12.12 | 8.38 |
Study material
We focused on collecting specimens of the hemipteran suborders Heteroptera and Auchenorrhyncha, although we also collected a few Sternorrhyncha (Table 3). The Auchenorrhyncha consists of the Fulgoromorpha (planthoppers) with 21 families, and the Cicadomorpha (leafhoppers, froghoppers, treehoppers, and cicadas) with 12 families (Cryan, 2005; Bourgoin, 2013; Soulier-Perkins, 2013), one of which, the Cicadellidae (leafhoppers), represented the majority of collected specimens.
Table 3. Species richness and abundance of Hemiptera collected along an elevational gradient on Mt. Wilhelm, Papua New Guinea.
| Number of | ||
|---|---|---|
| Taxon | Morphospecies | Specimens |
| Heteroptera | 46 | 217 |
| Auchenorryncha | ||
| Cicadomorpha | ||
| Cicadellidae | 303 | 2,544 |
| Cicadellidae (larvae) | 23 | 29 |
| Cercopidae | 11 | 19 |
| Aphroporidae | 1 | 1 |
| Cicadidae | 3 | 3 |
| Membracidae | 2 | 2 |
| Fulgoromorpha | ||
| Fulgoromoprha (larvae) | 23 | 47 |
| Cixiidae | 53 | 179 |
| Delphacidae | 18 | 24 |
| Derbidae | 63 | 116 |
| Achilidae | 19 | 72 |
| Meenoplidae | 6 | 41 |
| Dictyopharidae | 2 | 2 |
| Flatidae | 5 | 6 |
| Issidae | 2 | 2 |
| Fulgoridae | 1 | 1 |
| Ricaniidae | 1 | 1 |
| Sternorrhyncha | ||
| Aleyrodoidea | 3 | 3 |
| Coccoidea | 1 | 1 |
| Psylloidea | 8 | 8 |
Sampling method
Sampling was conducted for 16 days, from 25 October to 10 November 2012 at eight sites placed every 500 m along the elevational transect on the east aspect of Mount Wilhelm. Four Malaise traps (Gibb & Oseto, 2006) were placed at random at each site; after placing the first Malaise trap the three others were set up every 100 m following the same contour line. After we observed numerous ants on the Malaise traps set up at 200 m, we established a ninth sampling site employing the same protocol at Wanang from 18 November to 4 December at 200 m in order to provide samples untouched by ants, if needed. The contents of each trap were collected each day by the parataxonomists from the Binatang research center and preserved in 90% ethyl alcohol and placed in a zip-lock bag. The material was sorted to family before being exported from Papua New Guinea under permit number 012297 granted by the Department of Environment and Conservation of Papua New Guinea.
All specimens were examined at the Muséum National d’Histoire Naturelle (Paris, France) using a Leica MZ16 stereo microscope and identified to morphospecies which is a useful means of identifying large numbers of specimens for ecological studies (Oliver & Beattie, 1993; New, 1998). Photographs using a Canon EOS 50D of representatives of each morphospecies were taken in order to facilitate identification. Recognition of morphospecies was based on morphological characters of the head, thorax, abdomen and legs. Each morphospecies is vouchered accordingly to the elevation, the trap and the day it was collected (see Supplemental Information).
Data analysis
The relationship between elevation and morphospecies richness and abundance was examined using Pearson product moment correlations (Roscoe, 1975) and the Shannon–Weiner Diversity Index (Krebs, 1989). A factorial correspondence analysis (FCA) was also used (ade4 package, Dray & Dufour, 2007) in R, version 3.0.2 (R Development Core Team, 2013) to study the arrangement of morphospecies along the elevational gradient (Benzécri, 1964). For this multivariate analysis, each morphospecies was coded 1 if present and 0 if not; each line represented a trap and each column a morphospecies.
Results
In total, 4,205 specimens were sorted and 713 morphospecies identified; 3,318 specimens representing 596 morphospecies were from the collecting stations on Mount Wilhelm, the remainder were collected in Wanang and used as reference material for our study (Table 3; Supplemental Information).
Morphospecies distribution
A succession of morphospecies was observed along the elevational gradient. Each morphospecies was rarely collected at more than one elevation (Table 4); one cicadellid species was collected from 200 to 2,200 m but in diminishing numbers. From 6% to 19% of the morphospecies consisted of more than five specimens at any given elevation whereas 81% to 94% of morphospecies were represented by five or fewer specimens (Table 5).
Table 4. Number of identical morphospecies collected at each elevation (m).
| Elevation (m) | ||||||||
|---|---|---|---|---|---|---|---|---|
| 200 | 700 | 1,200 | 1,700 | 2,200 | 2,700 | 3,200 | 3,700 | |
| 200 | – | 22 | 5 | 2 | 1 | 0 | 0 | 0 |
| 700 | 22 | – | 9 | 3 | 0 | 0 | 0 | 0 |
| 1,200 | 5 | 9 | – | 4 | 0 | 1 | 0 | 0 |
| 1,700 | 2 | 3 | 4 | – | 6 | 2 | 2 | 0 |
| 2,200 | 1 | 0 | 0 | 6 | – | 4 | 2 | 0 |
| 2,700 | 0 | 0 | 0 | 2 | 4 | – | 8 | 0 |
| 3,200 | 0 | 0 | 0 | 2 | 2 | 8 | – | 5 |
| 3,700 | 0 | 0 | 0 | 0 | 0 | 0 | 5 | – |
Table 5. Relative morphospecies richness (%) at each elevation (m).
| Elevation (m) | ||||||||
|---|---|---|---|---|---|---|---|---|
| 200 | 700 | 1,200 | 1,700 | 2,200 | 2,700 | 3,200 | 3,700 | |
| % >5 | 14 | 8 | 6 | 11 | 7 | 8 | 8 | 19 |
| % ≤5 | 86 | 92 | 94 | 89 | 93 | 93 | 92 | 81 |
| N | 163 | 133 | 69 | 72 | 81 | 40 | 52 | 21 |
Analysis via Factorial Components Analysis suggested that there was a succession of morphospecies along the elevational gradient and that there were few species that occurred at more than one elevation (Table 4; Figs. 2 and 3).
Figure 2. Factorial Correspondence Analysis (FCA) of the arrangement of morphospecies (x-axis) along the elevational gradient.
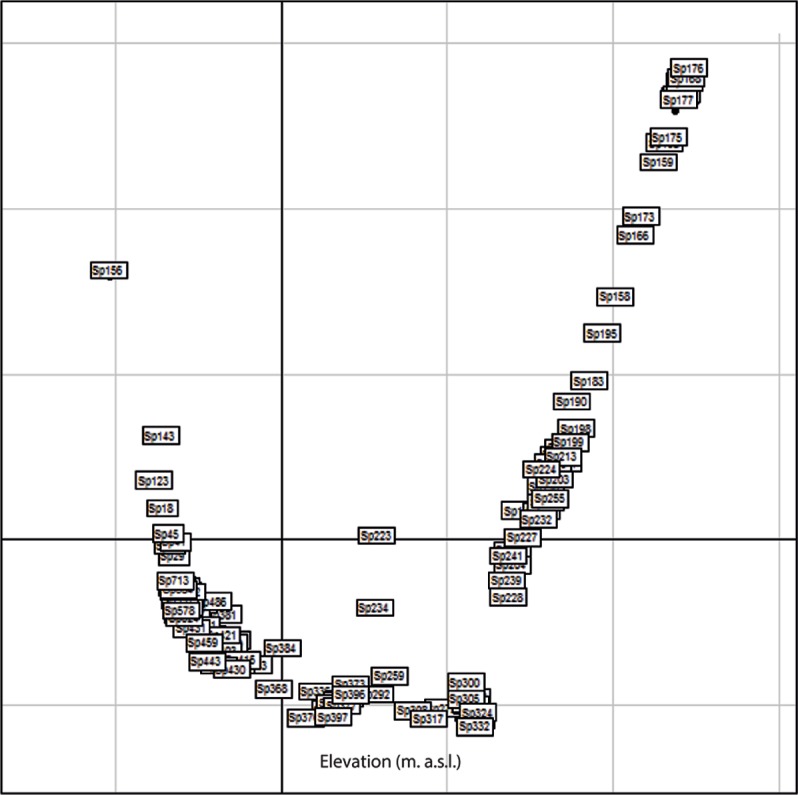
Each block corresponds to a morphospecies.
Figure 3. Factorial Correspondence Analysis (FCA) of the arrangement of collecting traps (x-axis) along the elevational gradient.
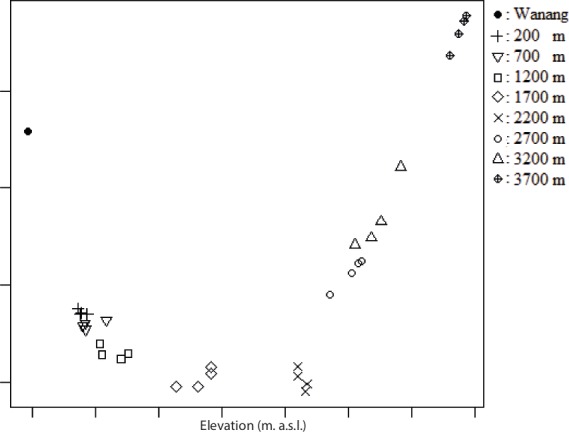
Groupings indicate that traps at the same elevation had shared morphospecies.
Morphospecies richness
Overall species richness declined with increasing elevation (Fig. 4A; Table 6). Examining the relationship between elevation and each taxon revealed that there was no relationship between elevation and Heteroptera species richness (Fig. 4B). A pattern of decreasing richness with increasing elevation was found for the Auchenorrhyncha (Fig. 4C) as well as for the Cicadomorpha, Fulgoromorpha, Cixiidae, and Derbidae (Table 6).
Figure 4. Elevation, species richness, and abundance.

(A–C) Elevation and species richness. (D–F) Elevation and abundance. (A, D) Hemiptera. (B, E) Heteroptera. (C, F) Auchenorrhyncha. ∗p < 0.05.
Table 6. Relationship among morphospecies richness and abundance and elevation (m).
| Taxon | Regressiona | r 2 | Significance |
|---|---|---|---|
| Secies richness | |||
| Hemiptera | y = − 0.033x + 141.11 | 0.83 | * |
| Heteroptera | y = − 0.001 + 8.93 | 0.11 | – |
| Auchenorrhyncha | y = − 0.03x + 130.96 | 0.83 | * |
| Cicadomorpha | y = − 0.02x + 86.14 | 0.72 | * |
| Fulgoromorpha | y = − 0.01x + 45.75 | 0.92 | * |
| Cicadellidae | y = − 0.022x + 83.66 | 0.72 | * |
| Cixiidae | y = − 0.003x + 12.98 | 0.71 | * |
| Derbidae | y = − 0.004x + 17.14 | 0.79 | * |
| Abundance | |||
| Hemiptera | y = − 0.30x + 998.10 | 0.50 | – |
| Heteroptera | y = − 0.01x + 14.22 | 0.07 | – |
| Auchenorrhyncha | y = − 0.31x + 984.00 | 0.51 | – |
| Cicadomorpha | y = − 0.271x + 850.63 | 0.52 | – |
| Fulgoromorpha | y = − 0.0371x + 133.37 | 0.43 | – |
| Cicadellidae | y = − 0.27x + 846.45 | 0.52 | – |
| Cixiidae | y = − 0.012x + 46.46 | 0.28 | – |
| Derbidae | y = − 0.005x + 24.71 | 0.34 | – |
Notes.
Pearson Product Moment Correlation.
p < 0.05.
Morphospecies abundance
The number of specimens captured by the traps appeared to decrease with increasing elevation; however, the correlation was not significant (Fig. 4D; Table 6). As with species richness, no relationship was found between elevation and the abundance of Heteroptera (Fig. 4E). Similarly, species abundance appeared to decrease with increasing elevation for the Auchenorrhyncha (Fig. 4F), the Cicadomorpha, Fulgoromorpha, Cicadellidae, Cixiidae, and Derbidae (Table 6); however, the correlations were not significant. The large number of specimens captured at 200 m relative to those captured at higher elevations resulted in correlations that were not significant.
Shannon–Weiner Diversity Indices. The highest diversity indices were at the two lowest elevations, which corresponds to the patterns of morphospecies richness and abundance (Figs. 4A and 4D; Table 7). Between 1,200 m and 3,700 m the diversity indices increased then declined.
Table 7. Shanon–Weiner diversity indices and elevation (m).
| Elevation | Shannon Wiener index |
|---|---|
| 200 | 2.558 |
| 700 | 1.529 |
| 1,200 | 0.519 |
| 1,700 | 1.252 |
| 2,200 | 1.293 |
| 2,700 | 1.092 |
| 3,200 | 1.161 |
| 3,700 | 0.922 |
Cicadomorpha and Fulgoromorpha species richness
As indicated above, the Auchenorrhyncha species richness decreased with increasing elevation which led us to further examine species richness patterns in the Cicadomorpha and Fulgoromorpha. Comparison of the proportions of Cicadomorpha relative to Fulgoromorpha suggested that the proportion of Fulgoromorpha increased with increasing elevation. The number of cicadomorph specimens collected at 3,200 m appears to refute this suggestion; however, one cicadellid morphospecies represented 73.5% of all Cicadomorpha collected at this elevation. After removing this morphospecies from the analyses, we found that the Fulgoromorpha represented an increasing proportion of Auchenorrhyncha from ca. 10% at 200 m to ca. 40% at 2,700 m (Fig. 5).
Figure 5. Relative percentages of the number of Cicadomorpha and Fulgoromorpha at each elevation (m).
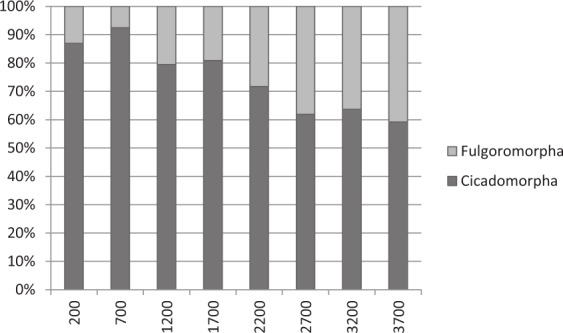
(One morphospecies of cicadellid was removed from analysis).
Discussion
Morphospecies distribution, richness, and abundance
Factorial Components Analysis indicated that there was a sequence of morphospecies corresponding to the elevational gradient of Mount Wilhelm. There was a negative correlation of species richness and elevation for the Hemiptera. There was no relationship between species richness and elevation for the Heteroptera, which may be because of weak association with plant taxa as some were polyphagous and others predaceous (Schuh & Slater, 1995). The Auchenorrhyncha, Cicadomorpha, Fulgoromorpha, Cicadellidae, Cixiidae, and Derbidae all had the highest species richness at the lowest elevation and richness generally decreased with increasing elevation. As noted above, Auchenorrhyncha species are phytophagous (Mitter, Farrell & Wiegmann, 1988), Cicadomorpha are phloem, xylem, or mesophyll feeders, Fulgoromorpha feed on phloem or fungi (Tonkyn & Whitcomb, 1987; Wilson et al., 1994) and numerous species of these taxa are mono- or oligophagous (Wilson et al., 1994; Attié et al., 2008). The greatest plant diversity occurred at the lowest elevations with three other plant communities occurring at ca. 1,000, 2,500, and 3,000 m in elevation, respectively (Hope, 1976; Hodkinson, 2005). Differences in plant diversity and communities are likely factors that explain, in part, the observed elevation gradient in species richness.
Abiotic factors that may explain the distribution of the hemipteran taxa include the climatic changes that occur with increasing elevation. Temperature and rainfall decrease significantly from 25–30 °C and ca. 4,000 mm/year at lower elevations to <8 °C and ca. 3,400 mm/year at the highest elevation. These factors directly affect insect development and survival and correspond to the zonation of the vegetation which indirectly affects the distribution of hemipterans (McCain & Grytnes, 2010; Régnière et al., 2012; Savopoulou-Soultani et al., 2012).
Species richness decreased with increasing elevation which is similar to patterns observed in several studies (Hunter & Yonzon, 1992; Vázquez & Givnish, 1998). The abiotic factors cited above can explain, in part, the decrease in species richness with increasing elevation that we observed. Although species richness generally decreased with elevation, there were slight increases in richness at 2,200 m and 3,200 m (Figs. 4A and 4C). An increase in hemipteran species richness at these two elevations was also observed by Dem (2011). This hump-shaped pattern was also inferred from the Shannon–Weiner Diversity Indices between 1,200 and 3,700 m (Table 7) and has been found in more detailed studies of other insect taxa (McCoy, 1990; Brehm, Colwell & Kluge, 2007). Slightly higher species richness at these elevations could correspond to regions where plant communities from lower and higher elevations intergrade, or it could be a response to the distribution of insectivores (Sam et al., 2014).
At every taxonomic level evaluated, there was no correlation between abundance and elevation (Figs. 4D and 4F) with very large numbers of specimens captured at the lowest elevations and substantially fewer at higher elevations (except for the Heteroptera). For the Auchenorrhyncha species, abundance increased at 2,200 m and 3,200 m (Fig. 4F), which could correspond to regions where plant communities from lower and higher elevations intergrade.
Species richness and elevation and sampling methodology
Malaise trap sampling is a very effective means of sampling a portion of an insect community, but as with any single collecting technique, it cannot provide a complete survey of the insect fauna (Leather & Watt, 2005; Ozanne, 2005). Apterous and brachypterous insects, those that do not leave their host plants, and those that live in the forest canopy are less likely to be captured in the traps. Placement of traps in areas where vegetation is too dense or too sparse will affect capture rate (Ozanne, 2005). This was addressed in our study by random placement of the four traps at each site with the expectation that traps placed in areas with an adequate representation of the hemipteran fauna will compensate for those placed in less suitable areas (Smith, 2013).
Papua New Guinea has a tropical climate with alternating wet and dry seasons. Accurate sampling of hemipterans is a function of the linkage of life cycles to this seasonality. We collected for a short period of time; however, it was done during the optimum collecting period for planthoppers and leafhoppers (Novotný & Basset, 1998).
Cicadomorpha and Fulgoromorpha species richness and abundance
The Cicadomorpha and Fulgoromorpha were the dominant taxa in terms of species richness and abundance (Table 3). The relative percentages of the numbers of Cicadomorpha and Fulgoromorpha collected at each elevation (Fig. 5) indicated that the proportion of Cicadomorpha decreased with increasing elevation whereas the Fulgoromorpha increased. However in order to show this general pattern, one morphospecies of cicadellid was removed from the analysis. Its outbreaks in the Malaise traps tended to mask the inversely proportional tendencies observed between Cicadomorpha and Fulgoromorpha along the altitudinal gradient.
In the Cicadomorpha, the Cicadellidae consisted of 80% of all Hemiptera collected. In addition, only few Cercopidae, one Aphrophoridae, two Membracidae, and three Cicadidae were collected.
In the Fulgoromorpha, the families with the highest species richness and abundance were the Achilidae, Cixiidae, and Derbidae. The remaining six families included substantially fewer morphospecies and individuals (Table 3). The Achilidae have been associated with species in 27 families of plants, the Cixiidae with species in 88 families, and the Derbidae with species in 28 families (Wilson et al., 1994; Bourgoin, 2013). Three of the plant families associated with Cixiidae and Derbidae, Cyatheaceae, Podocarpaceae and Fagacae, are major components of the three highest plant communities along our elevational transect.
Also, these three planthopper families, which represented 79% of morphospecies (N = 170) and 90% (N = 404) of individual planthoppers, have larvae that feed underground on plant roots (Cixidae) or, it is presumed, fungal hyphae (Achilidae, Derbidae) (Wilson et al., 1994).
Our inventory of Hemiptera along an elevational gradient on Mt. Wilhelm resulted in finding no pattern of morphospecies distribution and abundance among Heteroptera but declines in morphospecies richness with increasing elevation in the Auchenorrhyncha and its subgroups. The decreasing proportion of Cicadomorpha morphospecies relative to Fulgoromorpha with increasing elevation may be due to differences in host plant communities or larval habitats and therefore warrants further study.
Supplemental Information
Acknowledgments
This study was conducted in the framework of “Our Planet Reviewed Papua-New-Guinea 2012–2013” supported by Pro-Natura International, the National Museum of Natural History (MNHN, France), the Institut de Recherche pour le Développement (IRD, France) in partnership with the Royal Belgian Institute of Natural Sciences, the New Guinea Binatang Research Center, the University of Papua New Guinea, and the Divine Word University of Madang and with core funding of Prince Albert II of Monaco Foundation, the Stavros Niarchos Foundation, the Total Foundation, the Fondation d’entreprise EDF, the Fonds Pacifique, Spiecapag, Entrepose Contracting, the New-Caledonia Government, the Reef Foundation and the Belgian National Lottery. The IBISCA expert network, Prof. RK Kitching, and all other participants in this collective effort are thanked for their contribution. For providing his advice and comments on the manuscript, we are grateful to Thierry Bourgoin (MNHN, Paris). And last, but not least, we would like to thank Geoff Martin (NHM, London) who corrected our English.
Funding Statement
Funding comes from proper lab fund (Muséum National d’Histoire Naturelle, UMR 7205 MNHN-CNRS) The funders had no role in study design, data collection and analysis, decision to publish, or preparation of the manuscript.
Additional Information and Declarations
Competing Interests
The authors declare there are no competing interests.
Author Contributions
Maxime Le Cesne conceived and designed the experiments, performed the experiments, analyzed the data, contributed reagents/materials/analysis tools, wrote the paper, prepared figures and/or tables.
Stephen W. Wilson analyzed the data, contributed reagents/materials/analysis tools, wrote the paper, prepared figures and/or tables.
Adeline Soulier-Perkins contributed reagents/materials/analysis tools, wrote the paper, prepared figures and/or tables, reviewed drafts of the paper.
Field Study Permissions
The following information was supplied relating to field study approvals (i.e., approving body and any reference numbers):
Department of Environment and Conservation of Papua New Guinea
Permit no 012297.
References
- Attié et al. (2008).Attié M, Bourgoin T, Veslot J, Soulier-Perkins A. Patterns of trophic relationships between planthoppers (Hemiptera: Fulgoromorpha) and their host plants on the Mascarene Islands. Journal of Natural History. 2008;42(23):1591–1638. doi: 10.1080/00222930802106963. [DOI] [Google Scholar]
- Benzécri (1964).Benzécri J-P. Analyse factorielle des proximités. Publications de l’Institut de Statistique de l’Université de Paris. 1964;13:235–282. [Google Scholar]
- Bourgoin (2013).Bourgoin T. FLOW (Fulgoromorpha Lists on the Web): a world knowledge base dedicated to Fulgoromorpha. Version 8, updated (4/12/2013) 2013. Available at http://hemiptera-databases.org/flow/
- Brass (1964).Brass LJ. Results of the Archbold expedition n°86: summary of the sixth Archbold expedition to New Guinea. American Museum of Natural History Bulletin. 1964;127:145–215. [Google Scholar]
- Brehm, Colwell & Kluge (2007).Brehm G, Colwell RK, Kluge J. The role of environment and mid-domain effect on moth species richness along a tropical elevational gradient. Global Ecology and Biogeography. 2007;16:205–219. doi: 10.1111/j.1466-8238.2006.00281.x. [DOI] [Google Scholar]
- Brooks et al. (2006).Brooks TM, Mittermeier RA, Da Fonseca GAB, Gerlach J, Hoffmann M, Lamoreux JF, Mittermeier CG, Pilgram JD, Rodrigues ASL. Global biodiversity conservation priorities. Science. 2006;313:58–61. doi: 10.1126/science.1127609. [DOI] [PubMed] [Google Scholar]
- Brühl, Mohamed & Linsenmair (1999).Brühl CA, Mohamed M, Linsenmair KE. Altitudinal distribution of leaf litter ants a transect in primary forests on Mount Kinabalu, Sabah, Malaysia. Journal of Tropical Ecology. 1999;15:265–277. doi: 10.1017/S0266467499000802. [DOI] [Google Scholar]
- Cryan (2005).Cryan JR. Molecular phylogeny of Cicadomorpha (Insecta: Hemiptera: Cicadoidea, Cercopoidea and Membracoidea): adding evidence to the controversy. Systematic Entomology. 2005;30:563–574. doi: 10.1111/j.1365-3113.2004.00285.x. [DOI] [Google Scholar]
- Della Giustina (1989).Della Giustina W. Homoptère cicadellidae. vol. 3. Paris: Fédération Française des Sociétés de Sciences Naturelles; 1989. p. 350. [Google Scholar]
- Dem (2011).Dem FF. MSc. Thesis. 2011. Community structure of Auchenorrhyncha (Insecta: Hemiptera) along an altitudinal gradient in Papua New-Guinea. [Google Scholar]
- Denno (1980).Denno RF. Ecotope differentiation in a guild of sap-feeding insects on the salt marsh grass, Spartina patens. Ecology. 1980;61:702–714. doi: 10.2307/1937435. [DOI] [Google Scholar]
- Dray & Dufour (2007).Dray S, Dufour AB. The ade4 package: implementing the duality diagram for ecologists. Journal of Statistical Software. 2007;22(4):1–20. [Google Scholar]
- Duvot (2013).Duvot G. Etude de la repartition altitudinale des Hymenoptères sur le mont Wilhelm en Papouasie Nouvelle-Guinée. vol. 1. Université Paris VI: Pierre et Marie Curie, mémoire de master; 2013. p. 18. [Google Scholar]
- Gibb & Oseto (2006).Gibb TJ, Oseto C. Arthopod collection and identificaton: laboratory and field techniques. Burlington: Academic Press; 2006. p. 336. [Google Scholar]
- Grytnes, Heegaard & Ihlen (2006).Grytnes JA, Heegaard E, Ihlen PG. Species richness of vascular plants, bryophytes, and lichens along an altitudinal gradient in western Norway. Acta Oecologica. 2006;29:241–246. doi: 10.1016/j.actao.2005.10.007. [DOI] [Google Scholar]
- Grytnes & Vetaas (2002).Grytnes JA, Vetaas OR. Species reichness and altitude: a comparision between null models and interpolated plant species richness along the Himalayan altitudinal gardient, Nepa. American Naturalist. 2002;159:294–304. doi: 10.1086/338542. [DOI] [PubMed] [Google Scholar]
- Guo et al. (2013).Guo QF, Kelt DA, Sun Z, Liu HX, Hu LJ, Ren H, Wen J. Global variation in elevational diversity patterns. Scientific Report. 2013;3(3007):1–7. doi: 10.1038/srep03007. [DOI] [PMC free article] [PubMed] [Google Scholar]
- Hodkinson (2005).Hodkinson ID. Terrestrial insects along elevation gradients: species and community responses to altitude. Biology Review. 2005;80:489–513. doi: 10.1017/S1464793105006767. [DOI] [PubMed] [Google Scholar]
- Hope (1976).Hope GS. The vegetational history of Mt. Wilhelm, Papua New-Guinea. Journal of Ecology. 1976;64:627–661. doi: 10.2307/2258776. [DOI] [Google Scholar]
- Hunter & Yonzon (1992).Hunter ML, Yonzon P. Altitudinal distributions of birds, mammals, people, forests, and parks in Nepal. Conservation Biology. 1992;7:420–423. doi: 10.1046/j.1523-1739.1993.07020420.x. [DOI] [Google Scholar]
- Janzen et al. (1976).Janzen DH, Ataroff M, Farinas M, Reyes S, Rincon N, Soler A, Soriano P, Vera M. Changes in the arthropod community along an elevational transect in the Venezuelan Andes. Biotropica. 1976;8:193–203. doi: 10.2307/2989685. [DOI] [Google Scholar]
- Krebs (1989).Krebs CJ. Ecological methodology. New York: Harper & Row Publishers; 1989. [Google Scholar]
- Leather & Watt (2005).Leather SR, Watt AD. Sampling theory and practice. In: Leather SR, editor. Insect sampling in forest ecosystems. Oxford: Blackwell Publishing; 2005. 1–15, 320. [Google Scholar]
- McCain & Grytnes (2010).McCain CM, Grytnes JA. Encyclopedia of life sciences. Chichester: John Wiley & Sons, Ltd; 2010. Elevational gradients in species richness. [Google Scholar]
- McCoy (1990).McCoy ED. The distribution of insects along elevational gradients. Oikos. 1990;58:313–322. doi: 10.2307/3545222. [DOI] [Google Scholar]
- McKamey (1999).McKamey SH. Biodiversity of tropical Homoptera, with the first data from Africa. American Entomologist. 1999;45:213–222. doi: 10.1093/ae/45.4.213. [DOI] [Google Scholar]
- Mitter, Farrell & Wiegmann (1988).Mitter C, Farrell B, Wiegmann B. The phylogenetic study of adaptive zones: has phytophagy promoted insect diversification? American Naturalist. 1988;132(1):107–128. doi: 10.1086/284840. [DOI] [Google Scholar]
- Munzinger et al. (2013).Munzinger J, Damas K, Molino J-F, Pintaud JC, Molem K, Hungito H. Characteristics of vegetation plots along an altitudinal gradient on Mount Wilhelm, Papua New-Guinea. Ibisaca Nuigini Preliminary report. 2013 10 pp.
- New (1998).New TR. Invertebrate surveys for conservation. Oxford: Oxford University Press; 1998. [Google Scholar]
- Novotný (1992).Novotný V. Community structure of Auchenorrhyncha (Homoptera) in montane rain forest in Vietnam. Journal of Tropical Ecology. 1992;8:169–179. doi: 10.1017/S0266467400006301. [DOI] [Google Scholar]
- Novotný (1993).Novotný V. Spatial and temporal components of species diversity in Auchenorrhyncha (Insecta: Hemiptera) communities of Indochinese montane rain forest. Journal of Tropical Ecology. 1993;9:93–100. doi: 10.1017/S026646740000701X. [DOI] [Google Scholar]
- Novotný & Basset (1998).Novotný V, Basset Y. Seasonality of sap-sucking insects (Auchenorrhyncha, Hemiptera) feeding on Ficus (Moraceae) in a lowland rain forest in New Guinea. Oecologia. 1998;115:514–522. doi: 10.1007/s004420050549. [DOI] [PubMed] [Google Scholar]
- Novotny et al. (2005).Novotny V, Miller SE, Basset Y, Cizek L, Darrow K, Kaupa B, Kua J, Weiblen GD. An altitudinal comparison of caterpillar (Lepidoptera) assemblages on Ficus trees in Papua New Guinea. Journal of Biogeography. 2005;32:1303–1314. doi: 10.1111/j.1365-2699.2005.01225.x. [DOI] [Google Scholar]
- Oliver & Beattie (1993).Oliver I, Beattie AJ. A possible method for rapid assessment of biodiversity. Conservation Biology. 1993;7(3):562–568. doi: 10.1046/j.1523-1739.1993.07030562.x. [DOI] [Google Scholar]
- Ozanne (2005).Ozanne CMP. Sampling methods for forest understory vegetation. In: Leather SR, editor. Insect sampling in forest ecosystems. Oxford: Blackwell Publishing; 2005. 58–74, 320 pp. [Google Scholar]
- R Development Core Team (2013).R Development Core Team . R: a language and environment for statistical computing. Vienna: R Foundation for Statistical Computing; 2013. Available at http://www.r-project.org . [Google Scholar]
- Rahbek (2005).Rahbek C. The role of spatial scale and the perception of large-scale species-richness patterns. Ecology Letters. 2005;8:224–239. doi: 10.1111/j.1461-0248.2004.00701.x. [DOI] [Google Scholar]
- Régnière et al. (2012).Régnière J, Powell J, Bentz B, Nealis V. Effects of temperature on development, survival and reproduction of insects: experimental design, data analysis and modelling. Journal of Insect Physiology. 2012;58(5):634–647. doi: 10.1016/j.jinsphys.2012.01.010. [DOI] [PubMed] [Google Scholar]
- Roscoe (1975).Roscoe JT. Fundamental research statistics for the behavioral sciences. 2nd edition. New York: Holt, Rinehart and Winston, Inc; 1975. 483. [Google Scholar]
- Sam et al. (2014).Sam K, Koane B, Jeppy S, Munzinger J, Sam L, Novotny V. Explaining the species richness of birds along a complete rainforest elevational gradient in the tropics. 2014. Available at http://tvardikova.weebly.com/uploads/3/8/5/6/3856833/sam_grad_talkatbc2014.pdf .
- Sanders, Moss & Wagner (2003).Sanders NJ, Moss J, Wagner D. Patterns of ant species richness along elevational gradients in an arid ecosystem. Global Ecology and Biogeography. 2003;12:93–102. doi: 10.1046/j.1466-822X.2003.00324.x. [DOI] [Google Scholar]
- Savopoulou-Soultani et al. (2012).Savopoulou-Soultani M, Papadopoulos NT, Milonas P, Moyal P. Abiotic factors and insect abundance. Psyche. 2012;2012:1–2. doi: 10.1155/2012/167420. [DOI] [Google Scholar]
- Schuh & Slater (1995).Schuh RT, Slater JA. True bugs of the world (Hemiptera: Heteroptera): classification and natural history. Ithaca: Cornell University Press; 1995. 336. [Google Scholar]
- Smith (2013).Smith EP. Ecological statistics. In: El-Shaarawi AH, Piegorsch WW, editors. Encyclopedia of environmetrics. New York: John Wiley & Sons; 2013. pp. 589–602. [Google Scholar]
- Soulier-Perkins (2013).Soulier-Perkins A. Cool—cercopoidea organised on line. 2013. Available at http://hemiptera-databases.org/cool/ (accessed 4 December 2013)
- Spagnolo et al. (2014).Spagnolo S, Bryant C, Schulz K, Minchin P, Esselman E. Assessing quality of a regenerated prairie using floral and faunal indices. Phytoneuron. 2014;2014(73):1–15. [Google Scholar]
- Sundqvist, Sanders & Wardle (2013).Sundqvist MK, Sanders NJ, Wardle DA. Community and ecosystem responses to elevational gradients: processes, mechanisms, and insights for global change. Annual Review of Ecology, Evolution, and Systematics. 2013;44:261–280. doi: 10.1146/annurev-ecolsys-110512-135750. [DOI] [Google Scholar]
- Tonkyn & Whitcomb (1987).Tonkyn DW, Whitcomb RF. Feeding strategies and the guild concept among vascular feeding insects and microorganisms. In: Harris KF, editor. Current topics in vector research. New York: Springer-Verlag; 1987. pp. 179–200. [Google Scholar]
- Van Ingen, Campos & Andersen (2008).Van Ingen LT, Campos RI, Andersen AN. Ant community structure along an extended rain forest—savanna gradient in tropical Australia. Journal of Tropical Ecology. 2008;24:445–455. doi: 10.1017/S0266467408005166. [DOI] [Google Scholar]
- Vázquez & Givnish (1998).Vázquez GJA, Givnish TJ. Altitudinal gradients in tropical forest compostion, structure, and diversity in the Sierra de Manantlán. Journal of Ecology. 1998;86:999–1020. doi: 10.1046/j.1365-2745.1998.00325.x. [DOI] [Google Scholar]
- Wallner, Molano-Flores & Dietrich (2012).Wallner AM, Molano-Flores B, Dietrich CH. Using Auchenorrhyncha (Insecta: Hemipera) to develp a new index in measuring North American tallgrass prairie quality. Ecological Indicators. 2012;25:58–64. doi: 10.1016/j.ecolind.2012.09.001. [DOI] [Google Scholar]
- Whittaker (1952).Whittaker RH. A study of summer foliage insect communities in the Great Smoky Mountains. Ecological Monographs. 1952;22(1):1–44. doi: 10.2307/1948527. [DOI] [Google Scholar]
- Wiens et al. (2007).Wiens JJ, Parra-Olea G, Garcia-Paris M, Wake DB. Phylogenetic history underlies elevational biodiversity patterns in tropical salamanders. Proceedings of the Royal Society. 2007;274:919–928. doi: 10.1098/rspb.2006.0301. [DOI] [PMC free article] [PubMed] [Google Scholar]
- Wilson et al. (1994).Wilson SW, Denno RF, Mitter C, Wilson MR. Evolutionary patterns of host plant use by delphacid planthoppers and their relatives (Chapter 1) In: Denno RF, Perfect TJ, editors. Planthoppers: their ecology and management. New York: Chapman and Hall, Inc; 1994. pp. 7–113. [Google Scholar]
Associated Data
This section collects any data citations, data availability statements, or supplementary materials included in this article.