

Abstract
Current limitations in technology have prevented an extensive analysis of the connections among neurons, particularly within nonmammalian organisms. We developed a transsynaptic viral tracer originally for use in mice, and then tested its utility in a broader range of organisms. By engineering the vesicular stomatitis virus (VSV) to encode a fluorophore and either the rabies virus glycoprotein (RABV‐G) or its own glycoprotein (VSV‐G), we created viruses that can transsynaptically label neuronal circuits in either the retrograde or anterograde direction, respectively. The vectors were investigated for their utility as polysynaptic tracers of chicken and zebrafish visual pathways. They showed patterns of connectivity consistent with previously characterized visual system connections, and revealed several potentially novel connections. Further, these vectors were shown to infect neurons in several other vertebrates, including Old and New World monkeys, seahorses, axolotls, and Xenopus. They were also shown to infect two invertebrates, Drosophila melanogaster, and the box jellyfish, Tripedalia cystophora, a species previously intractable for gene transfer, although no clear evidence of transsynaptic spread was observed in these species. These vectors provide a starting point for transsynaptic tracing in most vertebrates, and are also excellent candidates for gene transfer in organisms that have been refractory to other methods. J. Comp. Neurol. 523:1639–1663, 2015. © 2015 Wiley Periodicals, Inc.
Keywords: VSV, transsynaptic, polysynaptic, anterograde, retrograde, visual pathways, centrifugal, retina, in vivo, RRID: AB_10053281, AB_591819, AB_531908, AB_10562207, SciRes_000161
ABBREVIATIONS
- A
Arcopallium
- AI
Arcopallium intermedium
- AVT
Area ventralis of Tsai
- Cb
Cerebellum
- CP
Caudate putamen
- DS
Dorsal striatum
- E
Entopallium
- FC
Central fissure
- FS
Sylvian fissure
- GCL
Ganglion cell layer
- GLd
Dorsal lateral geniculate nucleus
- GP
Globus pallidus
- GPe
External segment of the globus pallidus
- H
Hyperpallium
- HA
Hyperpallium apicale
- HAB
Habenula
- Hp
Hippocampus
- IMC
Nucleus isthmi pars magnocellularis
- INL
Inner nuclear layer (of retina)
- ION
Isthmo‐optic nucleus
- Ipc
Nucleus isthmi pars parvocellularis
- LHN
Lateral hypothalamic nucleus (visual suprachiasmatic nucleus)
- LSt
Lateral striatum
- M
Mesopallium
- Me
Medulla
- MLd
Mesencephalicus lateralis, pars dorsalis
- MRF
Mesencephalic reticular formation
- N
Nidopallium
- NB
Nucleus basalis
- NBM
Nucleus basalis of Meynert
- nBOR
Nucleus of the basal optic root
- NC
Nidopallium caudale
- OB
Olfactory bulb
- OM
Occipito‐mesencephalic tract
- ONL
Outer nuclear layer (of retina)
- OT
Optic tectum
- P
Pallium
- PO
Preoptic area
- PRF
Pontine reticular formation
- PT
Pretectum
- Rt
Nucleus rotundus
- SAC
Stratum album central (of optic tectum)
- SGC
Stratum griseum central (of optic tectum)
- SGFS
Stratum griseum et fibrosum superficiale (of optic tectum)
- SGP
Stratum griseum periventriculare (of optic tectum)
- SNr
Substantia nigra pars reticulata
- SO
Stratum opticum (of optic tectum)
- St
Striatum
- STN
Subthalamic nucleus
- STS
Superior temporal sulcus
- Th
Thalamus
- Tn
Nucleus teaniae
- tn
Terminal nerve
- V1
Primary visual cortex
- VL
Ventricular layer (of optic tectum)
The development of broadly applicable technologies that enable directional tracing of neural connectivity can provide significant advances in our understanding of the organization and function of neural networks across species. Classical methods have used the injection of nonreplicating tracers, such as dyes or beads, which can be taken up by neurons projecting to, or situated within, an injection site. These methods have provided a framework for the connections between areas in the nervous system, but have significant limitations (Vercelli et al., 2000). For example, tracers such as horseradish peroxidase or biotin‐dextran amine do not spread across synapses and do not enable the definition of microcircuitry. Other tracers that can spread across synapses, including those based on lectins and bacterial toxins, tend to dilute, hindering identification of weak connections. Viruses that can infect neurons and then transmit across synaptically connected cells have provided solutions to some of these problems (Ugolini et al., 1989; Astic et al., 1993; Wickersham et al., 2007). Viruses can be engineered to express transgenes, including fluorescent proteins, at a high level, and the signal does not diminish as a virus spreads among cells within circuits. Pioneering work using α‐herpesviruses, in particular pseudorabies virus (PRV), and a rhabdovirus, rabies (RABV), demonstrated the utility of these viruses as transsynaptic tracers (Enquist et al., 1998; Kelly and Strick, 2000). Direct injection of PRV and RABV into the central nervous system (CNS) or periphery has been shown to result in polysynaptic patterns of spread among cells within known circuits (Ugolini et al., 1989; Standish et al., 1994; Enquist et al., 1998; Kelly and Strick, 2000). Vesicular stomatitis virus (VSV), another rhabdovirus, also has been shown to transmit anterogradely among neurons (Lundh, 1990; Beier et al., 2011). When modified to use the RABV glycoprotein instead of its own glycoprotein, VSV behaves similarly to RABV in terms of a retrograde pattern of transmission in vivo (Beier et al., 2011, 2013a, 2013b). Moreover, complex patterns of connectivity generated with polysynaptic viral labeling can be clarified using monosynaptic tracing based on viruses that are limited to one transmission cycle, as has been developed for RABV and VSV (Wickersham et al., 2007; Beier et al., 2011).
Nearly all viral tracing experiments to date have been performed in mammals. The broader application of viral tracers may be limited by restricted host range. Because viruses have evolved to interact with the extracellular and cellular proteins of specific hosts, it is expected that many viruses will lack the ability to infect a wide range of species. While the host range of RABV has not been extensively explored, previous work has demonstrated that VSV has the ability to infect cells from vertebrate and invertebrate species in culture (Lichty et al., 2004; Knipe and Howley, 2007) and VSV infects many organisms in its natural environment, including insects and mammals (Johnson et al., 1966; Bussereau, 1971; Butler and Hodos, 2005; Schott et al., 2005). Our previous work in mice demonstrated that VSV vectors can travel transsynaptically among neurons, with anterograde or retrograde transmission controlled by the viral glycoprotein (Beier et al., 2011, 2013a, 2013b). However, we do not yet understand the mechanisms that lead to viral transmission patterns in vivo, particularly those that govern the directionality of transmission. In addition, the host range and utility of these vectors for circuitry tracing or gene transfer has not been examined in other organisms.
A variety of model organisms are studied for the unique experimental advantages that they offer for studies of a particular tissue or function. Beyond providing insight into biological diversity, cross‐species comparisons of neural connectivity in a wide range of organisms can give insights into the evolution of the nervous system. Presently, there are few broadly applicable techniques that allow the tracing of synaptic connections. Some of the most highly developed techniques are for use in mice, where genetic manipulations of the mouse genome, coupled with viral vectors that infect mammals, have allowed for sophisticated approaches to this problem (DeFalco et al., 2001; Wickersham et al., 2007; Beier et al., 2011; Lo and Anderson, 2011). Given the sensitivity of viral tracing as a tool for understanding the organization of neural circuitry, the development of a virus that can infect a wide range of organisms, and transmit transsynaptically, would address a gap in current technology. In addition, some organisms have not been successfully targeted by gene transfer using any method, and can benefit from virus‐mediated gene delivery tools. VSV was thus investigated for its ability to fill these gaps for many organisms. By using VSV's native glycoprotein (G) gene, VSV‐G, or the G gene of RABV, RABV‐G, we created recombinant viral vectors that travel among neurons specifically in the anterograde or retrograde directions, respectively. In diverse organisms such as mice, birds, and fish, these recombinant VSV vectors (rVSV) were able to transmit in a transsynaptic pattern in the direction dictated by the viral glycoprotein. We also show that rVSV can infect a wide range of vertebrate and invertebrate species, including nongenetic model organisms, such as seahorses, and the cubozoan jellyfish Tripedalia cystophora. This opens the door for future studies of gene function, and potentially synaptic connectivity, in organisms that have heretofore been difficult to access with genetic approaches.
MATERIALS AND METHODS
Virus construction and in vitro infections
Viruses were constructed and grown as previously described (Beier et al., 2011, 2013b). To determine infectivity in vitro, cells were split at confluence, 1:5, onto new chamber slides. The following day cells were infected in triplicate with 1 μL of 1 × 10⁵ focus forming units (ffu)/mL of rVSV(VSV‐G) expressing Venus, a YFP/GFP variant (Nagai et al., 2002), or rVSV(RABV‐G) expressing GFP. The following cell lines were used: human embryonic kidney (293T) cells (Graham et al., 1977), primate (Chlorocebus sabaeus) Vero cells (Yasumura and Kawakita, 1963), dog (Canis lupus) Madine–Darby canine kidney (MDCK) cells (Madin and Darby, 1958), mouse (Mus musculus) NIH 3T3 fibroblasts (Todaro and Green, 1963), baby hamster (Mesocricetus auratus) kidney (BSR) cells (Macpherson and Stoker, 1962), chicken (Gallus gallus) DF‐1 cells (Himly et al., 1998), axolotl (Ambystoma mexicanum) AL1 cells (Roy et al., 2000), and fruit fly (Drosophila melanogaster) S2R+ cells (Yanagawa et al., 1998). Due to lower infectivity, S2R+ cells were infected with 1 μL of 1 × 10⁷ ffu/mL of each virus. At 24 hours postinfection (hpi), cells were fixed with 4% formaldehyde and imaged using fluorescence microscopy.
Mouse
To test for anterograde and retrograde transsynaptic directional specificity, 100 nL of 3 × 10⁷ ffu/mL viruses were injected into either the dorsomedial striatum (caudate putamen, CP) (bregma, +1.0 mm, lateral 1.7 mm, ventral 2.5 mm) or primary motor cortex (bregma +1.34 mm, lateral 1.7 mm, ventral 1.0 mm) of 6‐week‐old CD1 mice. Both males and females were used for injections. Animals were sacrificed at 72 hpi, brains were fixed in 4% formaldehyde in phosphate‐buffered saline (PBS) overnight, and tissue processing and sectioning performed using standard procedures.
Chicken
Eggs from white leghorn chickens (Charles River, Wilmington, MA) were incubated at 38°C and embryos were lowered after 2 days incubation by removal of 3–4 mL albumin. For in ovo injections, embryonic day (E)14 embryos were injected with 0.5–1 μL of 1 × 10¹⁰ ffu/mL rVSV‐GFP(VSV‐G) or rVSV‐GFP(RABV‐G) virus unilaterally into the right optic tectum (OT), or into the vitreal cavity of the left eye using a Hamilton syringe (Reno, NV; #87931) with a 30G, 15 mm beveled tip (7803‐07). For eye injections, an equal titer of either rVSV‐GFP(VSV‐G) or rVSV‐Venus(VSV‐G) were used, as they show identical transmission patterns. Eggs were then sealed with tape and returned to the incubator where they were maintained from 24 to 72 hpi. Brains were dissected and retinae were isolated from the sclera and retinal pigmented epithelium prior to fixation in 4% formaldehyde. Tissues were washed in PBS, imaged in whole mount, and processed through a sucrose gradient prior to embedding in OCT and cryosectioning at 25 μm. 4,6‐diamidino‐2‐phenylindole, dihydrochloride (DAPI, 1:5,000, Molecular Probes, Eugene, OR) was used to detect nuclei. Images were captured and mosaics generated using a Keyence BZ‐9000 microscope or a Zeiss LSM 780 laser scanning confocal microscope. To define brain regions, the levels and contrast of the DAPI channel image were adjusted with Photoshop software (Adobe Systems, San Jose, CA; RRID:SciRes_000161) and traced areas were then overlaid onto a merged image.
Zebrafish
Prior to injection, larval zebrafish were anesthetized with 0.01% tricaine, and immobilized in 1.5% low melting‐point agarose. 1–2 nL of rVSV‐Venus(VSV‐G), 1 × 10⁶ or 1 × 10⁸ ffu/mL, rVSV‐GFP(RABV‐G), 1 × 10⁸ ffu/mL, or rVSVΔG‐GFP(RABV‐G), 1 × 10⁸, or 1 × 10⁹ ffu/mL was injected into the vitreal cavity of one eye. Infected animals were fixed at 24, 48, or 72 hpi and processed by whole‐mount immunohistochemistry. Samples were incubated with rabbit anti‐GFP to detect Venus or GFP (MBL International, Woburn, MA; 598, RRID:AB_591819), mouse anti‐HU (HuC/D) (Life Technologies, Bethesda, MD; RRID:AB_591819), and mouse anti‐HNK1 (Developmental Studies Hybridoma Bank, Iowa City, IA; RRID:AB_531908) followed by secondary antibodies conjugated with Alexa dyes (Life Technologies, 1:500). Stained samples were mounted in 1.5% low‐melting‐point agarose and imaged with confocal microscopy. 3D rendering of zebrafish larvae was generated with FluidVis (Fluidity Software, Somerville, MA), followed by manual annotation in ImageJ (NIH, Bethesda, MD; RRID:nif‐0000‐30467) and Photoshop.
Seahorse
Adult captive‐bred seahorses (Hippocampus erectus) were anesthetized with 0.01% tricaine methylsulfate (MS‐222). Eyes were injected with 1–2 μL of 2 × 10⁹ ffu/ml rVSV‐GFP(RABV‐G) or rVSV‐Venus(VSV‐G) into the vitreal cavity. Seahorses were euthanized after 72 hpi. Eyes and brain tissue were fixed in 4% formaldehyde for 2 hours at room temperature, washed in PBS, and passed through a sucrose gradient. Brains and retinas were cryosectioned at 30 μm. GFP or Venus was detected using the rabbit anti‐GFP primary antibody (Invitrogen, La Jolla, CA; A6455, RRID:AB_10053281) and a donkey antirabbit Cy3 secondary antibody. Images were captured using a Zeiss LSM 780 laser scanning confocal microscope.
Monkey
Two squirrel monkeys (Saimiri sciureus), and one rhesus macaque (Macaca mulatta) were initially anesthetized with ketamine (10 mg/kg) and xylazine (1 mg/kg) and intubated thereafter. Anesthesia was maintained with isoflurane (1–2% in oxygen). Using aseptic technique, a circular craniotomy and then durotomy was made over the occipital lobe or over the central fissure. Viral injections into the cortex were made using a micropipette with a tip diameter of 10–15 μm inserted to a depth of 1 mm. In squirrel monkeys, injections were made into primary visual cortex (rVSV‐GFP(RABV‐G), 8 × 10⁸ ffu/mL), somatosensory cortex (rVSV‐mCherry(RABV‐G), 1 × 10⁹ ffu/mL), and motor cortex (rVSV‐Venus(VSV‐G), 1 × 10⁹ ffu/mL). In the macaque monkey, injections were made into medial V1 (rVSV‐mCherry(RABV‐G), 1 × 10⁹ ffu/mL) and lateral V1 (rVSV‐Venus(VSV‐G), 1 × 10⁹ ffu/mL). Each cortical area received three pressure injections of a different tracer ∼1 mm apart, for a total volume of 2 μL for squirrel monkeys, and 4 μL for the macaque. Injections were controlled by a Picospritzer III (Parker Automation, Cleveland, OH) using multiple pulses at 20 p.s.i. of 5 ms duration. After the injections, the dura was reapproximated, the bone flap was secured with dental acrylic, and the skin was sutured. Monkeys were returned to their home cages after recovery. After a survival period of 3 days for both squirrel monkeys and 4 days for the macaque, each animal was sacrificed with an overdose of Euthazol (>100 mg/kg) and perfused through the heart with normal saline followed by 4% formaldehyde in 0.1 M phosphate buffer, pH 7.4. The brain was removed from the skull for postfixation overnight at 4°C. After cryoprotection for 4–5 days in 30% sucrose solution, the tissue was cut in 50‐μm coronal sections using a freezing microtome. Labeled neurons were observed using a fluorescent microscope (Zeiss Axioscop). A digital camera (Optronic Engineering, Goleta, CA) or FV1000 Laser Scanning Confocal Microscope was used to record data to image files.
Jellyfish
Cultured Tripedalia cystophora were obtained from tanks at the Vision Group, Lund University, Sweden, and transferred to Harvard Medical School, Boston, where they were maintained in 25 ppt salinity seawater at 28°C. The vitreous space between the lens and the photoreceptors of the lower lens eye was injected with 1 × 10¹⁰ ffu/mL rVSV‐Venus(VSV‐G). Two lower lens eyes were injected in 10 animals, for a total of 20 injected eyes, and the other two noninjected eyes in each animal served as controls. The animals were then transferred to individual 50‐mL Falcon tubes and maintained in 25 ppt saline at 28°C until harvest, at which time they were fixed in 4% formaldehyde, and the rhopalia whole‐mounted on microscope slides for imaging.
Drosophila
Adult Drosophila melanogaster were injected with ∼0.5 nL of 2 × 10¹⁰ ffu/ml rVSV‐Venus(VSV‐G) or rVSV‐GFP(RABV‐G) into the abdomen. Images of fluorescent protein expression were captured after 24 hpi using a Leica MZ FLIII stereo microscope and Nikon DXM1200F digital camera.
Antibody characterization
Please see Table 1 for a list of all primary antibodies used.
Table 1.
Primary Antibodies Used
| Antibody | Immunogen | Source, Catalog #, RRID | Species | Concentration |
|---|---|---|---|---|
| Anti‐GFP | GFP isolated from A. victoria | Life Technologies (#A6455), RRID:AB_10053281 | Rabbit polyclonal | 1:500 dilution |
| Anti‐GFP | Recombinant GFP | MBL international (#598), RRID:AB_591819 | Rabbit polyclonal | 1:1,000 dilution |
| Anti‐HNK‐1 | Membrane fraction of adult zebrafish CNS. | Developmental Studies Hybridoma Bank (zn‐12), RRID:AB_531908 | Mouse monoclonal | 1:200 dilution |
| Anti‐HuC/HuD | Human HuC/HuD neuronal protein | Life Technologies (#A21271), RRID:AB_10562207 | Mouse monoclonal | 1 μg/mL |
The GFP antibodies (Life Technologies, #A6455) and (MBL International, #598) react with GFP and its variants on western blotting, immunoprecipitation, and immunohistochemistry (manufacturer's datasheets), and stained tissues infected with rVSV expressing GFP or Venus. No staining was seen in uninfected tissues. Anti‐HuC/D and anti‐HNK1(zn‐12) stained a pattern of cellular morphology and distribution in the zebrafish brain that is consistent with previous reports (Metcalfe et al., 1990; Pan et al., 2012). Secondary antibodies used include Alexa 568 antimouse IgG2b (Life Technologies, #A21144, 1:500), Alexa 647 antimouse IgG1 (Life Technologies, #A21240, 1:500), Alexa 488 antirabbit (Life Technologies, #A21206, 1:500), and Cy3 donkey antirabbit (Jackson ImmunoResearch, West Grove, PA; #711‐165‐152, 1:500).
All procedures were approved by the Harvard Medical Area Standing Committee on Animals and the Georgia Regents University Institutional Animal Care and Use Committee, and conformed to guidelines established by the National Institutes of Health for the care and use of laboratory animals.
RESULTS
Anterograde and retrograde transsynaptic tracing in vivo in mice
In our previous studies in mice, we showed that rVSV(VSV‐G) travels anterogradely while rVSV(RABV‐G) travels retrogradely among neurons, in patterns consistent with transsynaptic transmission (Beier et al., 2011). Infections of the mouse visual system, basal ganglia, and olfactory system were performed in these previous studies (Beier et al., 2011, 2013a, 2013b). Here, in order to further validate directional specificity of these viruses in mice, we confirmed unidirectional transmission of rVSV(VSV‐G) encoding Venus and rVSV(RABV‐G) encoding GFP within the motor cortex to dorsal striatum (caudate putamen, CP) circuit (Albin et al., 1995; Beier et al., 2013b). Consistent with lack of retrograde transsynaptic spread, injection of rVSV(VSV‐G) into the dorsal striatum resulted in no cortical labeling in 4/4 animals, despite heavy labeling at the injection site (Fig. 1A,B). In contrast, viral labeling of neurons in brain regions downstream of the dorsal striatum, such as the external segment of the globus pallidus (GPe) and subthalamic nucleus (STN), was observed by 72 hpi, consistent with anterograde transsynaptic transmission (Fig. 1C,D). When the primary motor cortex was injected with rVSV(VSV‐G), in 4/4 animals fluorescently labeled cell bodies in the dorsal striatum were observed, as well as the same downstream nuclei from the direct dorsal striatal injection (GPe, STN), again consistent with anterograde transsynaptic transmission (Fig. 1E–H). Notably, in injections into the primary motor cortex, no somatic labeling was observed in the nucleus basalis (Fig. 1F), consistent with a lack of retrograde transsynaptic transmission by rVSV(VSV‐G). Neurons in this area project strongly and diffusely to the cortex and labeling of this area would be expected only via retrograde transsynaptic transmission from cortical cells (e.g., see next section).
Figure 1.
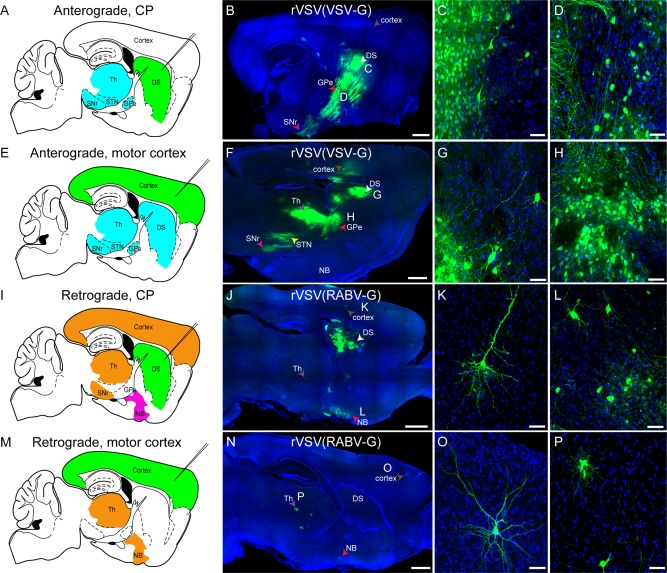
rVSV(VSV‐G) transmission shows an anterograde, and rVSV(RABV‐G) shows a retrograde, polysynaptic pattern of transmission among neurons in mice. (A–H) rVSV(VSV‐G) was injected into the dorsal striatum (DS) (A–D) or primary motor cortex (E–H), and animals were sacrificed 3 dpi. (A) Schematic of regions expected to be labeled by anterograde transsynaptic transmission (blue) of a virus from a DS injection (injection needle, green). (B–D) At 3 dpi, DS injections of rVSV(VSV‐G) resulted in patterns of infection consistent with anterograde transsynaptic transmission. Infected cells were observed near the injection site in the DS (white arrowhead), as well as in the GPe (red arrowhead), SNr (pink arrowhead), and the thalamus. The cortex, which projects to the DS, was not labeled (brown arrowhead). Higher‐magnification images of neurons in the DS (C) and GPe (D) are shown. (E) Schematic of regions expected to be labeled by anterograde transsynaptic transmission (blue) of a virus from a primary motor cortex injection (injection needle, green). (F–H) Injection of rVSV(VSV‐G) into the primary motor cortex labeled cells locally in the cortex (brown arrowhead), and the same regions as a direct DS injection, including the DS (white arrowhead), GPe (red arrowhead), STN (yellow arrowhead), SNr (pink arrowhead), and thalamus (purple arrowhead). High‐magnification images of DS neurons (G), and neurons in the GPe (H) are provided. (I) Schematic of regions expected to be labeled by initial infection by retrograde uptake, and/or by retrograde transsynaptic transmission (orange), with the nucleus basalis (NB) predicted to be labeled only by retrograde transmission (magenta) of rVSV(RABV‐G) from a DS injection (injection needle, green). (J–L) rVSV(RABV‐G) was injected into the DS. At 3 dpi, this injection resulted in infected cells in retrograde targets, including local infection in the DS (white arrowhead), cortex (brown arrowhead), NB (red arrowhead), and the thalamus (purple arrowhead). High magnifications of a cortical neuron (K), and NB neurons (L) are shown. (M) Schematic of regions expected to be labeled by initial infection by retrograde uptake, and/or by transsynaptic transmission (orange) of a retrograde virus from a primary motor cortex injection (injection needle, green). (N–P) Injections of rVSV(RABV‐G) into the primary motor cortex labeled neurons at the injection site in the cortex (brown arrowhead), as well as the NB (red arrowhead) and thalamus (purple arrowhead), but not the DS. Higher magnification of a cortical neuron (O) and thalamic neurons (P) are shown. Multiple types of neurons, including glutamatergic (e.g., cortical pyramidal neurons, panels K,O), GABAergic (DS medium spiny neurons, panels C,G), and cholinergic (NB neurons, panel L), were labeled. DS = dorsal striatum, Th = thalamus, STN = subthalamic nucleus, GPe = globus pallidus external segment, SNr = substantia nigra pars reticulata, NB = nucleus basalis. Scale bars = 1 mm in B,F,J,N; 50 μm in C,D,G,H,K,L,O,P.
When rVSV(RABV‐G) was injected into the dorsal striatum, viral labeling of cortical pyramidal neurons in layers 3 and 5 was observed in 6/6 animals, consistent with retrograde virus uptake (Fig. 1I–L). At or after 48 hpi, but not at 24 hpi, labeled cells also were seen in secondary areas, such as the nucleus basalis, which projects to the cortex, but not to the dorsal striatum (Wenk et al., 1980; Rye et al., 1984; Baskerville et al., 1993). When injected into the primary motor cortex, in 4/5 animals, rVSV(RABV‐G) did not label the dorsal striatum, but instead labeled areas known to project to the primary motor cortex, including the nucleus basalis, thalamus, and GPe (Fig. 1M–P and data not shown). These data support the interpretation that rVSV(RABV‐G) transmission is retrograde among connected neurons, but cannot move in the anterograde direction. In contrast, rVSV(VSV‐G) moves anterogradely among connected neurons, but is not transported well retrogradely from the initial injection site, nor does it replicate and then transmit in the retrograde direction. This is consistent with our previous results in the mouse showing unidirectional viral spread, with the direction being dependent on the identity of the glycoprotein in the viral envelope (Beier et al., 2011, 2013b).
Infectivity in a wide range of cell lines
Given the apparent transsynaptic spread and directional specificity of rVSV in mice, we wanted to explore if these vectors displayed the same properties in other organisms. VSV‐G, the natural glycoprotein of VSV, is known to permit virus entry into a broad host range (Knipe and Howley, 2007). In addition, VSV is able to express its genes in a wide range of host species, and, in many cases, produce infectious virions from these hosts. However, the infectivity in various species with VSV vectors encoding the RABV glycoprotein (rVSV(RABV‐G)), and, to some extent, the VSV glycoprotein (rVSV(VSV‐G)), has not been extensively tested. Therefore, these viral vectors were tested for their infectivity in a variety of organisms, to determine if the broad host range of VSV was maintained.
Human embryonic kidney (293T) cells, African green monkey (Chlorocebus sabaeus) kidney Vero cells, Madin–Darby canine (Canis lupus familiaris) kidney (MDCK) cells, mouse (Mus musculus) NIH 3T3 fibroblasts, Syrian golden hamster (Mesocricetus auratus) kidney (BSR) cells, chicken (Gallus gallus) DF‐1 cells, axolotl (Ambystoma mexicanum) AL1 cells, and fruit fly (Drosophila melanogaster) S2R cells were infected with an equal number of infectious particles of either rVSV(VSV‐G), which expressed the fluorescent protein Venus, or rVSV(RABV‐G), which expressed GFP. All of these cell lines were infectable with both of these viruses, as indicated by bright fluorescence by 24 hpi (Fig. 2). With the exception of Drosophila S2R cells, which showed about a 100‐fold lower number of fluorescent cells relative to the others, there was not a noticeable difference in infection efficiency among these cell types. Expression of viral fluorescent protein was very rapid in all cell types, and cytopathic effects were observed in infected cells (Ye et al., 1994; Lyles, 2000; van den Pol et al., 2002; Knipe and Howley, 2007) with the exception of S2R cells, which have been reported to limit VSV replication by inducing autophagy (Shelly et al., 2009).
Figure 2.
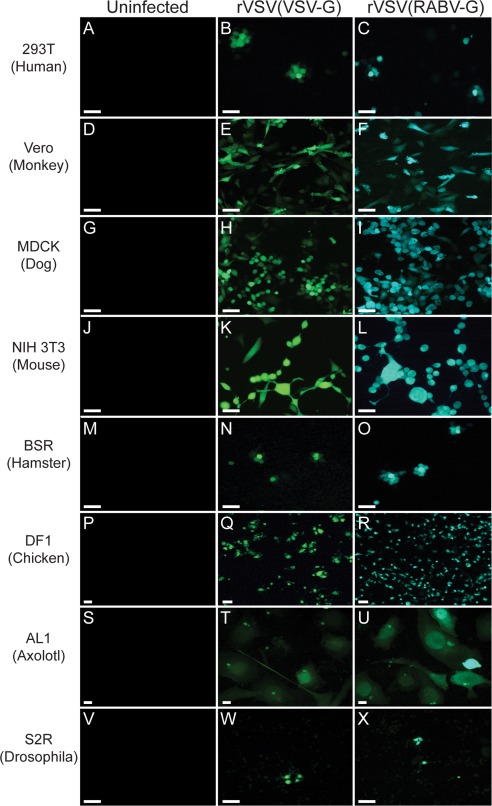
A variety of cell lines from different organisms were infectable with VSV vectors. Cells were infected with either rVSV(VSV‐G) or rVSV(RABV‐G) and assayed for Venus or GFP fluorescence at 1 dpi. Chamber slides of (A–C) human 293T cells, (D–F) Vero monkey cells, (G–I) dog MDCK cells, (J–L) mouse NIH 3T3 cells, (M–O) hamster BSR cells, (P–R) chick DF1 cells, (S–U) salamander AL1 cells, or (V–X) Drosophila S2R cells were infected with 1 μL of 1 × 10⁵ ffu/mL of either rVSV(VSV‐G) (B,E,H,K,N,Q,T,W), or rVSV(RABV‐G) (C,F,I,L,O,R,U,X). The virus used to infect is indicated above the panels. Negative controls (A,D,G,J,M,P,S,V) were not exposed to virus. Scale bars = 50 μm.
Infection with rVSV(VSV‐G) in the eye generates an anterograde transsynaptic pattern within visual circuits in chicken embryos
Based on the transsynaptic labeling observed with rVSV in mouse, we wanted to determine if rVSV(VSV‐G) or rVSV(RABV‐G) could be used for transsynaptic neural tracing in different vertebrate model systems in vivo. To assess the in ovo viral spread of rVSV(VSV‐G) in chicken, we injected rVSV‐GFP(VSV‐G) unilaterally into the eye (n = 3), and examined spread of the virus through the CNS as indicated by GFP expression. Injection of rVSV(VSV‐G) into the left eye resulted in robust labeling of the retina, first examined at 24 hpi (Fig. 3A,B). After 48 hpi, columns of cells, only found in close proximity to the injection site, showed a distinct pattern of transgene expression within the outer (photoreceptor) and inner (amacrine and bipolar cell) nuclear layers. Retinal ganglion cells (RGCs) on the vitreal side of these labeled columns did not show GFP expression at 48 hpi (Fig. 3C), suggesting local infection of photoreceptors in the subretinal space close to the dorsal/anterior injection site, with subsequent anterograde spread of rVSV(VSV‐G). (Longer postinfection intervals may have resulted in labeling of RGCs in these areas.) Throughout the posterior retina, i.e., not restricted to the injection site, the most prominently infected retinal cell type was the RGC (Fig. 3D), likely due to the intended delivery site of the inoculum into the vitreous body.
Figure 3.
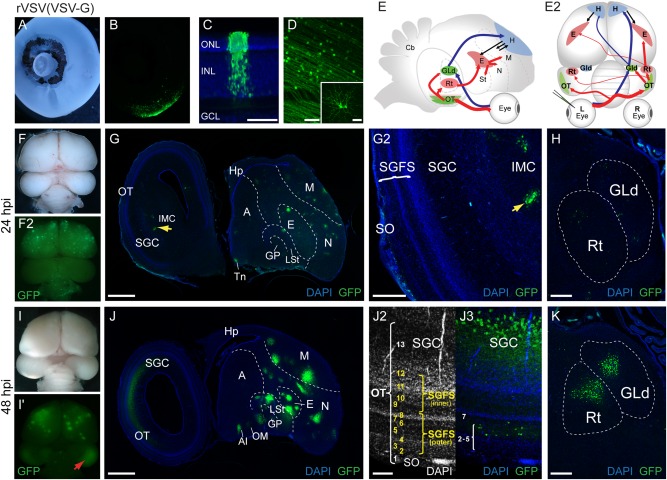
In ovo rVSV(VSV‐G) infection of the chicken eye shows an anterograde transsynaptic pattern of spread. (A–D) Injection of rVSV(VSV‐G) into the left eye of E14 chicken embryos resulted in viral gene expression in the retina (A,B). Transverse section through an infected retina at 48 hpi showing a column of labeled photoreceptor cells and associated GFP‐positive cells. Labeled cells were found in the outer nuclear layer (ONL) and inner nuclear layer (INL), but were absent from RGCs within these columns (C). This columnar transmission pattern was only detected near the injection site. In the posterior area of the retina in C, whole‐mount confocal images show a large number of labeled RGCs with axons directed towards the optic fissure (D). Inset in D shows high magnification of a labeled RGC. (E–E2) Schematic of expected anterograde transsynaptic transmission of rVSV(VSV‐G) through the tectofugal (E,E2, red arrows) and thalamofugal (E,E2, blue arrows) visual pathways illustrated in parasagittal (E) and dorsal (E2) views. (F–K) The pattern of virus infection in whole brains at 24 hpi (F–F2) and 48 hpi (I–I2) after unilateral injection of rVSV(VSV‐G) into the left eye. Red arrow (I2) indicates fluorescent protein expression in the OT. Sagittal sections at 24 hpi show the pattern of rVSV(VSV‐G) transmission within the brain (G). Labeled RGC axons were present in the stratum opticum (SO) of the optic tectum (OT), and sparse labeled cell bodies were detected in the SGFS, IMC (G,G2) and the Rt (H). A few labeled cells were also detected within the GLd (H). At 48 hpi, fluorescent protein expression was greatly increased within primary, secondary, and higher order sites of the visual pathways (J). Higher‐magnification confocal image of the OT with DAPI staining to highlight tectal layers (J2) and detection of viral infection (J3) shows rVSV(VSV‐G) transmission to retinorecipient layers of the SGFS and the SGC output layer of the OT (J3). As compared to expression at 24 hpi (H), fluorescent protein expression was greatly increased within the GLd and the Rt at 48 hpi (K). A = arcopallium, AI = Arcopallium intermedium, E = entopallium, GCL = ganglion cell layer, GLd = dorsal lateral geniculate nucleus, GP = globus pallidus, H = hyperpallium, Hp = hippocampus, IMC = nucleus isthmi pars magnocellularis, INL = inner nuclear layer (of retina), LSt = lateral striatum, M = mesopallium, N = nidopallium, OT = optic tectum, ONL = outer nuclear layer (of retina), Rt = nucleus rotundus, SGC = stratum griseum central (of OT), SGFS = stratum griseum et fibrosum superficiale (of OT), St = striatum, SAC = stratum album central (of OT), SGP = stratum griseum periventriculare (of OT), SO = stratum opticum (of OT), Tn = nucleus teaniae, VL = ventricular layer (of OT). Scale bars = 50 μm in C,D; 1 mm in G,J; 300 μm in G2,H,K; and 100 μm in J2,J3.
To characterize the transsynaptic tracing capability of rVSV(VSV‐G) in chicken, we turned to the well‐characterized tectofugal (Fig. 3E, red arrows) and thalamofugal (Fig. 3E, blue arrows) visual pathways, and examined transmission to primary retinorecipient regions of the brain, and to areas predicted to be infected by secondary spread, after retinal infection. The essential regions and projections within these circuits are illustrated in parasagittal (Fig. 3E) and dorsal views (Fig. 3E2) and are briefly summarized below. The majority of axons from RGCs terminate within the contralateral (and to a lesser extent, ipsilateral) optic tectum (OT) (superior colliculus in mammals). In the OT, RGC axons terminate in layers 2‐5 and 7 of the stratum griseum et fibrosum superficiale (SGFS), where retinorecipient cells within these laminae and in the stratum griseum central (SGC) are modulated by the isthmic complex (Luksch et al., 1998; Wang et al., 2004). Signals are then relayed by tectal “ganglion cells” in the SGC to the nucleus rotundus (Rt) and to higher tectofugal areas, including the entopallium and mesopallium (De Long and Coulombre, 1965; Thanos and Bonhoeffer, 1987; Mey and Thanos, 1993; Wu et al., 2000; Wang et al., 2004). In the parallel thalamofugal pathway, a more limited subset of RGC projections provide visual signals to the nucleus geniculatus lateralis pars dorsalis (GLd) (functionally equivalent to the LGN in mammals) that are processed and relayed to higher areas, including the hyperpallium (visual wulst) in the forebrain (Güntürkün et al., 1993). Other areas that receive direct input from RGCs include the nucleus of the basal optic root (nBOR) which transmits signals to the cerebellum as part of the accessory optic system, and retinorecipient targets in the circadian visual system, including the lateral hypothalamic nucleus (LHN) (also referred to as the visual suprachiasmatic nucleus [vSCN]) (Hunt and Kunzle, 1976; Brandstatter and Abraham, 2003).
Consistent with robust anterograde transsynaptic transmission, we detected GFP‐expressing cells within the OT and multiple areas of visual pathways in 3/3 embryos at both 24 and 48 hpi after injection of rVSV(VSV‐G) encoding GFP into the eye (Fig. 3F–K). At 24 hpi, GFP‐labeled RGC axons were present in the SO and a few faintly labeled neurons were detected in the retinorecipient layers of the SGFS (Fig. 3G–G2) and the Rt (Fig. 3H), indicative of labeling in both primary, and to a lesser extent, secondary locations in the tectofugal circuit. Sparsely labeled cells were also detected within the GLd (Fig. 3H) suggesting rVSV(VSV‐G) transmission through the thalamofugal pathway. At 48 hpi, GFP‐expressing cells were greatly increased within primary, secondary, and higher order sites of the visual pathways, including strong contralateral infection in the SGC output layer of the OT (Fig. 3J–J3). GFP‐positive cells were also present in the ipsilateral SGC, but in reduced numbers relative to the contralateral side (data not shown). These observations indicate that after 48 hpi, the virus spread significantly beyond the retinorecipient regions and secondary regions. Labeled sites include major retinorecipient areas (SGFS, GLd), secondary regions (SGC, hyperpallium), and even higher areas in both circuits including the Rt, entopallium, mesopallium, and lateral striatum (Fig. 3J–K). In contrast to strong anterograde transsynaptic labeling with rVSV(VSV‐G), centrifugal neurons that project from the isthmo‐optic nucleus (ION) in the brain to the retina were not labeled (data not shown), indicating a lack of retrograde infection.
Infection with rVSV(RABV‐G) in the eye generates a retrograde transsynaptic pattern within visual circuits in chicken embryos
In addition to projections from RGCs to the brain, the visual system in chick and other ground‐feeding birds also includes significant efferent projections from the brain to the retina. This centrifugal visual system (illustrated in Fig. 4A, green arrows) originates from the contralateral ION. Axons from the ION project to target amacrine cells in the retina and transiently to the OT prior to hatching (Cowan and Clarke, 1976; Wizenmann and Thanos, 1990; Lindstrom et al., 2009). Visual input to the centrifugal pathway includes projections to the ION from the OT (from laminae 9 and 10) and modulatory inputs to these tectal neurons from the hyperpallium (Uchiyama et al., 1987; Wizenmann and Thanos, 1990). In contrast to well‐characterized tectal‐ION circuits, previous studies have generated conflicting data concerning extra‐tectal afferents to the ION, possibly due to technical difficulties with injection of traditional tracers into the ION (Reperant et al., 2006; Reperant et al., 2007). Several brain regions have been reported to project afferents to the ION, including the zona peri‐nIII (ZpnIII), the area ventralis of Tsai (AVT), the mesencephalic reticular formation (MRF), and pontine reticular formation (PRF) (Reperant et al., 2006), but no transsynaptic viral tracing has been employed to map centrifugal circuits. Injection of a polysynaptic retrograde virus tracer into the eye circumvents the difficulties of injecting conventional tracers into small target zones in ovo. To examine the retrograde tracing capability of rVSV(RABV‐G) in the centrifugal pathway, we injected rVSV(RABV‐G) encoding GFP into the left eye of E14 chicken embryos, and examined embryos for viral transmission into the brain (n = 7) (Fig. 4B–K). GFP expression was not detected in brains when chicken embryos were examined at 24 or 48 hpi (n = 4) (Fig. 4B). However, after 48 hpi GFP expression was detected in the retina in a few RGCs and amacrine cells (data not shown), in agreement with previously reported timing of infection and transmission with rVSV(RABV‐G) in mice (Beier et al., 2011, 2013b). Strikingly, after 72 hpi, strong, widespread GFP expression was observed in the brain from all three embryos examined at this timepoint, including in distinct regions of the forebrain, right medial midbrain, and cerebellum (Fig. 4C).
Figure 4.
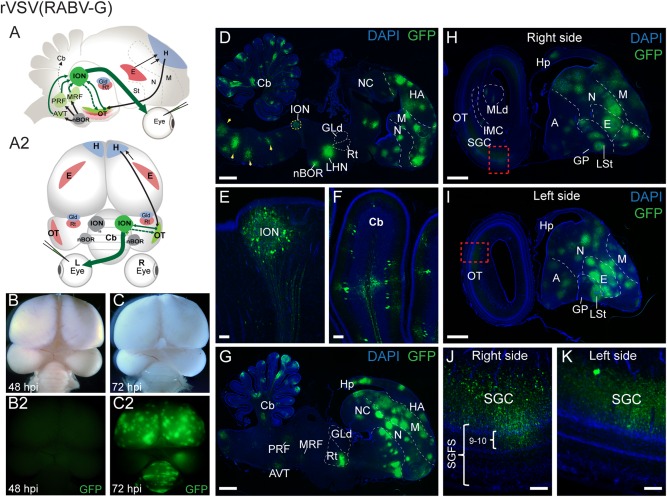
In ovo rVSV(RABV‐G) infection of the chicken eye shows a retrograde pattern of spread into the centrifugal visual system. (A–A2) Illustrations of the centrifugal visual system (green arrows) shown in parasagittal (A) and dorsal (A2) views. Centrifugal neurons in the isthmo‐optic nucleus (ION) target amacrine cells in the retina (A–A2, large green arrow) and have collateral axons that transiently project to the OT during development (dashed arrow). Brain regions that provide visual input to the ION include afferents from the OT, mesencephalic reticular formation (MRF), pontine reticular formation (PRF), and the area ventralis of Tsai (AVT).(B–K) GFP expression reveals a retrograde pattern of rVSV(RABV‐G) transsynaptic transmission within the brain following infection of the left retina at E14. GFP expression was not detected in the brain at 24 hpi or 48 hpi (B–B2). However, at 72 hpi widespread GFP expression was observed in the forebrain, right medial midbrain and cerebellum (C–C2). Sagittal sections through the right medial brain show rVSV(RABV‐G) transmission in regions associated with the centrifugal visual pathway and accessory optic system including the ION (D,E), nBOR (D), brainstem (D, yellow arrowheads) and cerebellum (D,F). GFP‐expressing cells also were detected in several putative retrograde targets that project to the ION (and also receive inputs from nBOR) including the MRF, PRF, and AVT (G). Distal sections through the right (H,J) and left (I,K) brain show GFP expression in the contralateral OT, including in the SGC layer and layers 9–10 of the SGFS (J,K). A = arcopallium, AVT = area ventralis of Tsai, Cb = cerebellum, E = entopallium, GLd = dorsal lateral geniculate nucleus, GP = globus pallidus, H = hyperpallium, HA = hyperpallium apicale, Hp = hippocampus, IMC = nucleus isthmi pars magnocellularis, ION = isthmo‐optic nucleus, LHN = lateral hypothalamic nucleus (visual suprachiasmatic nucleus), LSt = lateral striatum, M = mesopallium, MLd = mesencephalicus lateralis pars dorsalis, MRF = mesencephalic reticular formation, nBOR = nucleus of the basal optic root, N = nidopallium, NC = nidopallium caudale, OT = optic tectum, PRF = pontine reticular formation, Rt = nucleus rotundus, SGC = stratum griseum central (of OT), SGFS = stratum griseum et fibrosum superficiale (of OT), St = striatum. Scale bars = 1 mm in D,G,H,I; 100 µm in E,F,J,K.
To more precisely identify the locations of rVSV(RABV‐G) transmission we examined serial sagittal sections of the brain at 72 hpi. Consistent with retrograde‐based infection and transmission, GFP‐labeled cells were found in the contralateral ION (Fig. 4D,E), the OT (layers 9–10 of the SGFS and the SGC) (Fig. 4I–K), and the hyperpallium (Fig. 4D,H). These findings are consistent with polysynaptic retrograde transmission of rVSV(RABV‐G) in the centrifugal pathway. Interestingly, we also detected spread of rVSV(RABV‐G) to nuclei associated with other visual systems, including the accessory optic system (nBOR, cerebellum, and brainstem) (Fig. 4D,F) and the circadian visual system (LHN/vSCN) (Fig. 4D). Because projections from the nBOR include several areas thought to provide afferents to the ION (Brecha et al., 1980; Wylie et al., 1997), we examined GFP expression in medial sections and detected rVSV(RABV‐G) transmission to cells in the PRF, MRF, and AVT (Fig 4G). These results suggest amplified retrograde spread from the ION to oculomotor regions (PRF, MRF, AVT) followed by transmission to the nBOR. In addition to expected retrograde targets uniquely labeled by rVSV(RABV‐G), but not rVSV(VSV‐G), we also observed GFP expression in tectofugal circuits including in the Rt (Fig 4G), entopallium, mesopallium, and lateral striatum (Fig. 4D–J).
Infection of the chicken optic tectum with rVSV(RABV‐G), but not rVSV(VSV‐G), results in retrograde viral transmission to the retina
To further compare patterns of polysynaptic transmission, rVSV(VSV‐G) (n = 7) or rVSV(RABV‐G) (n = 3) was injected into the right OT of E14 chicks, and each animal was examined for evidence of infection in the eye. After 48 hpi, GFP expression from rVSV(VSV‐G) was readily detected in the injected and contralateral tectum and the forebrain (Fig. 5A). Sagittal sections revealed that rVSV(VSV‐G) spread from the tectum through tectofugal and thalamofugal pathways including in the Rt and GLd (Fig. 5B). Despite strong anterograde labeling throughout the visual circuits in the brain, GFP was not detected in the retina at 48 or 72 hpi (n = 7) (Fig. 5C,D). In two out of seven embryos injected with rVSV(VSV‐G), GFP expression was detected in the ciliary body surrounding the lens (Fig. 5D), consistent with anterograde transmission from the oculomotor complex and pupillary innervation. In contrast to the lack of retrograde spread observed with rVSV(VSV‐G), injection of rVSV(RABV‐G) into the OT resulted in widespread retrograde viral transmission and GFP expression in clusters of cells throughout the retina (n = 3) (Fig. 5G). When examined at 72 hpi, GFP expression in the brain was detected in the contralateral tectum, ION, Rt, nBOR, cerebellum, and forebrain (Fig. 5F); locations that were also labeled following injections of rVSV(RABV‐G) into the eye (See Fig. 4D–G). In the retina, RGCs were GFP‐positive (Fig. 5H,I, red arrows) presumably by retrograde uptake of the virus within the inoculum. Consistent with replication and retrograde transmission within the retina, other retinal cell types were labeled in the vicinity of the GFP‐positive RGCs, including bipolar cells (not shown) and amacrine interneurons (Fig. 5H,I, yellow arrows), as well as Müller glia (Fig. 5I, purple arrow), similar to previous viral labeling with rVSV(RABV‐G) and PRV in mice (Viney et al., 2007; Beier et al., 2011).
Figure 5.
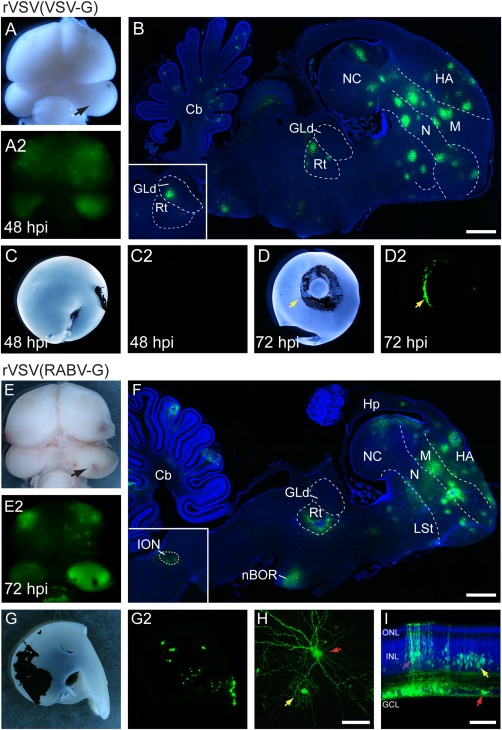
Infection with rVSV(RABV‐G), but not rVSV(VSV‐G), in the chicken optic tectum results in retrograde transmission from the brain to the retina. (A–D2) Injection of rVSV(VSV‐G) into the right optic tectum (OT) (arrow) resulted in an anterograde transsynaptic pattern of spread in the brain. Whole‐mount dorsal views of brightfield (A) and GFP expression (A2) in the brain at 48 hpi. Sagittal section showing GFP‐positive cells (B) in the Rt, GLd (inset from a semi‐adjacent section), and telencephalon (nidopallium, mesopallium, and hyperpallium) consistent with anterograde labeling from the OT with rVSV(VSV‐G). Brightfield (C,D) and fluorescent protein expression (C2,D2) in posterior (C) and anterior (D) views of retinae after rVSV(VSV‐G) infection of the OT. GFP expression was not detected in the retina at 48 or 72 hpi (n = 7) (C‐D2). In 2/7 embryos, GFP‐positive cells were detected in the ciliary body surrounding the lens (D,D2, yellow arrow) but were absent from the retina. (E–I) Injection of rVSV(RABV‐G) into the OT resulted in retrograde transmission and GFP expression in the retina. Dorsal views of brightfield and fluorescent (GFP) images (E–E2) of the brain at 72 hpi. Sagittal section showing GFP expression in the brain (F) including in the ION (inset), nBOR, cerebellum, Rt, and telencephalon. At 72 hpi, OT injections with rVSV(RABV‐G) resulted in in clusters of GFP‐positive cells throughout the retina (n = 3) (G–G2). Confocal z‐stack projection showing GFP expression in a RGC (H, red arrow) and an adjacent amacrine cell (H, yellow arrow) in a flat‐mount preparation of the left retina. Transverse section through a retina shows GFP expression in several retinal cell types including RGCs (I, red arrow), Müller glia (I, purple arrow), and amacrine cells in the lower half of the INL (I, yellow arrow). GFP‐expressing cells in the INL were only found in locations proximal to GFP‐positive RGCs. Cb = cerebellum, GCL=ganglion cell layer (of retina), GLd = dorsal lateral geniculate nucleus, HA = hyperpallium apicale, Hp = hippocampus, INL = inner nuclear layer (of retina), LSt = lateral striatum, M = mesopallium, nBOR = nucleus of the basal optic root, N = nidopallium, NC = nidopallium caudale, ONL = outer nuclear layer (of retina), Rt = nucleus rotundus. Scale bars = 1 mm in B,F; 50 μm in H,I.
Infection with rVSV(VSV‐G) in the eye generates an anterograde transsynaptic pattern within visual circuits in zebrafish
Previous studies have mapped the projections of RGCs in zebrafish to 10 retinorecipient brain regions, including within the OT, pretectum, thalamus, preoptic area, and the accessory optic system (Burrill and Easter, 1994; Robles et al., 2014). The vast majority of RGC axons terminate in the OT (Burrill and Easter, 1994). Despite extensive characterization of retinorecipient areas, fewer studies have examined higher‐order sites within zebrafish visual pathways. To evaluate the ability of VSV to label visual circuitry in fish, we injected larval zebrafish at 2 days postfertilization (dpf) with rVSV(VSV‐G). When injected into one eye, labeling in RGC axons, pretectal, and tectal cells in the brain was apparent as soon as 24 hpi (n = 6) (Fig. 6A,B). Labeling was sparse, with specific labeling of the optic tract and RGC axon terminals (Burrill and Easter, 1994) (Fig. 6B–B2). In the OT, thalamus, and preoptic area, labeled cell bodies were seen adjacent to the optic tract, and also positioned at the midline of the ventricular zone (Fig. 6C and Supporting Movie 1). In the OT, labeled cell bodies were seen just beneath the tectal neuropil, with neurites oriented towards the RGC axon terminals (Fig. 6D). As expected for a polysynaptic tracer, we observed progressive spreading of viral infection over time (Fig. 6E,F). At 24 hpi, labeled cells were restricted to the OT and thalamus (including the eminentia thalami [EmT] and dorsal thalamus) (Fig. 6E2). At 48 hpi, efferent axons projecting to the habenula and cerebellum (Fig. 6H, arrowheads in the middle panels) were observed (n = 6). At 72 hpi, cell bodies were identified in axon target areas, primarily in the contralateral hemisphere (n = 6) (Fig. 6H, arrowheads in bottom panels). These areas include the pallium (part of the telencephalon), ipsilateral tectum, habenula, midbrain tegmentum, cerebellum, and hindbrain. These projection areas are consistent with areas that are synaptically connected with the diencephalon and OT in zebrafish and other organisms (Ewert et al., 2001; Hendricks and Jesuthasan, 2007; Sato et al., 2007; Nevin et al., 2010; Volkmann et al., 2010). These results suggest that these labeled nuclei are downstream targets of RGCs (either monosynaptic or polysynaptic connections), and that these connections had already formed in young larvae that had just started to swim and feed (5 dpf).
Figure 6.
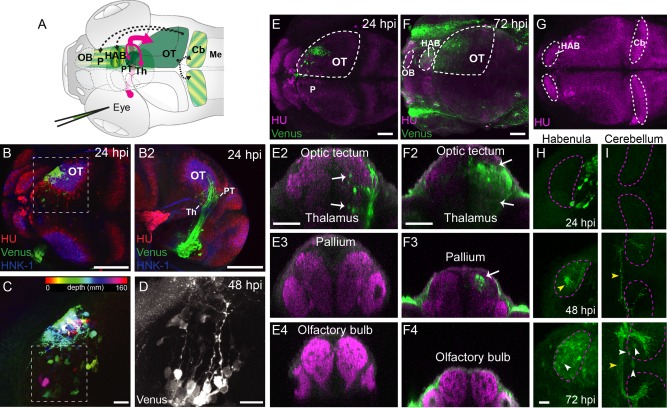
Transsynaptic labeling of the visual pathway in larval zebrafish infected with rVSV(VSV‐G). (A) Diagram of unilateral eye injection. RGC axons (red arrows) project contralaterally to the optic tectum, pretectum, and thalamus. The locations of rVSV(RABV‐G)‐infected cells are indicated by green shaded areas. Putative axonal projections from the OT to the pallium, habenula, and cerebellum are labeled as dashed arrows. (B–D) rVSV(VSV‐G) infection of the OT. Dorsal (B) and lateral (B2) views of a 24 hpi zebrafish stained for Venus (green), HuC/D (red, pan‐neuronal marker), and HNK1 (blue, neuropil). Labeled RGC termini and tectal cell bodies can be seen in the right (contralateral) tectum. Boxed area in B is shown at higher magnification in C. Spectrum of colors represents depth from the dorsal surface of the tectum (red‐yellow) to the ventral surface (blue‐pink) for Venus‐labeled cells. (D) High magnification of contralateral Venus‐labeled tectal cells at 48 hpi, in location similar to C (boxed area). The majority of the labeled tectal neurons had a single process extending medially, consistent with the previously described morphology of retinorecipient neurons (Robles et al., 2011). (E,F) Dorsal views of confocal maximal projections show rVSV(VSV‐G) labeling at 24 hpi (E) and 72 hpi (F). Areas delineated by dashed lines are the OT, habenula, and olfactory bulb. Transverse optical sections from each stage are shown in panels below (E2–E4 for 24 hpi and F2–F4 for 72 hpi). (G–I) Dorsal view of the zebrafish brain (3 dpf), stained with HuC (G). Areas delineated by dashed lines are the habenula and cerebellum, which are shown at higher magnification in H and I, respectively. 24 hpi labeling was restricted to the optic tectum, pretectum, and thalamus. At 72 hpi, labeling broadened and included cells in the pallium (F3), habenula (H), and the cerebellum (I). Labeled cells are indicated by white arrows or arrowheads and axons are labeled with yellow arrowheads). Venus‐expressing cells were not present in the olfactory bulb (E4, F4). CB: cerebellum, HAB = habenula, Me = medulla, OB = olfactory bulb, OT = optic tectum, P = pallium, PT = pretectum, Th = thalamus. Scale bars = 100 μm in B–B2; 20 μm in C,D; 50 μm E–F4; 20 μm in H,I.
Infection with rVSV(RABV‐G) in the eye generates a retrograde transsynaptic pattern within visual circuits in zebrafish
Among teleost fish, previous work has identified at least five distinct origins of centrifugal projections from the brain to the retina (Reperant et al., 2006; Reperant et al., 2007). Although the locations of centrifugal neurons vary according to species, collectively these areas include the olfactory bulb/terminal nerve (tn), thalamus, OT, pretectum, and the isthmic region (Ebbesson and Meyer, 1981; Munz et al., 1982; Stell et al., 1987; Zucker and Dowling, 1987; Reperant et al., 2006; Rosillo et al., 2013). The zebrafish centrifugal input into the retina originates in the tn, connecting the olfactory bulb and ventral pallium to the retina. However, the extent of centrifugal circuitry in zebrafish is unclear; only the olfacto‐retinal pathway has been previously studied (Li and Dowling, 2000; Maaswinkel and Li, 2003; Huang et al., 2005; Esposti et al., 2013). To further evaluate centrifugal visual circuits, we injected rVSV(RABV‐G) into the eye of 3 dpf larval zebrafish. At 24 hpi, sparse, GFP‐positive cells were evident in several brain regions including in the contralateral olfactory bulb, pallium, habenula, OT, and thalamus (n = 3) (Fig. 7A–A2). By 48 hpi, we detected an increased number of labeled cells present along the border of the olfactory bulb and pallium, and a significant number of GFP‐positive cells residing at the midline of the pallium, habenula, thalamus (n = 4) (Fig. 7B–B2). As expected with rVSV(RABV‐G) infection of RGCs, we observed dense labeling of the optic tract and RGC axon terminals in the contralateral OT. However, in contrast to rVSV(VSV‐G), infection of the eye with rVSV(RABV‐G) produced very few GFP‐positive cell bodies located in the OT (Fig. 7A,B). These data are consistent with rVSV(RABV‐G) infection of axonal terminals of olfactory bulb/tn cells in the retina (illustrated in Fig. 7C, dark green arrow), and in addition, also suggest that zebrafish may have other centrifugal circuitry, distinct from the olfacto‐retinal pathway, that are shared with other teleosts (Fig. 7C, dashed arrows).
Figure 7.
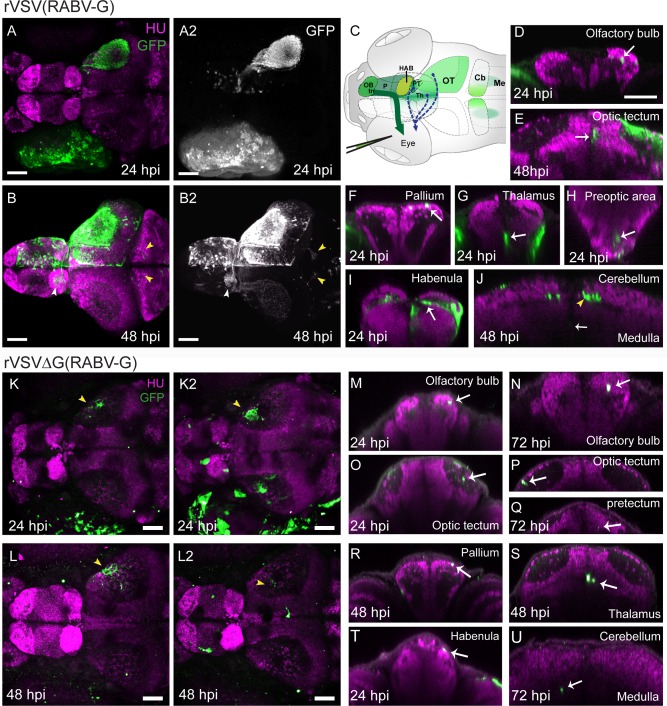
Labeling of centrifugal circuits in zebrafish with rVSV(RABV‐G). (A,B) Dorsal view of confocal maximal projections showing rVSV(RABV‐G) labeling (green, GFP) and HU (magenta, pan‐neuronal marker) at 24 hpi (A) and 48 hpi (B). GFP channel from (A,B), with signal enhanced to show cells in the brain, is shown in (A2,B2). Images in (B–B2) were captured after dissection of the brain from surrounding tissues. GFP‐labeled axonal projections from the contralateral to the ipsilateral habenula (white arrowhead) and projections from the OT to the cerebellum (yellow arrowheads) are indicated in (B–B2). (C) Illustration showing injection of rVSV(RABV‐G) into the eye of 3 dpf larval zebrafish. Centrifugal axons in the terminal nerve (tn) originate from the contralateral olfactory bulb (OB) and ventral pallium (P), and project to target cells in the retina (dark green arrow). The locations of rVSV(RABV‐G)‐infected cells after unilateral eye injection is indicated by green shaded areas. Projections from other centrifugal neurons previously reported among teleost fish are indicated by dashed arrows from the thalamus (Th), OT, and pretectum (PT). (D–J) Transverse optical sections from 24 hpi or 48 hpi are shown. At 24 hpi, labeling is restricted to the RGC axons in the neuropil of OT, and cell bodies in the OB (D), OT (E, 48 hpi shown), pallium (F), thalamus (G), preoptic area (H), habenula (I), medulla (J, 48 hpi shown), and pretectum (not shown). At 48 hpi, additional labeling was seen, including GFP‐positive efferent axons (yellow arrowhead) projecting into the contralateral and ipsilateral cerebellum (J). (K–L2) Confocal maximal projections of GFP expression and HU after injection of 1 × 10⁸ ffu/mL (K,L), or 1 × 10⁹ ffu/mL (K2,L2) rVSVΔG(RABV‐G), at 24–48 hpi. Yellow arrowheads in (K–L2) indicate RGC axons in the neuropil of the OT. In zebrafish injected with the higher dose of rVSVΔG(RABV‐G), labeling revealed primary infection in centrifugal neurons. (M–U) Representative transverse optical sections from 24–72 hpi show the results of centrifugal labeling, as sparse GFP‐expressing cells in the OB (M,N), OT (O,P), pretectum (Q), pallium (R), thalamus (S), habenula (T), and medulla (U). GFP‐labeled cells were not detected in the preoptic area (not shown) and labeled axons were not present in the cerebellum (U) following infections with rVSVΔG (RABV‐G). CB = cerebellum, HAB = habenula, Me = medulla, OB = olfactory bulb, OT = optic tectum, P= pallium, PT = pretectum, PO = preoptic area, tn = terminal nerve, Scale bars: = 50 μm.
A comparison of labeling patterns from 24 and 48 hpi suggests transmission of rVSV(RABV‐G) within the brain. At 48 hpi, we detected additional sites of GFP expression, including labeled efferent axons projecting to the contralateral and ipsilateral cerebellum, and ipsilateral tectum and habenula, along with sparse GFP‐positive cells in these locations (Fig. 7A–J). Regions containing labeled cells after rVSV(RABV‐G) infection are illustrated in Fig. 7C (green shading), and GFP‐positive cells (white arrows) were verified in transverse optical slices through the olfactory bulb, OT, pallium, thalamus, preoptic area, habenula, and cerebellum (Fig. 7D–J).
In order to distinguish primary centrifugal neurons from those labeled by polysynaptic transmission of rVSV(RABV‐G), we utilized a pseudotyped rVSVΔG (RABV‐G) (Chandran et al., 2005) previously characterized in mice (Beier et al., 2011). rVSVΔG(RABV‐G) has been engineered to have a deletion of the G gene in the viral genome. When grown in tissue culture, the virions are supplied with RABV‐G protein (“pseudotyped”), which endows them with infectivity of cells at the injection site. However, due to the lack of a G gene in the viral genome, rVSVΔG (RABV‐G) is not able to transmit from initially infected cells. In addition to infection of cells at the injection site, rVSVΔG (RABV‐G) virions in the inoculum can be transported via axon terminals to cell bodies (as also occurs with rVSV(RABV‐G)). We injected rVSVΔG(RABV‐G) into the eye and examined GFP expression at 24, 48, and 72 hpi (n = 3 for each timepoint). Due to its lack of replication, infection with rVSVΔG(RABV‐G) would be expected to produce sparse labeling at all timepoints, as was observed (Fig. 7K–U). Following injection into the eye of a stock at a concentration of 1 × 10⁸ ffu/mL rVSVΔG(RABV‐G), labeled cells were present in the retina, and GFP‐positive RGC axon terminals were detected in the OT (Fig. 7K,L, yellow arrowheads). However, GFP‐positive cells were not detected in the brain. In fact, in order to see labeling of cell bodies in the brain, we needed to inject 10 times more rVSVΔG(RABV‐G) than rVSV(RABV‐G) (Fig. 7K–L2). Although this high number of virions delivered to the retina facilitated the infection of centrifugal neurons in the brain, it also resulted in death of neurons in the retina by the time the tissue was analyzed, as indicated by the reduced numbers and morphology of labeled cells (Fig. 7K2 vs. L2). Following retinal infection with a high dose of rVSVΔG(RABV‐G), a few labeled RGC axon terminals were still visible in the contralateral OT (Fig. 7K,L2, yellow arrowheads) and, importantly, a small number of GFP‐positive primary centrifugal target cells were identified in several brain areas, including the contralateral olfactory bulb, OT, pretectum, pallium, habenula, medial thalamus, and the ipsilateral and contralateral medulla (Fig. 7M–U, white arrows). All areas containing labeled cells were previously identified using rVSV(RABV‐G). In contrast to labeling with rVSV(RABV‐G), however, rVSVΔG(RABV‐G) infected GFP‐expressing cells were not detected in the preoptic area or in the cerebellum (Fig. 7U and data not shown). These data help to clarify the locations of primary centrifugal neurons and further suggest that the centrifugal visual system in zebrafish is more extensive than previously characterized.
Infectivity in nonhuman primates in vivo
Although nonhuman primates (NHPs) provide important models for complex brain functions, few techniques exist for studying connectivity, or even for intense fluorescent labeling of neurons, in NHPs. Although previous work has shown that NHPs can be infected with rVSV (Hurst, 1933, 1936; Baskerville and Lloyd, 1977; Geisbert et al., 2008; Clarke et al., 2014), direct infection of CNS tissue and an assessment of the utility of rVSV as a neuronal tracer have not been carried out. For an initial experiment, two squirrel monkeys (examples of New World monkeys) were injected, and a conservative, short survival time of 3 days was chosen to reduce the possibility of morbidity. The injection sites and the locations of labeled neurons and processes are shown in Figure 8A. In monkey #1, rVSV(RABV‐G)‐infected neurons expressing GFP were found within 3 mm of the injection site in primary visual cortex (V1) (Fig. 8B). In monkey #2, injection of rVSV(RABV‐G) encoding mCherry yielded labeled neurons not only near the site of injection in primary somatosensory cortex (S1) (Fig. 8C) but also in a subcortical structure, the basal forebrain nucleus of Meynert (Fig. 8D), which was 12–15 mm from the injection site. The anterograde transsynaptic tracer, rVSV(VSV‐G), labeled neurons at the injection site in primary motor cortex (M1) (Fig. 8E), and labeled axons descending 5–6 mm away from primary motor cortex into the white matter (Fig. 8F).
Figure 8.
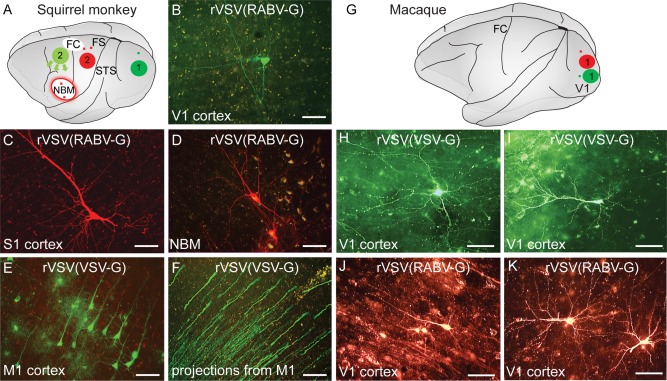
rVSVs can infect squirrel monkeys and macaques. (A) Schematic drawing of a squirrel monkey brain, indicating location of the injection sites in primary visual cortex of monkey #1 (dark green), in the motor cortex (light green), and in the somatosensory cortex (red) of monkey #2. Arrows indicate projections originating at the site of the motor cortex injection, small red and green dots represent retrogradely labeled neurons from the sites of somatosensory and visual cortex injections, respectively. The area demarcated by the red oval corresponds to the nucleus basalis of Meynert (NBM) (B) A GFP‐expressing neuron in the visual cortex after injection of rVSV(RABV‐G) encoding GFP into the primary visual cortex in monkey #1. This pyramidal neuron is located ∼3 mm dorsal to the injection site and is presumably labeled by retrograde uptake of the primary inoculum. (C,D) Neuronal labeling by presumed retrograde uptake after injection of an mCherry‐encoding rVSV(RABV‐G) into the primary somatosensory cortex in monkey #2. (C) Labeled pyramidal neuron in cerebral cortex ∼3 mm dorsal to the injection site. (D) Presumptive cholinergic neurons in basal forebrain nucleus of Meynert. (E,F) Results of the injection of rVSV(VSV‐G)‐expressing Venus into the primary motor cortex of squirrel monkey #2. (E) Labeled pyramidal neurons and interneurons at the injection site. (F) Venus was seen in the axons originating from the infected neurons at the injection site, projecting away from cortex into the white matter going towards internal capsule. (G–K) Labeling of cortical neurons after rVSV injections into the primary visual area in a macaque monkey. (G) Schematic drawing of a macaque brain showing injection sites of rVSV(VSV‐G) (dark green) and rVSV(RABV‐G) (red) in the primary visual cortex. Small red and green dots represent location of rVSV(VSV‐G) (green) or rVSV(RABV‐G) (red) labeled neurons from the sites of somatosensory and visual cortex injections (H,I) Labeled neurons near the site of injection of rVSV(VSV‐G) encoding Venus into V1. (J,K) Labeled neurons near the site of injection of rVSV(RABV‐G) encoding mCherry into V1. FC = central fissure; FS = Sylvian fissure; NBM = nucleus basalis of Meynert; STS = superior temporal sulcus, V1 = primary visual cortex. Scale bars = 50 μm in B,C,E,G–J; 100 μm in D,F.
A type of Old World monkey, a macaque, also was injected. An rVSV(RABV‐G) encoding mCherry and a rVSV(VSV‐G) encoding Venus were injected into V1, and labeling was examined at 4 dpi (Fig. 8G–K). There were mCherry‐expressing neurons in the LGN, consistent with retrograde uptake of rVSV(RABV‐G) virions, as well as mCherry labeled neurons near the injection site (Fig. 8J,K). Venus‐expressing neurons also were seen at the injection site of rVSV(VSV‐G), consistent with infection of cells at the site, and perhaps due to local spread. As with injection of rVSV(VSV‐G) into the squirrel monkeys, and as with injection of the other species discussed above, there was no evidence of long‐distance retrograde labeling by rVSV(VSV‐G). In all VSV‐infected animals, we did not find definitive evidence of long‐distance transsynaptic labeling, perhaps due to a survival time that was insufficient for long‐distance viral transmission. It is possible that there was transmission locally at the injection site, which was not possible to distinguish from labeling via initial infection of cells at the injection site.
rVSV(VSV‐G) can infect many retinal cell types in the seahorse
The lined seahorse, Hippocampus erectus, is a species of bony marine fish unique in form, physiology, and behavior (Fig. 9A). Seahorses are visually guided ambush predators with a variety of visual specializations, including a foveal retina, ocular independence, and diverse retinal topologies and spectral sensitivities (Mosk et al., 2007; Lee and O'Brien, 2011). Little is understood about the neuronal circuitry that mediates the unique behaviors of these fish due in part to the lack of effective neural tracing tools. To begin to explore whether VSV might enable studies of circuitry in this unusual species, rVSV(RABV‐G) and rVSV(VSV‐G) were injected into seahorse eyes to assess infectivity, as well as retrograde and anterograde tracing capability. rVSV(VSV‐G) injected into the vitreous cavity of the seahorse eye showed infection of many retinal cell types, including photoreceptors, interneurons, Müller glia, and RGCs (Fig. 9B). Virally labeled RGC axons were seen to extend through the optic nerve into the brain, passing through the diencephalon and into the OT (Fig. 9C–E). Projections were always limited to the contralateral side of the brain and never extended bilaterally.
Figure 9.
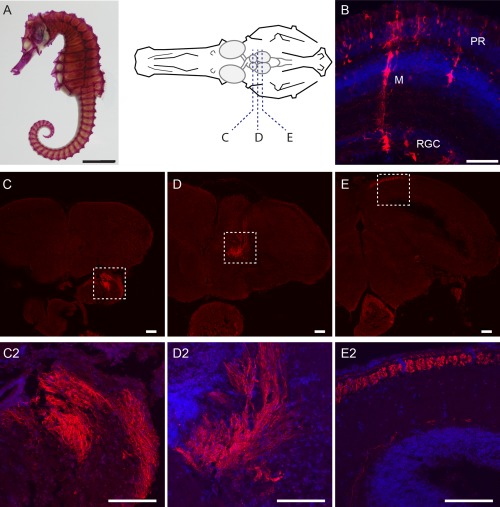
rVSV(VSV‐G) can infect seahorse retinae and allows mapping of retinorecipient areas in the brain. (A) Skeletal preparation of a seahorse (Hippocampus erectus) and schematic drawing of a seahorse skull with the brain. Dashed lines indicate approximate brain regions for sections in C–E. (B) Injection of rVSV(VSV‐G) into the retina resulted in infection of various retinal cell types (3 dpi). (C–E) Brain sections depicting labeled RGC arbors throughout the seahorse brain, following injection of rVSV(VSV‐G) into the retina. C2, D2, E2 are higher‐magnification images of RGC axons in C–E. A small number of infected cell bodies were detected in the brain. Red = GFP, blue = DAPI. PR = photoreceptors, M = Müller glia, RGC = retinal ganglion cells. Scale bars = 50 μm.
rVSV(RABV‐G) injected into the vitreous cavity of the seahorse eye infected a limited set of cell types, specifically RGCs and Müller glia (data not shown). rVSV(RABV‐G)‐labeled axons were largely restricted to the optic tract, with very little labeling observed beyond this point. Labeled RGC axons were never observed in the OT or in any other brain region, suggesting that, similar to the results in chicken and zebrafish, rVSV(RABV‐G) may have slower kinetics than the rVSV(VSV‐G) in the seahorse.
Infectivity of invertebrate model organisms by rVSV in vivo
The cubozoan visual system is emerging as a tractable experimental system for invertebrate visual system processing. It has highly developed camera type eyes (Nilsson et al., 2005) and elaborate visual behaviors (Garm et al., 2007, 2011), despite having only about 1,000 neurons available for visual processing (Skogh et al., 2006). Tripedalia cystophora is a popular representative of the cubozoans, and thus this species was tested for infectivity by rVSV. The vitreous space between the lens and the photoreceptors of the lower lens eye of 10 animals was injected with rVSV(VSV‐G) (Fig. 10A,B). The virus infected the retinal photoreceptors within 2 days of injection (Fig. 10C,D). No evidence of viral spread was observed, even after 7 dpi.
Figure 10.
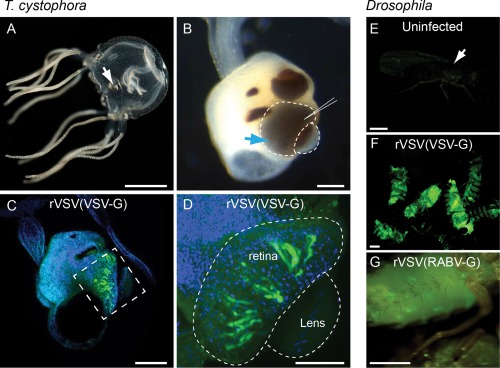
Recombinant VSV vectors can infect invertebrate organisms. (A,B) Image of the box jellyfish, Tripedalia cystophora (A). The visual system is comprised of four sensory structures, or rhopalia (white arrow in (A). Image in (B) shows higher magnification of rhopalium in (A). There are six eyes located on each rhopalium, two of which are camera‐type lens eyes (blue arrow, B). The vitreous space of the lower lens eye was injected with rVSV(VSV‐G) (injection site indicated by needle in B) and the infection was monitored for a total of 7 dpi. (C,D) Photoreceptors in all 10 injected animals expressed Venus by 2 dpi. (C) Lateral view of entire rhopalium, with orientation as in (B), shows Venus expression in the photoreceptors of the lower lens eye (C, boxed area). Green = Venus, blue = DAPI. (D) Higher magnification of boxed region in C showing rVSV(VSV‐G) infection in retinal photoreceptors of the everted lens eye (dashed lines). Images taken at 2 dpi. (E–G) Recombinant VSV vectors could also infect Drosophila melanogaster. (E) Uninfected flies were nonfluorescent, while those infected with rVSV‐Venus(VSV‐G) (F) or rVSV‐GFP(RABV‐G) (G) showed fluorescent protein expression. Images taken 1 dpi. Scale bars = 5 mm in A; 100 μm in B,C; 50 μm in D; 0.5 mm in E–G.
In addition to cubozoans, previous studies of VSV infection in its natural environment, as well as in the lab, suggested that rVSV can infect invertebrates (Tesh et al., 1977; Wyers et al., 1980; Mead et al., 2000; Zarate and Novella, 2004; Shelly et al., 2009). We thus tested the ability of rVSV vectors to infect the fruit fly, D. melanogaster. Both rVSV(VSV‐G) and rVSV(RABV‐G) infected Drosophila, as many brightly labeled fluorescent cells were observed at the injection sites (Fig. 10E–G). However, no evidence of spread was observed, perhaps due to the activation of autophagy (Shelly et al., 2009), or insufficient synthesis and/or modification of G proteins (Wyers et al., 1980).
DISCUSSION
Transsynaptic viral tracers provide a valuable platform for the visualization and dissection of functional neuronal networks. Historically, tracers were developed to label mammalian circuitry (Callaway, 2008) and relatively few methods have been developed for mapping circuity in other model organisms, such as chicken, zebrafish, or Xenopus. Our previous work in mice demonstrated that changes in the G protein of VSV lead to exclusive anterograde (VSV‐G) or retrograde (RABV‐G) directional transsynaptic transmission between synaptically connected neurons (Beier et al., 2011, 2013b). However, the host range and effectiveness of these vectors as circuitry tracers had not been examined in other organisms. Here we present data demonstrating that rVSV enables tracing of neural circuitry in a wide range of organisms and in predictable directions dictated by VSV‐G or RABV‐G. Our studies in mice, chicken, and zebrafish establish the utility of these vectors to identify patterns of connectivity in distinct visual pathways. Further, we show that both retrograde and anterograde rVSV tracers have an expansive host range, and effectively labeled human, monkey, dog, mouse, hamster, chicken, and axolotl cells in vitro. These studies also demonstrated that rVSV was able to infect neurons and facilitate gene transfer in vivo in all vertebrates tested (mice, chicken, zebrafish, squirrel monkeys, macaque, seahorses), and in invertebrates such as the box jellyfish. In addition, our preliminary results from infections using rVSV(VSV‐G) in the eyes of adult axolotls and Xenopus tadpoles showed viral labeling of RGC axons and transmission to cells in the OT (data not shown). These findings suggest that rVSV may be an effective vector for comparative circuitry tracing among vertebrates, as well as for studies of gene function in species with few genetic tools. For explorations of the use of rVSV in these and other organisms, the data presented here provide a starting point. It is likely that the time course of transmission, as well as cellular toxicity, will vary among species and among cell types, and will need to be determined empirically for each system under study.
Several aspects of VSV make it particularly well suited for mapping connected neurons in diverse species. VSV encodes its own RNA polymerase, and does not appear to depend on the host cell machinery for viral gene transcription and RNA metabolism. Moreover, its assembly and budding processes also seem to rely primarily on viral gene products, and/or highly conserved host activities, as evidenced by the spread of VSV from insects to mammals in its natural environment (Comer et al., 1990; Mead et al., 1999, 2004; Zarate and Novella, 2004). The VSV G protein has been found to promote infection in a wide range of species, when on the surface of the VSV virion, or when on the surface of other types of viruses (Knipe and Howley, 2007). In the current study we found that each organism tested was infectable with VSV, both with VSV‐G and RABV‐G glycoproteins. In addition to its wide host range and rapid gene expression, VSV is not as biohazardous as other viruses used for neuronal tracing. In its native form, VSV is endemic in some human populations with little evidence of pathology (Johnson et al., 1966; Nichol, 1994). Its low toxicity, flexibility in accepting the G proteins from other viruses, and its ease of replication in tissue culture have made VSV an attractive candidate for the production of viral vaccines for humans (Lichty et al., 2004). Injection of the rVSVs used here, in muscle or footpads of mice, resulted in no evidence of morbidity (Goz Ayturk, Beier, Cepko, unpublished). In contrast, wildtype RABV is lethal upon peripheral injection (Fujii et al., 1994). It should be noted, however, that lack of toxicity to the organism does not mean that there is no toxicity in individual infected cells. When rVSV was introduced in culture, most cells tested were compromised, as were neurons in vivo, with the extent of toxicity differing depending on the organism and the duration of the infection.
The rapid onset of gene expression establishes VSV as a convenient gene expression vector in these different organisms, both in tissue culture and in vivo (van den Pol et al., 2009), albeit with consideration given to the eventual cytotoxicity. However, of greater interest for work in some organisms was the potential of rVSV for gene transfer in vivo, making possible studies of gene function, as well as the possibility of tracing neural circuitry. Although VSV‐G had been shown to lack species‐specificity, it had not been established that RABV‐G would endow such a wide host range. Receptors have been defined for RABV‐G (Lafon, 2005), but it is not clear if the defined receptors are the only ones, or even if they are necessary for infection in different cell types or organisms. It is intriguing that viral infection via the two G proteins tested was not limited to a few organisms. This implies either a highly conserved, specific set of receptors, or a lack of specific receptors. For VSV‐G, this latter hypothesis may pertain (Marsh and Helenius, 1989), although very recent studies have suggested that the highly conserved LDL receptor might provide a universal receptor (Finkelshtein et al., 2013; Amirache et al., 2014).
rVSV transmission patterns in the visual system are consistent with previously described pathways
The value of these vectors lies in the prospect of discovering previously unknown circuitry. Because of the accessibility of the chick model system, avian visual pathways have been extensively studied for over a century (Cajal, 1911), and provide an ideal system in which to test the anterograde circuity tracing capabilities of rVSV(VSV‐G). We found that rVSV(VSV‐G) infection in the eye followed a transsynaptic pattern of spread through nearly all of the established neuronal networks in the tectofugal and thalamofugal visual pathways, including rapid labeling of the major retinorecipient areas (OT, GLd), secondary regions (SGC, hyperpallium), and even higher‐order regions including the Rt, entopallium, mesopallium, lateral striatum, and cerebellum. It is interesting to note that, as expected with a polysynaptic tracer, the most abundant labeling within the OT was localized to the SGC output layer and not the primary retinorecipient laminae. This is consistent with the convergent nature of this circuit, as a large number of synaptic connections exist between single RGCs, target cells in retinorecipient laminae, and SGC neurons (LaVail and Cowan, 1971; Crossland et al., 1975; Luksch et al., 1998). In addition, given the very rapid and extensive degree of labeling of the SGC, we favor the hypothesis that there is rapid transmission among the local neurons of the SGC.
Examination of the transmission pattern of rVSV(VSV‐G) in zebrafish also showed labeling consistent with previously described patterns obtained with horseradish peroxidase (HRP), DiI, transgenic, or mosaic labeling (Ebbesson and Meyer, 1981; Burrill and Easter, 1994; Hendricks and Jesuthasan, 2007; Nevin et al., 2010; Robles et al., 2011). In addition, it revealed a pathway between RGCs and the habenula in larval zebrafish, which was previously unknown. The habenula is an important region for many behaviors related to vision, including spatial learning, aversive response, and circadian rhythm (Bianco and Wilson, 2009; Lee et al., 2010). These results suggest that the visual pathway may directly modulate the output of the habenula during these behaviors. We are not yet able to resolve the complete neural circuit from RGC to habenula, but the likely intermediate area is the EmT, the main source of input to the habenula in zebrafish (Hendricks and Jesuthasan, 2007). EmT labeling in our samples was frequently observed. Additional experiments will be needed to determine whether the EmT neurons innervated by RGCs project to the habenula directly, and if specific RGC cell types are involved in the RGC‐habenula circuit.
The results with rVSV(RABV‐G) injection of chicken and zebrafish retina were consistent with retrograde transmission in established centrifugal pathways, but suggested undocumented connections as well. The rVSV(RABV‐G) transmission pattern observed in chicken is in agreement with extra‐tectal afferents to the ION from accessory optic system regions (AVT, PRF, MRF), and help to clarify previous conflicting data (Crossland et al., 1975; Miceli et al., 1993; Reperant et al., 2006). In chick, we also observed rVSV(RABV‐G) transmission in other, previously unreported locations, including the cerebellum, lateral hypothalamic nucleus, rotundus, and pallium. Our findings suggest that in both zebrafish and chicken centrifugal visual neurons are located in, or are in close proximity to, primary visual centers, and that the centrifugal visual system in zebrafish is more extensive than previously characterized. In addition to rVSV(RABV‐G) labeling of the OB in zebrafish, labeled cell bodies in the OT, pretectum, thalamus, habenula, pallium, preoptic area, and medulla were observed. Use of a monosynaptic rVSVΔG(RABV‐G) confirmed that these are likely to be primary centrifugal neurons. While these findings are novel regarding zebrafish centrifugal circuitry, they are perhaps not surprising, given that similar projections have been observed in other teleost species, and the visual system is generally highly conserved (Reperant et al., 2006, 2007). The fact that the signal from viral tracers does not dilute as they move among connected cells, and the fact that there is a high degree of viral gene expression by rVSV, endows rVSV with a high degree of sensitivity that can reveal previously undetected connections.
The data shown here do not provide a comprehensive mapping of all circuits in chick and zebrafish visual systems. More work will need to be done to thoroughly characterize whether the directionality of transmission of rVSV(RABV‐G) vs. rVSV(VSV‐G) is exclusively retrograde versus anterograde, respectively, in all species. However, the data presented here, as well as previous work, support the hypothesis that exclusive directionality of VSV spread is endowed by these two G proteins (Tashiro et al., 1990; Beier et al., 2011). For example, the anterograde transmission pattern from the retina to distinct laminae in the OT using rVSV(VSV‐G), but not rVSV(RABV‐G), is consistent with previous findings with traditional neuroanatomical tracers, including PHA‐L, CTB, BDA, HRP, Fluoro‐Gold, biocytin, and DiI (Thanos and Bonhoeffer, 1987; Vanselow et al., 1989; Reuss and Decker, 1997; Luksch et al., 1998; Sebesteny et al., 2002). Likewise, retrograde transmission of rVSV(RABV‐G) is suggested by specific labeling of neurons in layers 9 and 10 of the OT after retinal infection with rVSV(RABV‐G), but not with rVSV(VSV‐G), and agrees with prior isthmo‐tectal tracing with PHA‐L, fluorogold, fast blue, microspheres, and HRP (Woodson et al., 1991). In addition, rVSV directional specificity is also indicated by the retrograde viral transmission from the tectum to the retina by rVSV(RABV‐G), but not rVSV(VSV‐G), as shown in Figure 5. We speculate that the directionality of spread is due to the targeting of the G proteins to different cellular compartments.
In previous work, we used electrophysiological recordings to show that rVSV spread among hippocampal neurons of the mouse was indeed transsynaptic (Beier et al., 2011). In addition, following infection of the murine visual system, basal ganglia, and olfactory epithelium, the patterns of spread were as predicted for transsynaptic transmission. There was a lack of infection of cells that were not neurons, with the exception of Müller glia, and the rostral migratory stream of the olfactory system (Beier et al., 2011). These data support the contention that the virus is most efficient at transmitting across synapses, perhaps due to the close apposition of membranes at synaptic clefts.
The broad host range of rVSV facilitates studies of other model organisms
We demonstrate that retrograde and anterograde rVSV vectors effectively labeled neurons in two primate models, including Old and New World monkeys. rVSV labeling produced Golgi‐like fills of comparable quality to other viral tracers in use (Wickersham et al., 2013). Retrograde labeling at some distance from the injection site, using rVSV(RABV‐G), and rVSV(VSV‐G) labeling of neurons at the injection site yielded a high enough level of infection and expression without antibody enhancement to suggest that rVSV is well suited for neuron labeling and perhaps circuitry tracing in primates. Moreover, the labeling pattern observed following infection with rVSV(RABV‐G) suggests that it is an effective retrograde tracer. Neurons within the basal forebrain nucleus of Meynert, located ∼12–15 mm from the injection site in S1, suggests that there was retrograde uptake of rVSV(RABV‐G), with subsequent high level viral gene expression. The absence of retrograde labeling at a distance from the injection site following infection with rVSV(VSV‐G) is consistent with the anterograde specificity observed for rVSV(VSV‐G) infection of the other species characterized here, and in previous work (Beier et al., 2011). The survival time following infection of NHPs likely was insufficient for long‐distance transmission. Future experiments with longer survival times and/or higher viral titers will be required to determine whether the rVSV tracers are able to efficiently cross synapses in the primate brain.
This study constitutes one of the first attempts to map visual system circuits in the seahorse. The rVSVs used here not only were able to infect seahorse neurons, but also expressed at high levels, permitting robust fluorophore expression in axons that project to downstream targets without antibody enhancement. Our results also demonstrate some initial characteristics of the neural circuitry of the seahorse visual system, e.g., monocular projections extended into the contralateral, but not into the ipsilateral, hemisphere. Further studies will be needed to determine whether and under what circumstances rVSV(VSV‐G) might be used for transsynaptic neural tracing in the seahorse, and to fully characterize anterograde and retrograde circuits in these fish, which currently lack neuroanatomical reference materials. However, our findings suggest that rVSVs may be valuable to the fish neural research community, especially for the study of species where few genetic tools are available.
Characterizing the structure and function of the visual system in higher organisms remains a difficult task due to the complexity of the circuitry involved. In contrast, the cubozoans provide valuable models for the dissection of visual circuitry among a relatively small number of neurons. Extracellular electrophysiological approaches are readily available for recording afferent signals from the epidermal stalk nerve or electroretinogram from the retina, but intracellular recordings from single neurons are impeded by the lack of visual landmarks in the rhopalial nervous system. Methods such as the introduction of channel rhodopsin (Boyden et al., 2005) or genetically engineered voltage‐sensitive fluorescent proteins (Alford et al., 2013) are attractive possibilities. However, all attempts to transduce cubozoans in the lab setting have thus far been unsuccessful. Therefore, while the current rVSV vectors did not show transsynaptic spread in box jellyfish, they were able to effect gene transfer and high‐level gene expression in cubozoans. Perhaps, with future modifications of the virus, a viral transsynaptic tracer for jellyfish or other invertebrates may be developed.
CONFLICT OF INTEREST
The authors declare no conflict of interest.
ROLE OF AUTHORS
Research was designed by NAM, KTB, YAP, SL, DGA, VKB, ARW, ED, JB, RTB, AFS, and CLC. NAM, KTB, YAP, SL, DGA, VKB, ARW, ED, and JB performed research; NAM, KTB, YAP, SL, DGA, VKB, ARW, JB, RTB, AFS, and CLC analyzed data and NAM, KTB, and CLC wrote the article, with all authors contributing to figures and revisions.
Supporting information
Additional Supporting Information may be found in the online version of this article at the publishers website.
Movie 1. 3D projection of a 1 dpi larval zebrafish, with only the right hemisphere imaged (contralateral to the injected left eye). Immunohistochemically detected Venus expression is shown in green and HuC is stained in red.
Supplementary Figure 1
Supplementary Figure 1 Legend
ACKNOWLEDGMENTS
We thank Leah Cepko for assistance with histology, Jessica Whited for assistance with axolotls, Jenna Galloway for assistance with zebrafish, Leon Peshkin for providing Xenopus tadpoles, and Norbert Perrimon for providing Drosophila.
The first three authors contributed equally to this work.
LITERATURE CITED
- Albin RL, Young AB, Penney JB. 1995. The functional anatomy of disorders of the basal ganglia. Trends Neurosci 18: 63–64. [PubMed] [Google Scholar]
- Alford SC, Wu J, Zhao Y, Campbell RE, Knopfel T. 2013. Optogenetic reporters. Biol Cell 105: 14–29. [DOI] [PubMed] [Google Scholar]
- Amirache F, Levy C, Costa C, Mangeot PE, Torbett BE, Wang CX, Negre D, Cosset FL, Verhoeyen E. 2014. Mystery solved: VSV‐G‐LVs do not allow efficient gene transfer into unstimulated T cells, B cells, and HSCs because they lack the LDL receptor. Blood 123: 1422–1424. [DOI] [PubMed] [Google Scholar]
- Astic L, Saucier D, Coulon P, Lafay F, Flamand A. 1993. The CVS strain of rabies virus as transneuronal tracer in the olfactory system of mice. Brain Res 619: 146–156. [DOI] [PubMed] [Google Scholar]
- Baskerville A, Lloyd G. 1977. Experimental infection of monkeys with Herpesvirus suis (Aujeszky's‐disease virus). J Med Microbiol 10: 139–144. [DOI] [PubMed] [Google Scholar]
- Baskerville KA, Chang HT, Herron P. 1993. Topography of cholinergic afferents from the nucleus basalis of Meynert to representational areas of sensorimotor cortices in the rat. J Comp Neurol 335: 552–562. [DOI] [PubMed] [Google Scholar]
- Beier KT, Saunders A, Oldenburg IA, Miyamichi K, Akhtar N, Luo L, Whelan SP, Sabatini B, Cepko CL. 2011. Anterograde or retrograde transsynaptic labeling of CNS neurons with vesicular stomatitis virus vectors. Proc Natl Acad Sci U S A 108: 15414–15419. [DOI] [PMC free article] [PubMed] [Google Scholar]
- Beier KT, Borghuis BG, El‐Danaf RN, Huberman AD, Demb JB, Cepko CL. 2013a. Transsynaptic tracing with vesicular stomatitis virus reveals novel retinal circuitry. J Neurosci 33: 35–51. [DOI] [PMC free article] [PubMed] [Google Scholar]
- Beier KT, Saunders AB, Oldenburg IA, Sabatini BL, Cepko CL. 2013b. Vesicular stomatitis virus with the rabies virus glycoprotein directs retrograde transsynaptic transport among neurons in vivo. Front Neural Circuits 7: 11. [DOI] [PMC free article] [PubMed] [Google Scholar]
- Bianco IH, Wilson SW. 2009. The habenular nuclei: a conserved asymmetric relay station in the vertebrate brain. Philos Trans R Soc Lond B Biol Sci 364: 1005–1020. [DOI] [PMC free article] [PubMed] [Google Scholar]
- Boyden ES, Zhang F, Bamberg E, Nagel G, Deisseroth K. 2005. Millisecond‐timescale, genetically targeted optical control of neural activity. Nat Neurosci 8: 1263–1268. [DOI] [PubMed] [Google Scholar]
- Brandstatter R, Abraham U. 2003. Hypothalamic circadian organization in birds. I. Anatomy, functional morphology, and terminology of the suprachiasmatic region. Chronobiol Int 20: 637–655. [DOI] [PubMed] [Google Scholar]
- Brecha N, Karten HJ, Hunt SP. 1980. Projections of the nucleus of the basal optic root in the pigeon: an autoradiographic and horseradish peroxidase study. J Comp Neurol 189: 615–670. [DOI] [PubMed] [Google Scholar]
- Burrill JD, Easter SS Jr. 1994. Development of the retinofugal projections in the embryonic and larval zebrafish (Brachydanio rerio). J Comp Neurol 346: 583–600. [DOI] [PubMed] [Google Scholar]
- Bussereau F. 1971. [Study of the CO 2 sensitivity symptom induced by vesicular stomatitis virus in Drosophila melanogaster. I. VSV of the New Jersey serotype and the cocal virus]. Ann Inst Pasteur (Paris) 121: 223–239. [PubMed] [Google Scholar]
- Butler AB, Hodos W. 2005. Comparative vertebrate neuroanatomy: evolution and adaptation. New York: John Wiley & Sons. [Google Scholar]
- Cajal SR. 1911. Le lobe optique des vertebre's inferieurs, toit optique des oiseaux In: Cajal SR, editor. Histologie du Systeme Nerveux de l'homme et des Vertebre's. Madrid: Instituto Ramon y Cajal; p 196–212. [Google Scholar]
- Callaway EM. 2008. Transneuronal circuit tracing with neurotropic viruses. Curr Opin Neurobiol 18: 617–623. [DOI] [PMC free article] [PubMed] [Google Scholar]
- Chandran K, Sullivan NJ, Felbor U, Whelan SP, Cunningham JM. 2005. Endosomal proteolysis of the Ebola virus glycoprotein is necessary for infection. Science 308: 1643–1645. [DOI] [PMC free article] [PubMed] [Google Scholar]
- Clarke DK, Nasar F, Chong S, Johnson JE, Coleman JW, Lee M, Witko SE, Kotash CS, Abdullah R, Megati S, Luckay A, Nowak B, Lackner A, Price RE, Little P, Kalyan N, Randolf V, Javadian A, Zamb TJ, Parks CL, Egan MA, Eldridge J, Hendry M, Udem SA. 2014. Neurovirulence and immunogenicity of attenuated recombinant vesicular stomatitis viruses in nonhuman primates. J Virol 88: 6690–6701. [DOI] [PMC free article] [PubMed] [Google Scholar]
- Comer JA, Tesh RB, Modi GB, Corn JL, Nettles VF. 1990. Vesicular stomatitis virus, New Jersey serotype: replication in and transmission by Lutzomyia shannoni (Diptera: Psychodidae). Am J Trop Med Hyg 42: 483–490. [DOI] [PubMed] [Google Scholar]
- Cowan WM, Clarke PG. 1976. The development of the isthmo‐optic nucleus. Brain Behav Evol 13: 345–375. [DOI] [PubMed] [Google Scholar]
- Crossland WJ, Cowan WM, Rogers LA. 1975. Studies on the development of the chick optic tectum. IV. An autoradiographic study of the development of retino‐tectal connections. Brain Res 91: 1–23. [DOI] [PubMed] [Google Scholar]
- De Long GR, Coulombre AJ. 1965. Development of the retinotectal topographic projection in the chick embryo. Exp Neurol 13: 351–363. [DOI] [PubMed] [Google Scholar]
- DeFalco J, Tomishima M, Liu H, Zhao C, Cai X, Marth JD, Enquist L, Friedman JM. 2001. Virus‐assisted mapping of neural inputs to a feeding center in the hypothalamus. Science 291: 2608–2613. [DOI] [PubMed] [Google Scholar]
- Ebbesson SO, Meyer DL. 1981. Efferents to the retina have multiple sources in teleost fish. Science 214: 924–926. [DOI] [PubMed] [Google Scholar]
- Enquist LW, Husak PJ, Banfield BW, Smith GA. 1998. Infection and spread of alphaherpesviruses in the nervous system. Adv Virus Res 51: 237–347. [DOI] [PubMed] [Google Scholar]
- Esposti F, Johnston J, Rosa JM, Leung KM, Lagnado L. 2013. Olfactory stimulation selectively modulates the OFF pathway in the retina of zebrafish. Neuron 79: 97–110. [DOI] [PMC free article] [PubMed] [Google Scholar]
- Ewert JP, Buxbaum‐Conradi H, Dreisvogt F, Glagow M, Merkel‐Harff C, Rottgen A, Schurg‐Pfeiffer E, Schwippert WW. 2001. Neural modulation of visuomotor functions underlying prey‐catching behaviour in anurans: perception, attention, motor performance, learning. Comp Biochem Physiol A Mol Integr Physiol 128: 417–461. [DOI] [PubMed] [Google Scholar]
- Finkelshtein D, Werman A, Novick D, Barak S, Rubinstein M. 2013. LDL receptor and its family members serve as the cellular receptors for vesicular stomatitis virus. Proc Natl Acad Sci U S A 110: 7306–7311. [DOI] [PMC free article] [PubMed] [Google Scholar]
- Fujii H, Takita‐Sonoda Y, Mifune K, Hirai K, Nishizono A, Mannen K. 1994. Protective efficacy in mice of post‐exposure vaccination with vaccinia virus recombinant expressing either rabies virus glycoprotein or nucleoprotein. J Gen Virol 75(Pt 6): 1339–1344. [DOI] [PubMed] [Google Scholar]
- Garm A, O'Connor M, Parkefelt L, Nilsson DE. 2007. Visually guided obstacle avoidance in the box jellyfish Tripedalia cystophora and Chiropsella bronzie. J Exp Biol 210(Pt 20): 3616–3623. [DOI] [PubMed] [Google Scholar]
- Garm A, Oskarsson M, Nilsson DE. 2011. Box jellyfish use terrestrial visual cues for navigation. Curr Biol 21: 798–803. [DOI] [PubMed] [Google Scholar]
- Geisbert TW, Daddario‐Dicaprio KM, Geisbert JB, Reed DS, Feldmann F, Grolla A, Stroher U, Fritz EA, Hensley LE, Jones SM, Feldmann H. 2008. Vesicular stomatitis virus‐based vaccines protect nonhuman primates against aerosol challenge with Ebola and Marburg viruses. Vaccine 26: 6894–6900. [DOI] [PMC free article] [PubMed] [Google Scholar]
- Graham FL, Smiley J, Russell WC, Nairn R. 1977. Characteristics of a human cell line transformed by DNA from human adenovirus type 5. J Gen Virol 36: 59–74. [DOI] [PubMed] [Google Scholar]
- Güntürkün O, Miceli D, Watanabe D. 1993. Anatomy of the avian thalamofugal pathway In: Zeigler HP, Bischof H, editors. Vision, brain, and behavior in birds. Cambridge, MA: MIT Press; p 115–135. [Google Scholar]
- Hendricks M, Jesuthasan S. 2007. Asymmetric innervation of the habenula in zebrafish. J Comp Neurol 502: 611–619. [DOI] [PubMed] [Google Scholar]
- Himly M, Foster DN, Bottoli I, Iacovoni JS, Vogt PK. 1998. The DF‐1 chicken fibroblast cell line: transformation induced by diverse oncogenes and cell death resulting from infection by avian leukosis viruses. Virology 248: 295–304. [DOI] [PubMed] [Google Scholar]
- Huang L, Maaswinkel H, Li L. 2005. Olfactoretinal centrifugal input modulates zebrafish retinal ganglion cell activity: a possible role for dopamine‐mediated Ca2+ signalling pathways. J Physiol 569(Pt 3): 939–948. [DOI] [PMC free article] [PubMed] [Google Scholar]
- Hunt SP, Kunzle H. 1976. Observations on the projections and intrinsic organization of the pigeon optic tectum: an autoradiographic study based on anterograde and retrograde, axonal and dendritic flow. J Comp Neurol 170: 153–172. [DOI] [PubMed] [Google Scholar]
- Hurst EW. 1933. Studies on pseudorabies (infectious bulbar paralysis, mad itch): I. Histology of the disease, with a note on the symptomatology. J Exp Med 58: 415–433. [DOI] [PMC free article] [PubMed] [Google Scholar]
- Hurst EW. 1936. Studies on pseudorabies (infectious bulbar paralysis, mad itch): III. The disease in the rhesus monkey, Macaca mulatta. J Exp Med 63: 449–463. [DOI] [PMC free article] [PubMed] [Google Scholar]
- Johnson KM, Vogel JE, Peralta PH. 1966. Clinical and serological response to laboratory‐acquired human infection by Indiana type vesicular stomatitis virus (VSV). Am J Trop Med Hyg 15: 244–246. [DOI] [PubMed] [Google Scholar]
- Kelly RM, Strick PL. 2000. Rabies as a transneuronal tracer of circuits in the central nervous system. J Neurosci Methods 103: 63–71. [DOI] [PubMed] [Google Scholar]
- Knipe DM, Howley PM. 2007. Fields virology. Philadelphia: Lippincott Williams & Wilkins. [Google Scholar]
- Lafon M. 2005. Rabies virus receptors. J Neurovirol 11: 82–87. [DOI] [PubMed] [Google Scholar]
- LaVail JH, Cowan WM. 1971. The development of the chick optic tectum. I. Normal morphology and cytoarchitectonic development. Brain Res 28: 391–419. [DOI] [PubMed] [Google Scholar]
- Lee HR, O'Brien KM. 2011. Morphological and behavioral limit of visual resolution in temperate (Hippocampus abdominalis) and tropical (Hippocampus taeniopterus) seahorses. Vis Neurosci 28: 351–360. [DOI] [PubMed] [Google Scholar]
- Lee A, Mathuru AS, Teh C, Kibat C, Korzh V, Penney TB, Jesuthasan S. 2010. The habenula prevents helpless behavior in larval zebrafish. Curr Biol 20: 2211–2216. [DOI] [PubMed] [Google Scholar]
- Li L, Dowling JE. 2000. Disruption of the olfactoretinal centrifugal pathway may relate to the visual system defect in night blindness b mutant zebrafish. J Neurosci 20: 1883–1892. [DOI] [PMC free article] [PubMed] [Google Scholar]
- Lichty BD, Power AT, Stojdl DF, Bell JC. 2004. Vesicular stomatitis virus: re‐inventing the bullet. Trends Mol Med 10: 210–216. [DOI] [PubMed] [Google Scholar]
- Lindstrom SH, Nacsa N, Blankenship T, Fitzgerald PG, Weller C, Vaney DI, Wilson M. 2009. Distribution and structure of efferent synapses in the chicken retina. Vis Neurosci 26: 215–226. [DOI] [PMC free article] [PubMed] [Google Scholar]
- Lo L, Anderson DJ. 2011. A Cre‐dependent, anterograde transsynaptic viral tracer for mapping output pathways of genetically marked neurons. Neuron 72: 938–950. [DOI] [PMC free article] [PubMed] [Google Scholar]
- Luksch H, Cox K, Karten HJ. 1998. Bottlebrush dendritic endings and large dendritic fields: motion‐detecting neurons in the tectofugal pathway. J Comp Neurol 396: 399–414. [PubMed] [Google Scholar]
- Lundh B. 1990. Spread of vesicular stomatitis virus along the visual pathways after retinal infection in the mouse. Acta Neuropathol 79: 395–401. [DOI] [PubMed] [Google Scholar]
- Lyles DS. 2000. Cytopathogenesis and inhibition of host gene expression by RNA viruses. Microbiol Mol Biol Rev 64: 709–724. [DOI] [PMC free article] [PubMed] [Google Scholar]
- Maaswinkel H, Li L. 2003. Olfactory input increases visual sensitivity in zebrafish: a possible function for the terminal nerve and dopaminergic interplexiform cells. J Exp Biol 206(Pt 13): 2201–2209. [DOI] [PubMed] [Google Scholar]
- Macpherson I, Stoker M. 1962. Polyoma transformation of hamster cell clones—an investigation of genetic factors affecting cell competence. Virology 16: 147–151. [DOI] [PubMed] [Google Scholar]
- Madin SH, Darby NB Jr. 1958. Established kidney cell lines of normal adult bovine and ovine origin. Proc Soc Exp Biol Med 98: 574–576. [DOI] [PubMed] [Google Scholar]
- Marsh M, Helenius A. 1989. Virus entry into animal cells. Adv Virus Res 36: 107–151. [DOI] [PMC free article] [PubMed] [Google Scholar]
- Mead DG, Mare CJ, Ramberg FB. 1999. Bite transmission of vesicular stomatitis virus (New Jersey serotype) to laboratory mice by Simulium vittatum (Diptera: Simuliidae). J Med Entomol 36: 410–413. [DOI] [PubMed] [Google Scholar]
- Mead DG, Ramberg FB, Besselsen DG, Mare CJ. 2000. Transmission of vesicular stomatitis virus from infected to noninfected black flies co‐feeding on nonviremic deer mice. Science 287: 485–487. [DOI] [PubMed] [Google Scholar]
- Mead DG, Gray EW, Noblet R, Murphy MD, Howerth EW, Stallknecht DE. 2004. Biological transmission of vesicular stomatitis virus (New Jersey serotype) by Simulium vittatum (Diptera: Simuliidae) to domestic swine (Sus scrofa). J Med Entomol 41: 78–82. [DOI] [PubMed] [Google Scholar]
- Metcalfe WK, Myers PZ, Trevarrow B, Bass MB, Kimmel CB. 1990. Primary neurons that express the L2/HNK‐1 carbohydrate during early development in the zebrafish. Development 110: 491–504. [DOI] [PubMed] [Google Scholar]
- Mey J, Thanos S. 1993. Developmental anatomy of the chick retinotectal projection In: Zeigler HP, Bischof H, editors. Vision, brain, and behavior in birds. Cambridge, MA: MIT Press; p 173–194. [Google Scholar]
- Miceli D, Reperant J, Marchand L, Rio JP. 1993. Retrograde transneuronal transport of the fluorescent dye rhodamine beta‐isothiocyanate from the primary and centrifugal visual systems in the pigeon. Brain Res 601: 289–298. [DOI] [PubMed] [Google Scholar]
- Mosk V, Thomas N, Hart NS, Partridge JC, Beazley LD, Shand J. 2007. Spectral sensitivities of the seahorses Hippocampus subelongatus and Hippocampus barbouri and the pipefish Stigmatopora argus. Vis Neurosci 24: 345–354. [DOI] [PubMed] [Google Scholar]
- Munz H, Claas B, Stumpf WE, Jennes L. 1982. Centrifugal innervation of the retina by luteinizing hormone releasing hormone (LHRH)‐immunoreactive telencephalic neurons in teleostean fishes. Cell Tissue Res 222: 313–323. [DOI] [PubMed] [Google Scholar]
- Nagai T, Ibata K, Park ES, Kubota M, Mikoshiba K, Miyawaki A. 2002. A variant of yellow fluorescent protein with fast and efficient maturation for cell‐biological applications. Nature biotechnology 20: 87–90. [DOI] [PubMed] [Google Scholar]
- Nevin LM, Robles E, Baier H, Scott EK. 2010. Focusing on optic tectum circuitry through the lens of genetics. BMC Biol 8: 126. [DOI] [PMC free article] [PubMed] [Google Scholar]
- Nichol ST. 1994. Vesicular stomatitis virus In: Granoff A, Webster RG, editors. Encyclopedia of virology. London: Saunders; p 1547–1555. [Google Scholar]
- Nilsson DE, Gislen L, Coates MM, Skogh C, Garm A. 2005. Advanced optics in a jellyfish eye. Nature 435: 201–205. [DOI] [PubMed] [Google Scholar]
- Pan YA, Choy M, Prober DA, Schier AF. 2012. Robo2 determines subtype‐specific axonal projections of trigeminal sensory neurons. Development 139: 591–600. [DOI] [PMC free article] [PubMed] [Google Scholar]
- Reperant J, Ward R, Miceli D, Rio JP, Medina M, Kenigfest NB, Vesselkin NP. 2006. The centrifugal visual system of vertebrates: a comparative analysis of its functional anatomical organization. Brain Res Rev 52: 1–57. [DOI] [PubMed] [Google Scholar]
- Reperant J, Medina M, Ward R, Miceli D, Kenigfest NB, Rio JP, Vesselkin NP. 2007. The evolution of the centrifugal visual system of vertebrates. A cladistic analysis and new hypotheses. Brain Res Rev 53: 161–197. [DOI] [PubMed] [Google Scholar]
- Reuss S, Decker K. 1997. Anterograde tracing of retinohypothalamic afferents with Fluoro‐Gold. Brain Res 745: 197–204. [DOI] [PubMed] [Google Scholar]
- Robles E, Smith SJ, Baier H. 2011. Characterization of genetically targeted neuron types in the zebrafish optic tectum. Front Neural Circuits 5: 1. [DOI] [PMC free article] [PubMed] [Google Scholar]
- Robles E, Laurell E, Baier H. 2014. The retinal projectome reveals brain‐area‐specific visual representations generated by ganglion cell diversity. Curr Biol 24: 2085–2096. [DOI] [PubMed] [Google Scholar]
- Rosillo JC, Olivera‐Bravo S, Casanova G, Garcia‐Verdugo JM, Fernandez AS. 2013. Olfacto‐retinalis pathway in Austrolebias charrua fishes: a neuronal tracer study. Neuroscience 253: 304–315. [DOI] [PubMed] [Google Scholar]
- Roy S, Gardiner DM, Bryant SV. 2000. Vaccinia as a tool for functional analysis in regenerating limbs: ectopic expression of Shh. Dev Biol 218: 199–205. [DOI] [PubMed] [Google Scholar]
- Rye DB, Wainer BH, Mesulam MM, Mufson EJ, Saper CB. 1984. Cortical projections arising from the basal forebrain: a study of cholinergic and noncholinergic components employing combined retrograde tracing and immunohistochemical localization of choline acetyltransferase. Neuroscience 13: 627–643. [DOI] [PubMed] [Google Scholar]
- Sato T, Hamaoka T, Aizawa H, Hosoya T, Okamoto H. 2007. Genetic single‐cell mosaic analysis implicates ephrinB2 reverse signaling in projections from the posterior tectum to the hindbrain in zebrafish. J Neurosci 27: 5271–5279. [DOI] [PMC free article] [PubMed] [Google Scholar]
- Schott DH, Cureton DK, Whelan SP, Hunter CP. 2005. An antiviral role for the RNA interference machinery in Caenorhabditis elegans. Proc Natl Acad Sci U S A 102: 18420–18424. [DOI] [PMC free article] [PubMed] [Google Scholar]
- Sebesteny T, Davies DC, Zayats N, Nemeth A, Tombol T. 2002. The ramification and connections of retinal fibres in layer 7 of the domestic chick optic tectum: a Golgi impregnation, anterograde tracer and GABA‐immunogold study. J Anat 200(Pt 2): 169–183. [DOI] [PMC free article] [PubMed] [Google Scholar]
- Shelly S, Lukinova N, Bambina S, Berman A, Cherry S. 2009. Autophagy is an essential component of Drosophila immunity against vesicular stomatitis virus. Immunity 30: 588–598. [DOI] [PMC free article] [PubMed] [Google Scholar]
- Skogh C, Garm A, Nilsson DE, Ekstrom P. 2006. Bilaterally symmetrical rhopalial nervous system of the box jellyfish Tripedalia cystophora. J Morphol 267: 1391–1405. [DOI] [PubMed] [Google Scholar]
- Standish A, Enquist LW, Schwaber JS. 1994. Innervation of the heart and its central medullary origin defined by viral tracing. Science 263: 232–234. [DOI] [PubMed] [Google Scholar]
- Stell WK, Walker SE, Ball AK. 1987. Functional‐anatomical studies on the terminal nerve projection to the retina of bony fishes. Ann N Y Acad Sci 519: 80–96. [DOI] [PubMed] [Google Scholar]
- Tashiro M, Yamakawa M, Tobita K, Seto JT, Klenk HD, Rott R. 1990. Altered budding site of a pantropic mutant of Sendai virus, F1‐R, in polarized epithelial cells. J Virol 64: 4672–4677. [DOI] [PMC free article] [PubMed] [Google Scholar]
- Tesh R, Saidi S, Javadian E, Loh P, Nadim A. 1977. Isfahan virus, a new vesiculovirus infecting humans, gerbils, and sandflies in Iran. Am J Trop Med Hyg 26: 299–306. [DOI] [PubMed] [Google Scholar]
- Thanos S, Bonhoeffer F. 1987. Axonal arborization in the developing chick retinotectal system. J Comp Neurol 261: 155–164. [DOI] [PubMed] [Google Scholar]
- Todaro GJ, Green H. 1963. Quantitative studies of the growth of mouse embryo cells in culture and their development into established lines. J Cell Biol 17: 299–313. [DOI] [PMC free article] [PubMed] [Google Scholar]
- Uchiyama H, Matsutani S, Watanabe M. 1987. Activation of the isthmo‐optic neurons by the visual Wulst stimulation. Brain Res 406: 322–325. [DOI] [PubMed] [Google Scholar]
- Ugolini G, Kuypers HG, Strick PL. 1989. Transneuronal transfer of herpes virus from peripheral nerves to cortex and brainstem. Science 243: 89–91. [DOI] [PubMed] [Google Scholar]
- van den Pol AN, Dalton KP, Rose JK. 2002. Relative neurotropism of a recombinant rhabdovirus expressing a green fluorescent envelope glycoprotein. J Virol 76: 1309–1327. [DOI] [PMC free article] [PubMed] [Google Scholar]
- van den Pol AN, Ozduman K, Wollmann G, Ho WS, Simon I, Yao Y, Rose JK, Ghosh P. 2009. Viral strategies for studying the brain, including a replication‐restricted self‐amplifying delta‐G vesicular stomatis virus that rapidly expresses transgenes in brain and can generate a multicolor Golgi‐like expression. J Comp Neurol 516: 456–481. [DOI] [PMC free article] [PubMed] [Google Scholar]
- Vanselow J, Thanos S, Godement P, Henke‐Fahle S, Bonhoeffer F. 1989. Spatial arrangement of radial glia and ingrowing retinal axons in the chick optic tectum during development. Brain Res Developmental Brain Res 45: 15–27. [DOI] [PubMed] [Google Scholar]
- Vercelli A, Repici M, Garbossa D, Grimaldi A. 2000. Recent techniques for tracing pathways in the central nervous system of developing and adult mammals. Brain Res Bull 51: 11–28. [DOI] [PubMed] [Google Scholar]
- Viney TJ, Balint K, Hillier D, Siegert S, Boldogkoi Z, Enquist LW, Meister M, Cepko CL, Roska B. 2007. Local retinal circuits of melanopsin‐containing ganglion cells identified by transsynaptic viral tracing. Curr Biol 17: 981–988. [DOI] [PubMed] [Google Scholar]
- Volkmann K, Chen YY, Harris MP, Wullimann MF, Koster RW. 2010. The zebrafish cerebellar upper rhombic lip generates tegmental hindbrain nuclei by long‐distance migration in an evolutionary conserved manner. J Comp Neurol 518: 2794–2817. [DOI] [PubMed] [Google Scholar]
- Wang Y, Major DE, Karten HJ. 2004. Morphology and connections of nucleus isthmi pars magnocellularis in chicks (Gallus gallus). J Comp Neurol 469: 275–297. [DOI] [PubMed] [Google Scholar]
- Wenk H, Bigl V, Meyer U. 1980. Cholinergic projections from magnocellular nuclei of the basal forebrain to cortical areas in rats. Brain Res 2: 295–316. [DOI] [PubMed] [Google Scholar]
- Wickersham IR, Lyon DC, Barnard RJ, Mori T, Finke S, Conzelmann KK, Young JA, Callaway EM. 2007. Monosynaptic restriction of transsynaptic tracing from single, genetically targeted neurons. Neuron 53: 639–647. [DOI] [PMC free article] [PubMed] [Google Scholar]
- Wickersham IR, Sullivan HA, Seung HS. 2013. Axonal and subcellular labeling using modified rabies viral vectors. Nat Commun 4: 2332. [DOI] [PMC free article] [PubMed] [Google Scholar]
- Wizenmann A, Thanos S. 1990. The developing chick isthmo‐optic nucleus forms a transient efferent projection to the optic tectum. Neurosci Lett 113: 241–246. [DOI] [PubMed] [Google Scholar]
- Woodson W, Reiner A, Anderson K, Karten HJ. 1991. Distribution, laminar location, and morphology of tectal neurons projecting to the isthmo‐optic nucleus and the nucleus isthmi, pars parvocellularis in the pigeon (Columba livia) and chick (Gallus domesticus): a retrograde labeling study. J Comp Neurol 305: 470–488. [DOI] [PubMed] [Google Scholar]
- Wu CC, Russell RM, Karten HJ. 2000. Ontogeny of the tectorotundal pathway in chicks (Gallus gallus): birthdating and pathway tracing study. J Comp Neurol 417: 115–132. [PubMed] [Google Scholar]
- Wyers F, Richard‐Molard C, Blondel D, Dezelee S. 1980. Vesicular stomatitis virus growth in Drosophila melanogaster cells: G protein deficiency. J Virol 33: 411–422. [DOI] [PMC free article] [PubMed] [Google Scholar]
- Wylie DR, Linkenhoker B, Lau KL. 1997. Projections of the nucleus of the basal optic root in pigeons (Columba livia) revealed with biotinylated dextran amine. J Comp Neurol 384: 517–536. [DOI] [PubMed] [Google Scholar]
- Yanagawa S, Lee JS, Ishimoto A. 1998. Identification and characterization of a novel line of Drosophila Schneider S2 cells that respond to wingless signaling. J Biol Chem 273: 32353–32359. [DOI] [PubMed] [Google Scholar]
- Yasumura Y, Kawakita Y. 1963. Studies on SV40 in tissue culture — preliminary step for cancer research “in vitro.” Nihon Rinsho 21: 1201–1215. [Google Scholar]
- Ye Z, Sun W, Suryanarayana K, Justice P, Robinson D, Wagner RR. 1994. Membrane‐binding domains and cytopathogenesis of the matrix protein of vesicular stomatitis virus. J Virol 68: 7386–7396. [DOI] [PMC free article] [PubMed] [Google Scholar]
- Zarate S, Novella IS. 2004. Vesicular stomatitis virus evolution during alternation between persistent infection in insect cells and acute infection in mammalian cells is dominated by the persistence phase. J Virol 78: 12236–12242. [DOI] [PMC free article] [PubMed] [Google Scholar]
- Zucker CL, Dowling JE. 1987. Centrifugal fibres synapse on dopaminergic interplexiform cells in the teleost retina. Nature 330: 166–168. [DOI] [PubMed] [Google Scholar]
Associated Data
This section collects any data citations, data availability statements, or supplementary materials included in this article.
Supplementary Materials
Additional Supporting Information may be found in the online version of this article at the publishers website.
Movie 1. 3D projection of a 1 dpi larval zebrafish, with only the right hemisphere imaged (contralateral to the injected left eye). Immunohistochemically detected Venus expression is shown in green and HuC is stained in red.
Supplementary Figure 1
Supplementary Figure 1 Legend